


1. Introduction
High levels of indoor air pollution from solid fuel burning contribute to enhanced rates of acute and chronic respiratory diseases, including respiratory illness in children and lung cancer in non-smoking women (Bruce et al., Reference Bruce, Perez-Padilla and Albalak2000; Smith et al., Reference Smith, Samet, Romieu and Bruce2000; Smith and Mehta, Reference Smith and Mehta2004). According to the World Health Organization (WHO, 2002), smoke from solid fuels (biomass and coal) burned in households is among the leading health risks for people in developing countries. Indoor air pollution from solid fuel use is estimated to contribute to more than 1.6 million premature deaths annually, with more than a quarter of these occurring in China. In China, 60 per cent of the population lives in rural areas, where most people use solid fuels for cooking and heating (Mestl et al., Reference Mestl, Aunan and Seip2006). In addition, many of the country's urban residents, especially in medium and smaller towns at the urban fringe of large cities, use solid household fuels.
Several studies have assessed the severity of the indoor air pollution problem at the village and household level (World Bank, 2003; Balakrishnan et al., Reference Balakrishnan, Mehta, Kumar, Ramaswamy, Sambandam, Kumar and Smith2004; Dasgupta et al., Reference Dasgupta, Huq, Khaliquzzaman, Pandey and Wheeler2006). To design better policies, however, it is important to understand both the national and regional distribution of household air pollution (HAP) and its socioeconomic drivers. Using non-parametric and parametric techniques, we employ a spatially disaggregated dataset on household sector pollution and socioeconomic variables to assess the extent to which the distribution of HAP in China is determined by income and education. Our focus on income and education variables draws on previous studies: Pfaff et al. (Reference Pfaff, Chaudhuri and Nye2004) present a theoretical framework to predict that HAP is likely to follow an N-shaped relationship with income, and using provincial-level panel data for China, Groot et al. (Reference Groot, Withagen and Minliang2004) have found that income is a determinant of water pollution and both gas and solid waste pollution.Footnote 1 More recently, Plassmann and Khanna (Reference Plassmann and Khanna2006) use spatially disaggregated cross-sectional data for the US to conclude that particulate matter pollution decreases at high levels of income.Footnote 2 Dasgupta et al. (Reference Dasgupta, Huq, Khaliquzzaman, Pandey and Wheeler2006) have found educational attainment, especially female educational attainment, to be a determinant of HAP at the village level in Bangladesh. Their study found that poorly educated women in poor households face pollution exposures that are four times those of men in higher income households.
Our contribution to the literature is to present empirical results on the socioeconomic determinants of two household air pollutants known to cause serious health damages, namely particulate matter and sulphur dioxide. Our data set, composed of over 2,700 county-level observations covering all of China, enables us take advantage of a large cross-section to analyze the socioeconomic aspects of HAP. As pointed out by Plassmann and Khanna (Reference Plassmann and Khanna2006), highly disaggregated cross-sectional data can help to avoid several types of aggregation bias in studies that use multi-country panel data. There are two stages to our analysis. First, we estimate the relationship between household sector pollution levels and both per capita income and educational attainment, using non-parametric and parametric techniques. The number of observations in our data set enables us to utilize non-parametric estimation, which helps to avoid model misspecification related to functional form. We take advantage of the spatial dimension of the data by testing and controlling for heterogeneity with detailed region-specific fixed effects. To mitigate model misspecification due to omitted variables and following similar precedents in the literature (Brooks and Sethi, Reference Brooks and Sethi1997; Plassmann and Khanna, Reference Plassmann and Khanna2006), we also consider the effect of unemployment and illiteracy. Second, we analyze the incidence of HAP across income groups using Gini coefficients and Lorenz curves for China as a whole and within urban, rural, coastal, and landlocked regions.
The incidence of pollution across income groups is often overlooked in pollution–income studies, even though it is the poorest (and least educated) segments of society that are most vulnerable to negative health impacts from pollution (Brooks and Sethi, Reference Brooks and Sethi1997; Arora and Cason, Reference Arora and Cason1999; Cifuentes et al., Reference Cifuentes, Vega and Lave1999; Dasgupta et al., Reference Dasgupta, Huq, Khaliquzzaman, Pandey and Wheeler2006). Previous studies, as well as the popular media (Economist, 2003, 2004), have cited pollution–income curves to argue we can ‘grow out of’ our pollution problems, while downplaying the impacts of ‘waiting for growth’ (Pearce, Reference Pearce2005; Johansson and Kriström, Reference Johansson and Kriström2007).Footnote 3 Indeed, our findings indicate that the poorest counties bear a highly disproportionate amount of HAP pollution. Lorenz curves and Gini coefficients are widely used in economics to estimate income inequality and have also been applied in evaluations of disparity related to a range of other issues, e.g. disparities in energy consumption (Jacobson et al., Reference Jacobson, Milman and Kammen2005) and health (Shkolnikov et al., Reference Shkolnikov, Andreev and Begun2003). By establishing county-level ‘pollution–income’ Lorenz curves, we expand the application of these metrics to the burden of air pollution.
The rest of the paper is organized as follows. Section 2 outlines the data sources, empirical framework, and estimation methodology; section 3 presents our results and discussion; and section 4 concludes.
2. Data and empirical methodology
We construct an empirical framework that takes advantage of disaggregated spatial information to estimate the relationship between income, educational attainment, and household air pollution in China, by means of pollution–income regressions using non-parametric and fully parametric estimation. We then go on to analyze the incidence of pollution among different income groups.
2.1. Dependent variables
We consider two measures of HAP: county-level ambient concentration of particulate matter (PM) and sulphur dioxide (SO2) arising from the household sector. Ideally, indoor air pollution levels resulting from each household's fuel use would be used as a direct measure of HAP. These data, however, are not available. Insofar as higher county-level ambient concentration values are an indicator of higher county-level indoor air pollution levels, we consider this variable to be a reasonable proxy.
Both SO2 and PM are air pollutants known to be closely associated with health damage. PM is a mixture of different particulate components. In epidemiological studies, PM is usually measured as TSP (total suspended particulate matter), PM10, or PM2.5 (PM with a diameter below 10 or 2.5 micrometers, respectively). Because there is no PM inventory for China, we add the modeled concentration levels of the primary particulate pollutants organic carbon (OC), black carbon (BC), and the secondary pollutant sulfate (SO 2−4) to obtain an indicator of the level of particulate pollution. As discussed in Zhang et al. (Reference Zhang, Streets, He and Klimont2007), these three pollutants make up at least 80 per cent of PM2.5 emissions from the household sector. PM2.5 is known to cause the most serious health damage (Maynard and Howard, Reference Maynard and Howard1999), which is ultimately the variable of interest in the context of this study.Footnote 4
Ambient county-level sulphur dioxide and particulate matter pollution data (in μg/m3) have been obtained in a two-stage process. First, discrete ambient pollution points were calculated using the University of Oslo chemical tracer model (Oslo CTM2). The model simulates the chemical transformation, transport by winds, and removal processes of anthropogenic and biogenic emissions, resulting in the global distribution of chemical constituencies in the troposphere (for details see Berglen et al%., Reference Berglen, Berntsen, Isaksen and Sundet2004; Myhre et al., Reference Myhre, Berntsen, Haywood, Sundet, Holben, Johnsrud and Stordal2004). Emissions of primary pollutants were input to the model; we used emissions data for the household sector in Asia taken from the sector segregated emissions inventory for the year 2000 developed by Streets et al. (Reference Streets2003). Emissions were obtained on a 1° by 1° grid and interpolated to the model grid (1.875°) before the model simulations. County-level ambient PM and SO2 observations were obtained by averaging 24-hour daily mean HAP concentrations over the six months from October to March. Winter averages are used since HAP is likely to be the worst in the winter months, when households burn fuel for both cooking and heating.
In the second stage GIS was used to transform the discrete pollution points into a continuous surface, and to obtain average county-level pollution. The continuous surface is estimated by calculating, at a resolution of 0.01 degrees of latitude, a weighted average based on the distance between the four nearest discrete pollution points. Zonal statistics then calculate the average pollution levels within each county. The estimates thus provide an index for the pollution originating from household fuel use in that county.
2.2. Independent variables
County-level socioeconomic data are from the China Census 2000, obtained from the China Data Center at the University of Michigan, in GIS format with county-level database tables. The census contains two types of information: the first, based on short survey forms given to the whole population (ex-post calculations indicate that this totalled 98.2 per cent of households – in part due to 2.5 million army personnel not included in the census), contains basic information on population composition, births and deaths, and education rates. The second type is based on long forms which were given out to 9.5 per cent of households chosen randomly by a computer program, and contains detailed information on employment, household characteristics, expenditures, and rent.
Per capita income, in thousands of yuan, is estimated from the long form data by average per county expenditures on purchasing and building housing, which is then divided by the average number of persons per household in that county. The education variable is measured by the percentage of people older than 15 whose highest educational attainment is senior middle school or above.
To control for regional heterogeneity, we add dummies for north–south, coastal–landlocked, and a variable indexing each county's province. Population density (county population divided by county area, in square kilometres) is also included as a covariate to control for the effect of population levels on ambient pollution. To mitigate misspecification arising from omitted variables and following Plassmann and Khanna (Reference Plassmann and Khanna2006), we also estimate the effect of including unemployment and illiteracy in the model.
The University of Michigan data set also distinguishes between urban and rural counties, based on administrative naming conventions. Counties named Xian are categorized as rural, whereas those named either Shi or Qu are categorized as urban. Using these categories, we include an urban–rural dummy in the model.Footnote 5
Table 1 provides an overview of the dataset. ‘PM conc’ and ‘SO2 conc’ denote particulate matter and sulphur dioxide concentrations, respectively. Rural areas have higher PM concentrations than urban ones, whereas this is reversed for SO2. This finding may reflect the fact that burning of biomass, which releases higher amounts of PM, is more dominant in rural areas, whereas SO2 is released largely from coal, which is used more commonly in urban areas. Counties in landlocked provinces have higher average PM but lower SO2 than in coastal provinces. Since the landlocked provinces have a lower concentration of urban counties, the same reasoning may apply. Counties with the highest levels of ambient PM originating from HAP are located in Sichuan, Chongqing, Guizhou, Yunnan, Shaanxi, Gansu, and Shanxi provinces, which are located in Central and Southern China. Counties with the highest levels of ambient SO2 originating from HAP are concentrated in Shandong, Henan, Hebei, Tianjin, and Jiangsu provinces, located in Central Eastern China. The last four rows present average pollution levels from the poorest to the richest quartile. Overall, the poorest 50 per cent of people have higher average PM concentrations, whereas for SO2 the middle-income groups have the highest average pollution. Results of a more detailed distributional analysis are presented in section 3.2.
Average pollution (concentrations in μg/m3)

2.3. Pollution–income regressions
The general specification for the empirical model is the following

where Cmi is average ambient concentration of pollutant m in county i, (I/P)i is income per capita in county i, ln X = [ln x 1, . . ., ln xJ]′ is a J×1 vector of county-specific covariates (educational attainment, population density, and regional dummy variables), Γ = [γ1, . . ., γJ], is a parameter vector, α 0 is a regression constant, and ui is a random error term. The index n denotes the polynomial degree with which income enters the model; as explained below we employ non-parametric regression to help ascertain the functional form of the independent variables.
Estimation methodology
Before fitting equation (1) we removed a few outliers that exhibited both large leverage and normalized squared residuals. We estimate the model solely in logarithmic form since, as explained in Stern (Reference Stern2004), an empirical model that allows pollution levels to become negative is inappropriate.
Some authors have made the point that studies on the determinants of pollution use an empirical model that is largely ad hoc (Stern, Reference Stern2004). To help avoid inconsistent estimates which could result from incorrect parameterization, our estimation methodology employs non-parametric multivariate regression splines. In comparison to parametric estimation, non-parametric procedures can impose large data and computational requirements (Yatchew, Reference Yatchew1998). However, both the size of our dataset and our choice of estimation methodology enables us to use an efficient and parsimonious approach to model selection (see Royston and Sauerbrei, Reference Royston and Sauerbrei2007).
To account for heteroscedasticity we estimate using the Huber–White heteroscedasticity-consistent estimators (White, Reference White1980). For comparison purposes, the model was also estimated using iteratively weighted least squares, another form of robust regression resistant to outliers. Since the results were very similar to those using Huber–White estimators, we do not report the weighted least squares estimates.
We estimate the parametric model using two-stage least squares (i.e. instrumental variables). Our estimation approach is guided by two primary considerations. First, income and pollution may be endogenous (see for example Chimeli and Braden, Reference Chimeli and Braden2005). If this is the case, income is correlated with the error term and OLS estimation would be inconsistent, justifying the use of instrumental variables (IV). Second, income and education are correlated (Deaton and Paxson, Reference Deaton and Paxson1999; Lleras-Muney, Reference Lleras-Muney2005; Doyle et al., Reference Doyle, Harmon and Walker2005), and as such it is difficult to disentangle the independent effect of each on the dependent variable. However, instrumenting income can also improve the precision of the education coefficients.Footnote 6 Following Wooldridge (Reference Wooldridge2002), our criteria for instrument choice were variables highly correlated with income and uncorrelated with the error term. Our best instruments were the proportion of population involved in farming and animal husbandry, unemployment level, and illiteracy; we use all three variables to instrument income. The Hansen–Sargan test for the validity of our instruments indicates our chosen instruments are valid. We use heteroscedasticity-consistent variances with the IV estimation, and also test whether clustering is present within groups. In both cases, the significance of our estimation results do not differ substantively – the most robust relationship is that of income and education. For comparison purposes, we also report model results without using IV (see section 3.1).
We test for unobserved parameter heterogeneity with a series of Chow tests, as outlined in Zietz (Reference Zietz2006). Separate Chow tests for structural differences in the estimated relationship between counties with high and low unemployment, education and illiteracy were conducted. Although the Chow tests indicate the presence of parameter heterogeneity – in other words, the parameter estimates differ between groups – we find that estimating the model using these segmented datasets does not affect the shape or statistical significance of the HAP–income relationship. Nevertheless, this finding indicates the model parameters are not only spatially dependent, but also differ between groups.
Finally, following Plassmann and Khanna (Reference Plassmann and Khanna2006), we control for other variables that may affect the distribution of pollution by including unemployment and illiteracy in the econometric model. Our results are discussed in section 3.
2.4. Distributional metrics – Gini coefficients and Lorenz curves
The Gini coefficient is one of the most commonly used indicators of inequality. It can be derived from the Lorenz curve, which is the graphical representation of the distributional relationship between two variables. Since it is possible for the same Gini coefficients to have different Lorenz curves, it is often useful to consider both the Gini coefficient and the Lorenz curve together. For example, a Lorenz curve with more inequality at the lower end (graphically, the left side) of the distribution but less inequality at the upper end, may have the same Gini coefficient as a Lorenz curve with less inequality at the lower end, but more inequality in the middle or upper range.
Gini coefficients are estimated for the pollution–income distribution of county-level PM concentration and SO2 concentration. Our Gini is computed as follows

where m indexes the pollution measure, n indexes the region (all counties, counties in coastal provinces, urban counties, etc.), i indexes counties, σZ is the cumulative percentage of county-level per capita income, ordered from the lowest to the highest, and σY is the cumulative percentage of pollution concentration in the corresponding counties. See Cowell (Reference Cowell2000), for details on Gini coefficient measurement.
By construction, Gini coefficients fall between 0 and 1; lower Gini values are associated with lower inequality. The pollution–income Gini measures the distribution of pollution concentration in counties with increasing incomes. A pollution–income Gini coefficient of 0 would indicate that the poorest 20 per cent of counties contain 20 per cent of the pollution, the second 20 per cent also receive 20 per cent, and so on. As the pollution–income Gini approaches 1, the poorest counties increasingly contain higher proportions of pollution in comparison to richer counties.
3. Results
3.1. Pollution–income regressions
Non-parametric estimates
Economic theory rarely implies a specific functional form (Yatchew, Reference Yatchew1998), and this also applies to the pollution–socioeconomic relationship (Grossman and Kruger, Reference Grossman and Krueger1995; Stern, Reference Stern2004). As such, non-parametric techniques are useful as a supplement to parametric procedures because they can deliver estimates that are less dependent on functional form assumptions.
Figure 1 presents results of estimating (1) using a multivariate non-parametric regression spline (Royston and Sauerbrei, Reference Royston and Sauerbrei2007). In figure 1, ambient PM traces an N-shaped path when plotted against income, whereas ambient SO2 traces an inverted-U. The estimates are all statistically significant. We also estimated pollution as a function of income using a univariate local averaging Epanechnikov kernel; the estimated shape was the same for both pollution indexes. There are approximately 550 counties with income levels beyond the second PM concentration turning point.Footnote 7
Non-parametric regression spline in levels (income)

The regression splines in figure 2 indicate a non-linear relationship between pollution and population density. Higher population density initially leads to a steep increase in pollution levels, but this effect rapidly tapers off at levels beyond approximately 1,000 people per square km for PM, and approximately 2,500 people per square km for SO2.
Non-parametric regression spline in levels (population density)

Figure 3 plots the pollution measures against education. Since income and education are correlated, a univariate local averaging kernel of pollution and education was used (more detailed estimates with education and income are reported in the following section). This kernel estimate suggests a cubic specification for education, especially for SO2, with pollution levels increasing beyond education rates of 30 per cent.
Univariate non-parametric kernel estimates in levels (education)

Parametric estimates
Table 2 presents results of estimating (1) using a fully parametric model for PM concentration.Footnote 8 Both cubic and quadratic specifications were estimated for all pollution indices; since the second PM turning points were consistently within the range of data points, we only report the cubic specification for this index. This finding is consistent with the non-parametric estimates (see figure 1). We include IV estimates in all columns except the last one; for comparison, this column reports robust least squares estimates. The estimated relationship is similar, with the exception that the second turning point is further to the right. The second turning point for PM occurs further to the right compared to the non-parametric results, but there are still over 280 counties with per capita income above 11 thousand Yuan, 200 counties above 12, and 130 above 15.
Particulate matter
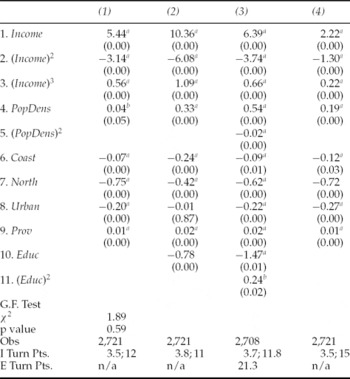
Notes: ‘a’ and ‘b’ indicate statistical significance at the 99 per cent and 95 per cent confidence levels, respectively. p-values in brackets.
Column (3) reports estimates with a non-linear term for population density and education, as suggested by the non-parametric results. Increases in education are associated with a decrease in pollution when education enters linearly, but when a quadratic education term is included, education rates beyond 21 per cent are associated with an increase in pollution for both PM and SO2 (reported in table 3). In contrast, the non-parametric kernel discussed previously suggests education rates above approximately 30 per cent are associated with higher pollution levels. Population density, as expected, is associated with an increase in pollution. When a quadratic population density term is incorporated, the results indicate population density traces an inverted-U, as in the non-parametric case.
Sulphur dioxide

Notes: ‘a’ and ‘b’ indicate statistical significance at the 99 per cent and 95 per cent confidence levels, respectively. p-values in brackets.
Table 3 presents results for SO2. Again, both cubic and quadratic specifications were estimated for this pollution index, but since the SO2 turning points were consistently out of the range of data points, we only report the quadratic specification for this index; this is consistent with the non-parametric results. IV estimates are reported in all columns except column (5); for comparison, this column reports robust least squares estimates. Including a quadratic population density term lowers the SO2 income turning point, as shown in column (2), but with both quadratic population and education the income turning point increases again, reported in column (3).
To formally test whether the parametric or non-parametric estimates best fit the data, we employed the goodness of fit test (G.F. test) suggested by Royston and Sauerbrei (Reference Royston and Sauerbrei2007). Specifically, we fit a non-parametric spline function and test whether it improves the fit significantly compared with the parametric function, fitted separately. We report two versions of the PM and SO2 parametric models, one assuming linear population density and the other assuming quadratic population density. If the smoothing spline function is not significant once the parametric function is included in the same model, the conclusion is that the parametric function is adequate. Results of the G.F. test are reported at the bottom of tables 2 and 3. In the SO2 concentration case, we reject the parametric fit if population density enters linearly, but do not reject if it enters as a quadratic. For PM concentration, we do not reject the parametric specification even if population density enters linearly.Footnote 9
We also tested the effect of incorporating unemployment and illiteracy in the model, in addition to the other covariates. The significance of the estimated parameters and turning points are largely unchanged, indicating there is no evidence of misspecification if these variables are not included. Following List and Gallet (Reference List and Gallet1999), we also tested the model with a more detailed regional disaggregation, for provinces located in the east, west, north, and south. Results of these additional regressions are available in an appendix by request from the authors.
Testing for parameter heterogeneity
We conducted Chow tests to assess whether our parameter estimates are robust to differences in the unemployment, education, and illiteracy levels in our dataset (Zietz, Reference Zietz2006). Although the Chow tests revealed parameter heterogeneity in all three cases, we find that estimating the model using these segmented datasets affects the estimated parameters but not the shape or statistical significance of the HAP–income relationship. Tables 4 and 5 present results of segmenting the datasets into counties above and below the mean levels of unemployment and education, respectively.Footnote 10 The income turning points are noted in the final row. The HAP–income curve in both tables remains significant, with initial PM turning points in line with those obtained in the non-parametric setting. However, the upward turn for PM in table 4 occurs at higher income levels than suggested by the non-parametric estimates – approximately 100 counties have income levels above 16,000 and 75 above 17,000.
Structural differences – unemployment

Notes: ‘a’ and ‘b’ indicate statistical significance at the 99 per cent and 95 per cent confidence levels, respectively. p-values in brackets.
Structural differences – education

Notes: ‘a’ and ‘b’ indicate statistical significance at the 99 per cent and 95 per cent confidence levels, respectively. p-values in brackets.
3.2. Pollution–income distribution
To analyze the incidence of pollution in different income groups, we construct spatially disaggregated Gini coefficients based on equation (2) and their corresponding Lorenz curves – we label these ‘pollution–income’ Lorenz curves. They measure the cumulative proportion of county-level income on the x-axis, ordered from the lowest to the highest, and the cumulative proportion of pollution on the y-axis.
Figures 4–6 present these results. Figure 4 presents the Ginis including all counties; figure 5 disaggregates between urban and rural counties, as well as counties located in coastal and landlocked provinces; and figure 6 disaggregates further within these categories.
Pollution−income Lorenz curves (all of China)

Pollution–income Lorenz curves: urban, rural, coastal, landlocked

Pollution–income bar chart – regional breakdown

The pollution–income curves for all of China in figure 4 reveal a considerable inequality in pollution distribution among the different income groups. PM concentration inequality is the worst overall. This is due in large part to the bottom of the distribution: the poorest 10 per cent of counties contain almost one third of ambient PM pollution. For SO2 HAP the poorest tenth of counties contain about 20 per cent of the pollution. Urban counties, in the top left panel of figure 5, compared to rural counties, in the top right panel, have higher SO2 pollution–income inequality, with 40 per cent of household SO2 pollution occurring in the poorest 20 per cent of counties. The situation is somewhat better in rural counties with respect to SO2, but PM concentrations are quite skewed towards the poor there too – 40 per cent of PM concentration accumulates to the poorest 20 per cent of rural counties. SO2 concentration is highly unequal in the coastal counties – 45 per cent of SO2 HAP accumulates in the poorest 20 per cent, and 70 per cent to the poorest 40 per cent.
The pollution–income bar chart in figure 6 presents a more detailed regional inequality breakdown. The coastal urban counties have considerably higher SO2 Ginis than landlocked urban counties. The coastal rural counties have higher pollution–income inequality for both pollution measures compared to the landlocked rural counties. Most strikingly, poor counties in the southern coastal provinces also bear a highly disproportionate amount of PM HAP concentrations, with a pollution–income Gini of 0.41 – the worst Gini of all those calculated.
4. Conclusions
We have made use of a detailed cross-section on household sector pollution and socioeconomic variables in China to find that: (i) income and education are robust determinants of HAP; (ii) both population density and education have a non-linear effect on household pollution; (iii) structural and regional parameter heterogeneity affect the turning points of the HAP–income relationship; and (iv) the poorest counties bear a highly disproportionate amount of total pollution.
Although income and education are robust determinants of HAP, it is virtually impossible to talk about the HAP–income relationship in China. Region-specific fixed effects are significant in all specifications, illustrating the importance of spatial factors in determining HAP. In addition, differences between counties with high and low unemployment, education and illiteracy rates affect the turning points of the HAP–income relationship.
Non-parametric regression splines, local averaging kernels, and the parametric model suggest PM concentration follows an N-shaped path as county-level income increases. Employing a specification test recently suggested by Royston and Sauerbrei (Reference Royston and Sauerbrei2007), we find that the parametric specification for SO2 is only adequate if population density enters the model as a quadratic, a finding consonant with the non-parametric results illustrated in figure 2. At low population density levels, increases in density lead to exponential increases in SO2 pollution, but at levels beyond approximately 2,500, the effect of higher density on household SO2 emissions is negligible.
Increases in the average rate of education are associated with a fall in pollution levels when education enters linearly. However, when a quadratic education term is included in the model the fitted curve is U-shaped. At education rates beyond 20 per cent, further increases bring about higher pollution levels. Since approximately 700 counties – one quarter of the data set – have education rates above this level, the turning point is well within the sample.
Although the incidence of pollution across income groups is often overlooked in pollution–income studies, we find that the poorest counties bear a highly disproportionate amount of HAP. Urban counties have high levels of pollution–income inequality, as do the counties located in coastal provinces. Compared to the other pollution indexes, PM concentration is the most skewed towards the poorest counties overall, but also in rural areas and in counties located in landlocked provinces. Pollution–income inequality for SO2 concentration is especially high in the coastal–urban counties. The highest Gini pollution–income coefficient occurs for PM concentration in the southern coastal counties.
As recently argued by Johansson and Kriström (Reference Johansson and Kriström2007), the inverted-U pollution–income pattern results from a particular combination of preference and technology parameters, but there is no ‘exogenous’ guarantee of this relationship. This observation is borne out by our results for the case of household PM pollution.
Our findings have policy implications. Our Gini coefficients indicate the poorest counties contain some of the highest HAP pollution concentrations; at the same time, the complete remediation of China's household solid fuels problem is likely to take decades as households become wealthy enough to afford cleaner energy services, and as new energy infrastructure is constructed. The upward turns in the estimated HAP–income relationship, if they persist over time, suggest the problem may worsen before improving. Cleaner energy measures targeting the worst areas are likely to be most cost-effective with respect to reducing health damages, and associated labor productivity losses, from HAP.



