Implications
Because the European pig producers agreed to omit the practice of surgical castration by 2018, new strategies for reducing the amount of tainted carcasses are required. Using the practical breeding program of a Swiss sire line as a reference, we compare different approaches to reduce the occurrence of boar taint by means of selection. Selection against the chemical compounds of boar taint as measured in liquid fat is compared with selection against boar taint as measured by test individuals in the abattoir. The efficiency of different information sources, including genomic information, is evaluated in terms of genetic gain and breeding costs.
Introduction
Until recently, surgical castration as a reliable means for producing meat free of boar taint has been a common practice in pig production in many European countries. To improve animal welfare (von Borell et al., Reference von Borell, Baumgartner, Giersing, Jäggin, Prunier, Tuyttens and Edwards2009), the European pig industry collectively and voluntarily agreed to discontinue surgical castration of piglets by 2018 (European Commission, 2010). A ban on surgical castration, including that performed using anesthesia or analgesia, will likely be anchored in the legislation of many European countries in the foreseeable future; feasible alternatives are required as soon as possible.
Alternatives to surgical castration have been the topic of intense research in Europe. Three main possibilities exist: (1) sexing semen, which would allow the production of only female animals, totally circumventing the problem of boar taint; (2) immunocastration, involving the immunization of young pigs against gonadotropin-releasing hormone (GnRH) (Prunier et al., Reference Prunier, Bonneau, von Borell, Cinotti, Gunn, Fredriksen, Giersing, Morton, Tuyttens and Velarde2006; Fàbrega et al., Reference Fàbrega, Velarde, Cros, Gispert, Suárez, Tibau and Soler2010; Rydhmer et al., Reference Rydhmer, Lundström and Andersson2010); and (3) raising intact boars. While common in cattle breeding, sexed swine semen is not likely to become available on a commercial scale in the near future because of various technical limitations (Vazquez et al., Reference Vazquez, Parrilla, Roca, Gil, Cuello, Vazquez and Martínez2009). Although registered in most of Europe, immunocastration is not widely used because of image concerns of retailers. Breeding against the main compounds of boar taint (skatole, androstenone and indole) seems promising because of high consumer acceptance, favorable effects on various production traits, high heritabilities and a more efficient food conversion of intact males (Walstra, Reference Walstra1974; Sellier et al., Reference Sellier, Le Roy, Fouilloux, Gruand and Bonneau2000; Windig et al., Reference Windig, Mulder, ten Napel, Knol, Mathur and Crump2012). Before intact males can be produced on a large scale, however, the frequency of tainted carcasses must be reduced and a reliable means of identifying carcasses with organoleptic anomalies must be implemented. Management practices adapted to rearing intact boars (i.e. feeding regimes, housing facilities, etc.) will also be necessary.
Incorporating selection against boar taint into practical breeding programs requires a reliable system for recording the target traits. Those can be either the amount of boar taint compounds, for example, in liquid fat, or the human nose score (HNS) being the intensity of odor as perceived by trained test individuals (Windig et al., Reference Windig, Mulder, ten Napel, Knol, Mathur and Crump2012). Levels of chemical boar taint compounds can be measured either in the abattoir, for example, in siblings of the selection candidate, or by conducting a biopsy-based performance test in live boars, as proposed by Baes et al. (Reference Baes, Mattei, Luther, Ampuero Kragten, Sidler, Bee, Spring and Hofer2013). Assessing the HNS requires a trained panel of testers (Mathur et al., Reference Mathur, ten Napel, Bloemhof, Heres, Knol and Mulder2012).
Accuracy of selection and therefore response to selection may be improved by additionally considering genomic information. The gain in accuracy will depend on whether boar taint compounds or HNS are considered in the breeding goal owing to the considerable differences in heritability (Windig et al., Reference Windig, Mulder, ten Napel, Knol, Mathur and Crump2012). Genomic selection (GS) is defined as the estimation of breeding values based on genome-wide dense marker maps (Meuwissen et al., Reference Meuwissen, Hayes and Goddard2001). The development of a 60 K SNP array for Sus scrofa (Ramos et al., Reference Ramos, RPMA, Affara, Amaral, Archibald, Beever, Bendixen, Churcher, Clark, Dehais, Hansen, Hedegaard, Hu, Kerstens, Law, Megens, Milan, Nonneman, Rohrer, Rothschild, Smith, Schnabel, Van Tassell, Taylor, Wiedmann, Schook and Groenen2009) enables a routine assessment of a large number of markers that, in addition to conventional pedigree-based information, should help to partition the genetic variance observed in the population. Estimation of linkage disequilibrium (LD) carried out by Uimari and Tapio (Reference Uimari and Tapio2011) and Badke et al. (Reference Badke, Bates, Ernst, Schwab and Steibel2012) showed high values of r 2 between adjacent SNPs in pigs; these r 2 values were comparative with those in North American Holstein cattle, indicating that the estimation of accurate genomic breeding values (GBVs) for pigs should be feasible using a 60 K SNP array. Accuracies of GBVs for traits with low heritability (female reproduction traits) were found to be clearly higher than the accuracy of conventional information normally available at the time of selection (Cleveland et al., Reference Cleveland, Forni, Garrick and Deeb2010). Next to LD, the number of animals in the reference population is an important factor determining the accuracy of GBVs. Haberland et al. (Reference Haberland, Pimentel, Ytournel, Erbe and Simianer2013) estimated a lower limit of about 1000 animals to increase genetic gain of a pig breeding program using GS.
The aim of this study was to model a terminal sire line breeding program to assess the potential of selection against boar taint as reflected in different target traits (HNS or chemical compounds) using selection index theory. The Swiss terminal sire line PREMO® was used as an example for comparing different information sources: (i) biopsy-based performance testing (BPT) of live boars; (ii) assessment of HNS on station; and (iii) GS against either chemical compounds or HNS. The economic weights of boar taint components were varied to assess the effects on monetary genetic gain of production traits, and on time needed to reduce boar taint within the examined pig population.
Material and methods
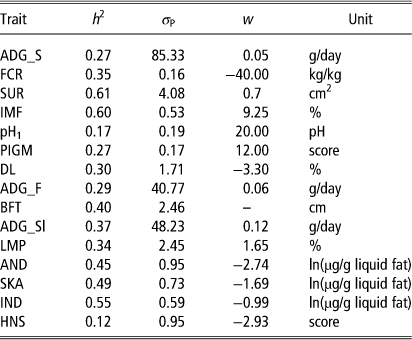
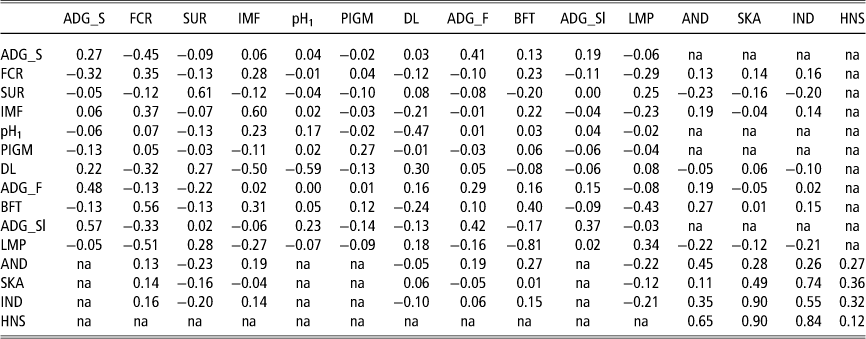
Within the three-way crossbreeding scheme of the Swiss pig production company SUISAG, the terminal sire line PREMO® is mated to F1 crossbreed sows (Swiss Large White×Swiss Landrace). In this study, we focus on the selection scheme of the sire line. Genetically, the breed originates from a Swiss Large White line and has been selected for high fattening performance and meat quality for about 10 years. Because the average androstenone content in PREMO® boars is low compared with other breeds such as Duroc, Landrace or Large White (Grindflek et al., Reference Grindflek, Meuwissen, Aasmundstad, Hamland, Hansen, Nome, Kent, Torjesen and Lien2011; Windig et al., Reference Windig, Mulder, ten Napel, Knol, Mathur and Crump2012; Baes et al., Reference Baes, Mattei, Luther, Ampuero Kragten, Sidler, Bee, Spring and Hofer2013), the use of this terminal sire line in a breeding program should provide a good starting point for reducing the number of carcasses with organoleptic anomalies. Heritabilities, phenotypic standard deviations and economic weights of the breeding goal traits in the current population are given in Table 1; phenotypic and genetic correlations are shown in Table 2.
Heritabilities (h 2), phenotypic standard deviations (σ P) and economic weights (w) per unit of considered traits (SUISAG, 2012)

ADG_S=average daily gain (station test); FCR=feed conversion ratio; SUR=surface; IMF=percentage of intramuscular fat; pH1=acidity 1 h after slaughtering; PIGM=pigmentation; DL=drip loss; ADG_F=average daily gain (field test); BFT=backfat thickness; ADG_Sl=average daily gain (at slaughtering); LMP=lean meat percentage; AND=androstenone; SKA=skatole; IND=indole; HNS=human nose score.
Heritabilities (diagonal), phenotypic (above diagonal) and genotypic (below diagonal) correlations between considered traits (SUISAG, 2012; Frieden (personal communication), 2013; Windig et al., Reference Windig, Mulder, ten Napel, Knol, Mathur and Crump2012)

ADG_S=average daily gain (station test); FCR=feed conversion ratio; SUR=meat surface; IMF=percentage of intramuscular fat; pH1=acidity 1 h after slaughtering; PIGM=pigmentation; DL=drip loss; ADG_F=average daily gain (field test); BFT=backfat thickness, ADG_Sl=average daily gain (at slaughtering); LMP=lean meat percentage; AND=androstenone in liquid fat; SKA=skatole in liquid fat; IND=indole in liquid fat; HNS=human nose score; na=not available.
The breeding program was modeled using ZPlan+ (Täubert et al., Reference Täubert, Reinhardt and Simianer2010). This software combines selection index theory (Hazel, Reference Hazel1943), gene flow method (Elsen and Mocquot, Reference Elsen and Mocquot1974; Hill, Reference Hill1974) and economic modeling, enabling deterministic simulation of livestock breeding programs (Willam et al., Reference Willam, Nitter, Bartenschlager, Karras, Niebel and Graser2008). Breeding schemes can be compared in terms of generation interval, monetary genetic gain, breeding costs, returns and discounted profit. The selection index is implemented in ZPlan+ as described by Hazel (Reference Hazel1943).
In the genomic scenarios, GBVs were integrated into the selection index considering them as auxiliary traits with a heritability of 1, as proposed by Dekkers (Reference Dekkers2007). Phenotypic and genetic correlations between these ‘genomic traits’ and the traits of the breeding goal were calculated in accordance with Dekkers (Reference Dekkers2007). Only our formula to determine the genetic correlation between GBVs of two different traits differs from Dekkers (Reference Dekkers2007) in that it was derived assuming the proportion of genetic variance associated with markers (q 2) not being necessarily identical (Haberland et al., Reference Haberland, Pimentel, Ytournel, Erbe and Simianer2013). We adopted the value of q=0.9 suggested by Erbe et al. (Reference Erbe, Reinhardt and Simianer2011) who used cross-validated data to empirically determine q for genotyped Holstein Friesian bulls. To the best of our knowledge, such empirical data are not yet available for pigs. The accuracy of the GBVs r GBV was calculated using a formula derived by Daetwyler et al. (Reference Daetwyler, Pong-Wong, Villanueva and Woolliams2010):
 $$r_{{{\rm GBV}}} =\sqrt {{{N_{{\rm P}} r^{2} } \over {N_{{\rm P}} r^{2} {\plus}M_{{\rm e}} }}} $$
where N
P is the number of individuals in the reference population. In our calculations, we assumed N
P=1000, which may be assumed a minimum for GS in pigs (Haberland et al., Reference Haberland, Pimentel, Ytournel, Erbe and Simianer2013). For the reliability of the quasi-phenotypes, that is, of the conventional EBVs of the animals in the reference population, we assumed r
2=0.49 for all traits. M
e is the effective number of chromosome segments segregating in the population and can be approximated with
 $$2N_{{\rm e}} Lk/\log (N_{{\rm e}} L)$$
as proposed by Goddard et al. (2011). N
e denotes the effective population size, L is the average length of a chromosome in Morgan and k is the number of chromosome pairs. Assuming N
e=100, k=19 and L=1.2 Morgan (with length of the porcine genome being 23 Morgan, Rohrer et al., 1996), the value of M
e was ∼1000.
The following scenarios were compared in terms of annual genetic gain of log-transformed (ln) boar taint components AND, SKA and IND and in terms of variable breeding costs per selection candidate. To correct for skewness, boar taint phenotypes AND, SKA and IND were log transformed to achieve a normal distribution of the data (Baes et al., Reference Baes, Mattei, Luther, Ampuero Kragten, Sidler, Bee, Spring and Hofer2013). The monetary genetic gain per year was calculated as
 $$\Delta G/a=ir_{{{\rm TI}}} \sigma _{{\rm T}} /\Delta T$$
, where i is the selection intensity, r
TI is the accuracy of the index, σ
T is the standard deviation of the breeding goal and
 $$\Delta T$$
is the generation interval. The expected change in the amount of boar taint prevalence per year was estimated using the average amount of boar taint compounds in the current PREMO® population (0.70, 0.03 and 0.03 µg/g liquid fat for AND, SKA and IND, respectively) as a starting point. The selection was intensified by increasing the economic weighting factors for boar taint compounds in three steps. The scenarios were also assessed with respect to the impact on production traits, provided that the genetic correlation between production traits and boar taint compounds was known. Table 3 shows an overview of the scenarios and the respective information sources.
Breeding goals and information sources of the different scenarios

BPT=biopsy-based performance testing; GS=genomic selection; AND=androstenone; SKA=skatole; IND=indole.
Scenario I, conservative scheme (base scenario)
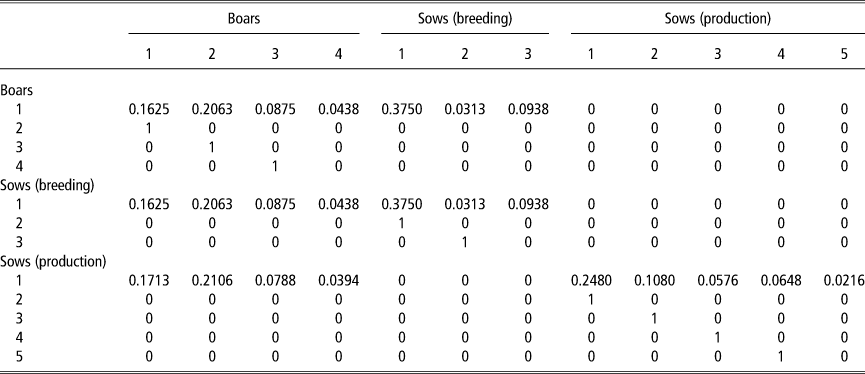
This base scenario models the current breeding program. The breeding nucleus consists of 270 sows with an annual replacement rate of 75%. The breeding sows are mated to 60 AI boars, 35% of which are progeny tested. The rather large number of young boars is maintained to control inbreeding within the small breeding nucleus and to increase genetic gain more rapidly. Genetic gain is transferred to the production units by a larger pool of 150 AI boars, which is assumed to be selected with a lower intensity than the breeding boars, but in which the breeding boars are included. In ZPlan+, we split the breeding sows and breeding boars into two groups according to two selection steps. The first selection step is based on field performance testing of 1200 male and 1200 female selection candidates per year at a live weight of 100 to 130 kg. A total of 200 young breeding sows and 42 young boars are selected according to their own and 60 half sib performances in the traits average daily gain and backfat thickness (measured using ultra sound). In addition, two full sibs and 12 half sibs of every selection candidate are tested on station for average daily gain, feed conversion ratio, intramuscular fat, pH1, pigmentation, drip loss and lean meat percentage. The productive lifetime of the young breeding animals selected in the first selection step is 1 year. Field performance testing was assumed to cost 180 Euro. In the second selection step, 70 sows and 20 boars are selected to be kept for another 2 years according to their progeny records. Progeny testing is carried out by testing six purebred progeny on station, and by recording about 40 crossbred end-products for lean meat percentage and average daily gain. Progeny testing was assumed to cost 1535 Euro. The larger pool of boars used for matings within the production unit is also split into 2 groups, namely, 105 younger and 42 older boars with a productive lifetime of 1 or 2 years, respectively. Hence, including the production unit consisting of 60 000 crossbred sows, there are seven groups involved in the breeding program modeled in ZPlan+. The transmission matrix (gene flow) within the modeled population is shown in Table 4.
Transmission matrix (gene flow) within the modeled pig population

Fixed costs of the breeding program were not accounted for because of the complexity of their determination and because only variable costs have an impact on the efficiency of the breeding strategy. Boar taint compounds were included in scenario I with an economic weighting of zero; this was done to assess the correlated response because of their correlations with production traits.
Scenario II, breeding against boar taint compounds
Log-transformed boar taint compounds AND, SKA and IND were included in the breeding goal. Because no genetic correlation between boar taint compounds and fattening traits were available, these relationships were partly adopted from the German Piétrain Herdbook Organizations (E. Tholen, personal communication). The underlying data set of these parameters comprises information from 1010 station-tested, Piétrain-sired commercial crossbreds (Tholen et al., 2011). AND and IND show favorable genetic correlations to lean meat percentage, meat surface and feed conversion ratio (Table 2). Undesirable correlations exist between AND and average daily gain as well as between intramuscular fat percentage and the boar taint compounds AND and IND.
Three kinds of information sources for the selection index were compared: BPT in live boars (scenario IIa), GS (scenario IIb) or a combination of both (scenario IIc).
-
(IIa) A biopsy was assumed to be taken from the neck region of 1200 live male selection candidates during the field test (Baes et al., Reference Baes, Mattei, Luther, Ampuero Kragten, Sidler, Bee, Spring and Hofer2013). Thus, boar taint compounds could be quantified in addition to the currently measured traits average daily gain and backfat thickness. Each selection candidate had information on boar taint compounds from itself (only if male), its sire and its 30 male half sibs. The regular costs of the field test (180 Euro) and the costs for biopsy and analysis (50 Euro) added up to 230 Euro per animal. Expected long-term change in boar taint prevalence was calculated assuming different economic weighting factors of boar taint compounds. There is no established payment system for carcasses of intact males with respect to boar taint that would allow the derivation of economic weights. Therefore, we arbitrarily have defined relative weights for the three boar taint components with 75% for SKA and IND relative to AND per genetic standard deviation of the trait, and all three components together accounting for 5% of the standard deviation of the overall breeding goal. These assumptions have resulted in economic weights of −2.74, −1.69 and −0.99 Euro per unit of log-transformed AND, SKA and IND. To investigate the effect of higher economic weights of boar taint components on genetic gain, these values were increased in such a way that they represented a proportion of 10%, 20% and 30% of the variance of the overall breeding goal.
-
(IIb) For the genomic scenario, GBVs were assumed to be available for boar taint compounds AND, SKA and IND. The presumed genotyping costs were 150 Euro. Together with the regular field test, costs added up to 330 Euro.
-
(IIc) In a third scheme, conventional information from the biopsy-based field test was combined with the genomic information. Consequently, information sources within the selection index were own and half sib performances from the field test, performance of two full sibs and 12 half sibs tested on station, information on the parent’s performance and on the genomic traits. Costs of genotyping and performance testing added up to 380 Euro per selection candidate.
Scenario III, breeding against HNS
The HNS was included in the breeding goal instead of boar taint compounds. Heritability, repeatability, phenotypic standard deviation, and phenotypic and genetic correlations between boar taint compounds and HNS of AND, SKA and IND were adopted from Windig et al. (Reference Windig, Mulder, ten Napel, Knol, Mathur and Crump2012) and are displayed in Tables 1 and 2. For the derivation of the economic weight of HNS, we first assumed a new trait H as an index of the chemical compounds AND, SKA and IND, each weighted by their respective index weights (b-values according to selection index theory). The phenotypic variance of H was calculated as
 $$\sigma _{{\rm p}}^{2} ={\bf b'Pb}$$
, were b is a vector of the index weights of AND, SKA, IND and HNS (=0) and P is the phenotypic (co)variance matrix of these traits. The phenotypic covariances between H and AND, SKA, IND and HNS, respectively, were calculated as
 $${\bf cov}_{{\bf H}} ={\bf b'P}$$
. Subsequently, the economic weight of trait H was calculated as
 $${\bf w}_{{\bf H}} ={\bf w'cov}_{{\bf H}} /\sigma _{{\rm P}}^{2} $$
, were w is a vector of the economic weights of AND, SKA, IND and HNS (=0). The economic weight of HNS was then calculated by performing a regression of H on HNS and dividing the economic weight of H by the resulting regression coefficient, which resulted in −2.93 Euro per unit of the trait.
A performance test on station (scenario IIIa) was compared with GS (scenario IIIb).
-
(IIIa) Information sources for station testing were chosen in accordance with Windig et al. (Reference Windig, Mulder, ten Napel, Knol, Mathur and Crump2012). Hence, 4 full sibs and 76 half sibs of the selection candidate were slaughtered and tested by one trained test individual. In addition, we assessed the effect of a second test individual. Information on station testing of siblings was assumed to cost 50 Euro per selection candidate.
-
(IIIb) For the genomic strategy, the GBV of the HNS was included in the selection index according to the explanations above.
Results and discussion
Annual genetic gain
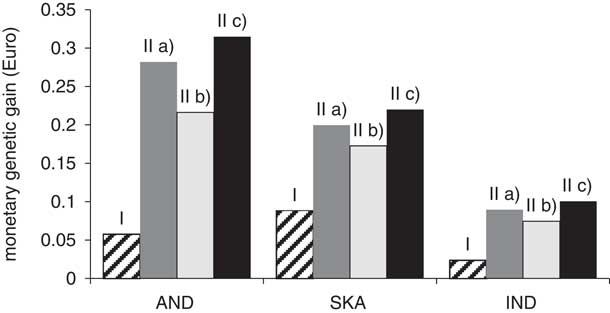
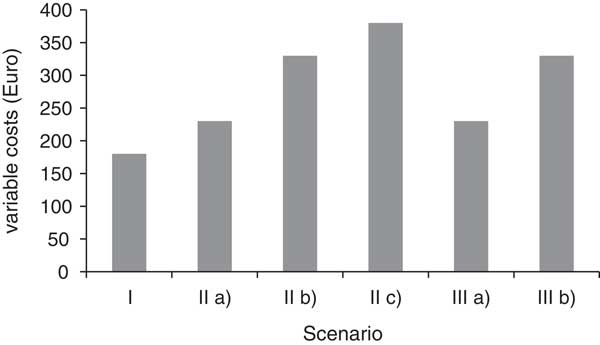
Annual genetic gain in log-transformed AND, SKA and IND achieved in scenarios I and II is depicted in Figure 1. Even for the case where no information on boar taint was included in the index (scenario I), we observed a decrease in boar taint compounds. The genetic gain in log-transformed AND (SKA; IND) was 0.06 (0.09; 0.02) Euro per year. This correlated response is because of the selection on favorably correlated production traits such as lean meat percentage (cp. Table 2). Scenario I only involved the variable costs for regular field testing of 180 Euro per selection candidate (Figure 2).
Annual genetic gain of boar taint compound androstenone (AND), skatole (SKA) and indole (IND) for different information sources: scenario I (hatched); scenario II with biopsy-based performance testing (dark gray); genomic selection (GS, light gray); and a combination of biopsy and genomic selection (black).

Variable costs in Euro for the reference scenario (I), selection against boar taint compounds via biopsy-based performance testing (II a)), genomic selection (II b)) or both (II c)), as well as for the selection against the human nose score via test individuals (III a)) or genomic selection (III b)).

In scenario IIa, with information from BPT, genetic gain in AND (SKA; IND) was 0.28 (0.20; 0.09) Euro per year. The high level of genetic gain is because of heritabilities greater than 0.45 and the availability of a high number of half sib performances in addition to an own performance of the selection candidate. Variable costs per selection candidate of scenario IIa were 230 Euro for the field test and the biopsy. When using genomic selection (scenario IIb), the genetic gain was reduced by 23% (14%; 17%) for AND (SKA; IND) compared with scenario IIa. In contrast, variable costs per selection candidate for GS were 100 Euro higher than for BPT (Figure 2). When combining the information sources BPT and GS (scenario IIc), genetic gain only marginally exceeded the gain achievable from BPT alone, whereas variable costs per selection candidate added up to 380 Euro. Consequently, this economically demanding scheme with small additional gain may not be considered for practical application if only considering its benefits for the selection against boar taint compounds. However, the potential of GS with regard to production traits was found to be higher for the same population of pigs (Haberland et al., Reference Haberland, Ytournel, Luther and Simianer2010). If assuming the introduction of GS for selection on production traits, the variable costs per selection candidate could be partly refunded by additional profit in the production traits. In this case, the consideration of genomic information on boar taint compounds in addition to BPT could be worthwhile. Nevertheless, the build-up of a reference population with N P >500 is challenging for regional lines such as PREMO®. One possibility to increase N P would be a joint analysis of genetically close lines within a larger reference population. Investigations of Badke et al. (Reference Badke, Bates, Ernst, Schwab and Steibel2012) showed high prediction accuracies across breeds (Landrace and Yorkshire) if markers were not spaced more than 100 kb apart. For the PREMO® population originating from a Large White line, an even closer relationship with other Large White populations can be expected. Own calculations of the genetic differentiation (Wright, Reference Wright1951) between the PREMO® population and a German Large White line resulted in F ST being in a range with populations that were selected separately for about 50 years. An even more promising approach would be using progeny-tested sows of the same population for increasing N P. The common genetic background ensures high accuracies of the predicted GBVs. Nevertheless, breeding values for progeny-tested boars and sows will likely differ in accuracy. These differences have to be accounted for by approaches, for example, as proposed by Garrick et al. (Reference Garrick, Taylor and Fernando2009), in which the residual term of the mixed model is weighted according to the difference in variance.
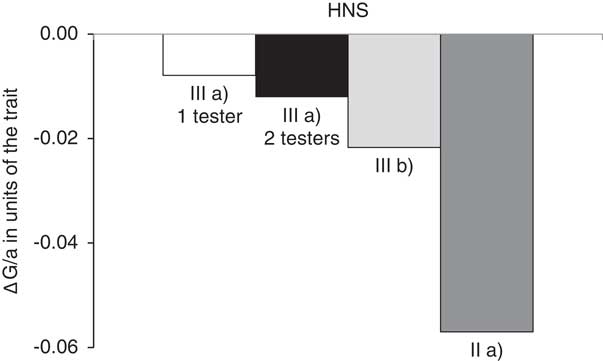
GS is considered to be mainly beneficial if selecting for traits with a low heritability and those that cannot be measured in the animal itself (Goddard and Hayes, Reference Goddard and Hayes2007). As HNS is a carcass trait, which can only be measured in sibs of the selection candidate, we expected a high potential for GS in scenario III. The annual genetic gain in units of the trait for scenario III is depicted in Figure 3. In comparison with station testing of 4 full and 76 half sibs with one or two measurements, annual genetic gain could be increased by factor 2.8 or 1.8, respectively, when using genomic information on the selection candidate. However, the variable costs of station testing are considerably lower than the costs of GS (Figure 2). We also assessed the correlated response of HNS when using scenario IIa, that is, when selecting against the chemical compounds of boar taint via BPT. Because of the high genetic correlations between boar taint compounds and HNS (cp. Table 2), the (correlated) response in HNS could be further increased by factor 2.6 compared with scenario IIIb (Figure 3). Thus, the best strategy for reducing the HNS was breeding against chemical compounds (scenario IIa).
Annual genetic gain (ΔG/a) in units of the trait for the human nose score (HNS) for different information sources: station testing of siblings with one test individual (white); station testing of siblings with two measurements (black); genomic selection (light gray); biopsy-based performance testing for boar taint compounds (correlated response, dark gray).

Expected change in average amount of boar taint
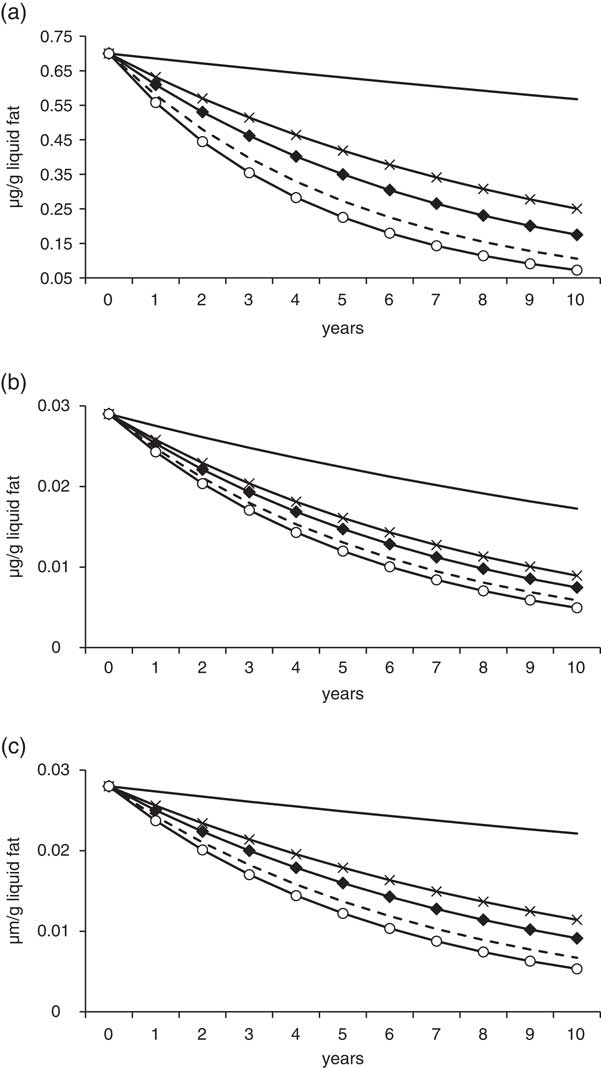
The average amounts of chemical compounds AND, SKA and IND in the current PREMO® population were 0.70, 0.03 and 0.03 µg/g liquid fat, respectively. Starting with these values, we calculated the expected change in the actual amount of untransformed AND, SKA and IND for a period of 10 years (Figure 4). In scenario I, the amount of AND (SKA; IND) decreased by 19% (41%; 21%) within 10 years, because of favorable correlations to lean meat percentage and meat surface.
Expected changes in the prevalence of boar taint compounds androstenone (a), skatole (b) and indole (c) as a function of economic weighting: scenario I (solid line); scenario II and biopsy-based performance testing with weighting of −2.74, −1.69 or −0.99 (crosses); economic weighting increased up to a proportion of 10% (diamonds); 20% (dashed line); 30% (circles) of the variance of the overall breeding goal.

Because genetic gain was found to be greatest for scenario IIa, the calculation of the following trends was only performed for this scenario. The amount of AND could be reduced by 50% within 7 years if assuming an economic weight of −2.74 Euro per unit of the trait (Figure 4a). Desmoulin and Bonneau (Reference Desmoulin and Bonneau1982) proposed a threshold of 0.5 µg AND/g liquid fat, below which consumers found no more difference between boar meat and meat from gilts or castrates. The average amount of AND in the PREMO® population could be reduced to this threshold within 4 years, which is in accordance with Merks et al. (2009) and Windig et al. (Reference Windig, Mulder, ten Napel, Knol, Mathur and Crump2012). If selecting more intensively, that is, increasing the economic weight up to a proportion of 10% or 20% of the variance of the overall breeding goal, this threshold could be reached even within 2 or 3 years. The average amount of SKA in the PREMO® population is currently 0.029 µg/g liquid fat, which is already very close to the threshold of 0.026 µg/g liquid fat proposed by Annor-Frempong et al. (Reference Annor-Frempong, Nute, Whittington and Wood1997). Assuming an economic weight of −1.69 Euro per unit of the trait, the amount of SKA could be reduced by 50% within 6 years (Figure 4b). A further increase in economic weighting only had marginal effects. The amount of IND could be reduced by 50% within 8 years with the original economic weighting of −0.99 Euro per unit of the trait (Figure 4c). If economic weighting was increased up to a proportion of 10% or 20% of the variance of the overall breeding goal, the amount of IND could be halved within 6 or 4 years. For all three chemical compounds, a further increase in economic weights only provided marginal improvements but amplified negative effects, which will be discussed in the following sections.
Correlated effects on other traits
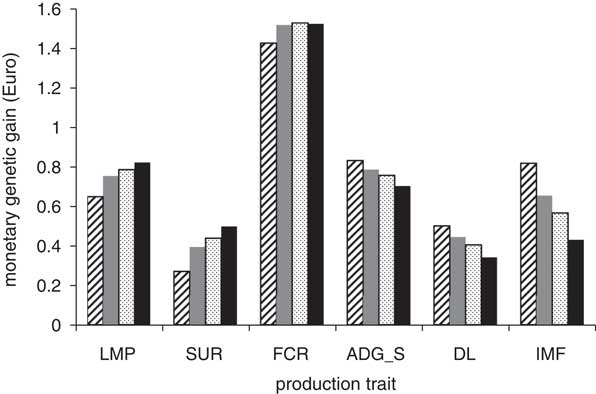
Figure 5 depicts the annual monetary genetic gain in the production traits for scenario I and scenario IIa. Some breeding goal traits were left out of the comparison because information on their genetic correlation with boar taint compounds was not available (Table 2). Scenario III had to be left out for the same reason. The initial economic weights for AND, SKA and IND of −2.74, −1.69 and −0.99 Euro per unit of the trait, respectively, were increased up to a proportion of 10% and 20% of the variance of the overall breeding goal within this comparison. Selection against boar taint entailed positive effects on lean meat percentage, meat surface and feed conversion ratio because of favorable genetic correlations (cp. Table 2). For example, when conducting scenario IIa with economic weights of −2.74, −1.69 and −0.99 Euro per unit of the trait for AND, SKA and IND, respectively, annual genetic gains in these traits increased by 0.10 Euro, 0.12 Euro and 0.09 Euro, respectively, in comparison with scenario I (Figure 5). Negative effects were found for average daily gain (station test), drip loss and intramuscular fat percentage. When conducting scenario IIa with the initial economic weights, monetary genetic gain in these traits changed by −0.05 Euro, 0.06 Euro and −0.16 Euro, respectively, in comparison with scenario I. The negative effects on these traits increased when the economic weighting of boar taint compounds increased (Figure 5). A negative trend for growth rate in a Large White line selected for low AND was also reported by Sellier and Bonneau (Reference Sellier and Bonneau1988) and Sellier et al. (Reference Sellier, Le Roy, Fouilloux, Gruand and Bonneau2000), but is in contrast to the findings of Windig et al. (Reference Windig, Mulder, ten Napel, Knol, Mathur and Crump2012). The different information sources within scenario II had no noticeable impact on annual monetary genetic gain in the production traits (results not shown).
Annual monetary genetic gain in the production traits lean meat percentage (LMP), surface (SUR), feed conversion ratio (FCR), average daily gain measured on station (ADG_S), drip loss (DL) and percentage of intramuscular fat (IMF) for the reference scenario (hatched) and scenario IIa with economic weights of −2.74, −1.69 or −0.99 Euro per unit of log-transformed androstenone, skatole and indole, respectively (dark gray) and for economic weights increased up to a proportion of 10% (light gray); and 20% (black) of the variance of the overall breeding goal.

Strong genetic correlations between AND and other sex steroids, like for example, testosterone have been reported by, for example, Willeke et al. (1987) and Grindflek et al. (Reference Grindflek, Meuwissen, Aasmundstad, Hamland, Hansen, Nome, Kent, Torjesen and Lien2011). Moreover, the level of AND has been found to be strongly correlated with testes size (Sellier and Bonneau, Reference Sellier and Bonneau1988) and size of the bulbo-urethral gland (Sellier et al., Reference Sellier, Le Roy, Fouilloux, Gruand and Bonneau2000). Therefore, selection against AND may entail problems such as delayed sexual maturity in males as reported in females (Willeke et al., 1987; Sellier and Bonneau, Reference Sellier and Bonneau1988). One possibility to prevent the negative effects on other sex hormones would be assessing single genes rather than conventional selection without molecular information. A genome-wide association study by Grindflek et al. (Reference Grindflek, Meuwissen, Aasmundstad, Hamland, Hansen, Nome, Kent, Torjesen and Lien2011) showed breed-specific QTL associated with SKA, but most QTLs affecting AND also showed associations with other sex steroids. Contrary to these findings, Sellier and Bonneau (Reference Sellier and Bonneau1988), Bergsma et al. (Reference Bergsma, Knol and Feitsma2007) and Merks et al. (Reference Merks, Bloemhof, Mathur and Knol2010) found no or even positive effects of selection against boar taint compounds on male fertility traits. The relationship between boar taint and fertility is not yet conclusive and requires further investigation. Nevertheless, our results show that breeding against chemical compounds measured by BPT is an effective and powerful way to reduce the occurrence of boar taint in finishing pigs.
Conclusions
On the basis of our results, breeding against boar taint by conducting BPT is an effective method for optimizing both the selection against the chemical compounds AND, SKA and IND (scenario II), as well as the selection against HNS of boar taint (scenario III) in terms of genetic gain per year and variable costs per selection candidate. By using economic weights of −2.74, −1.69 and −0.99 Euro per unit of log-transformed AND, SKA and IND, the average amount in the PREMO® population could be reduced by 50% within 7, 6 or 8 years, respectively; an average amount of 0.5 µg AND/g liquid fat could be reached within 4 years. Despite these advantages, the introduction of boar taint as a selection trait should be undertaken with caution owing to possible negative effects on average daily gain, drip loss and intramuscular fat percentage, as well as possible negative effects on fertility traits.
Acknowledgments
The authors thank the European Union and the federal state of North Rhine-Westphalia for the financial support within the project pigGS (005-NA02-018 C). Financial support of the Swiss Commission for Innovation and Technology is also gratefully acknowledged.