Introduction
The use of metal nanoparticles (NPs) for conducting electricity in electronic devices such as touch screens and solar panels was initiated decades ago [Reference Karthik and Singh1]. Most common are silver (Ag), copper (Cu), and gold (Au) metals [Reference Karthik and Singh2]. Ag is the top choice because it is nontoxic, has a high electrical and thermal conductivity, and is relatively stable in the presence of oxygen although the high price of Ag is a handicap [Reference Paszkiewicz, Gołąbiewska, Rajski, Kowal, Sajdak and Zaleska-Medynska3, Reference Lee, Kim, Koo, Lee and Lee4]. Therefore, many recent studies have focused on replacing Ag NPs with alternative metals, such as Cu [Reference Gao, Zhang, Jiu, Nagao, Sugahara and Suganuma5], nickel (Ni) [Reference Carenco, Boissiere, Nicole, Sanchez, Le Floch and Mézailles6], and tin (Sn) [Reference Jo, Jung, Choi, Kim and Lee7].
Cu has received the most attention because of its low cost and relatively high conductivity. Since Cu is easily oxidized in ambient atmosphere, various attempts have been made to stabilize Cu NPs. Coating of Cu NPs with a relatively inert material is an effective way [Reference Chen, Mochizuki, Maitani and Wada8]. Diverse materials such as surfactant, metal oxide, polymer, and carbon have been introduced to serve as an oxygen barrier [Reference Butovsky, Perelshtein and Gedanken9]. These nonmetallic coverings often have low electric conductivity, which hinders the application of the NPs in printed electronics. Conductive metals could be used. The disadvantages are that separate procedures are required to synthesize the core and shell, and that the over-growth is hard to control [Reference Choi, Lee and Piao10]. An alternative is Cu-based bimetallic NPs that are less susceptible to oxidation [Reference Wu, Lei, Yang, Zhou, Liu, Xiao, Jiang and Roy11]. Compared to monometallic NPs, bimetallic NPs have shown better optical, electronic, and catalytic properties, which can be attributed to ensemble and electronic effects [Reference Rout, Kumar, Dhaka and Dash12]. Among the candidates, Ag is probably the best material to protect Cu from oxidation because its conductivity is as high as Cu.
Although there are many studies on the preparation of various bimetallic NPs such as Au–Cu, Fe–Cu, Fe–Pt, and Cu–Sn, etc., those on Cu/Ag have been limited [Reference Sun, Murray, Weller, Folks and Moser13, Reference He, Protesescu, Caputo, Krumeich and Kovalenko14, Reference Wang, Zhao and Zhao15, Reference Kim, Resasco, Yu, Asiri and Yang16]. Wet-chemical reduction and microwave methods have been reported for the synthesis of Cu–Ag alloyed NPs [Reference Chowdhury, Bhethanabotla and Sen17, Reference Huang, Li, Zhou, Zhong, Duan and Huang18]. The particles generated tend to be polydisperse and the two metals within a NP are unevenly distributed. This might be due to the fact that the lattice constants of Cu (0.361 nm) and Ag (0.408) are sufficiently different and indeed they exhibit limited solubility in bulk phase (see their phase diagram (Fig. S1) in Supplementary material). Because of the “size-dependent” and “small size” properties of NPs, a simple and economical path for the preparation of monodisperse metal NPs especially metal alloy NPs would be highly beneficial.
It is well-known that Ag has a great tendency of electromigration. This compromises the reliability of conductive circuits as voids are formed from the momentum transfer from electrons to the atoms made up of the conductive material [Reference Li, Lu, Chou and Liu19]. In comparison, Cu is more robust against electromigration failure because it has a higher melting temperature [Reference Hau-Riege20, Reference Vogel21]. This is equivalent to a stronger Cu–Cu chemical bond and in consequence higher energy barriers for diffusion and electromigration when Ag and Cu are at the same temperature [Reference Hau-Riege20, Reference Vogel21]. Previous work on core–shell bimetallic NPs has demonstrated that such alloys can help ameliorate electromigration [Reference Li, Lu, Chou and Liu19, Reference Bhagat, Theodore, Chenna and Alford22] but none is available for alloy NPs.
In this paper, nearly monodisperse Ag–Cu alloy NPs are synthesized in one pot by a thermal decomposition method [Reference Dou and Ng23, Reference Dou, Wong, Li and Ng24]. Strong reducing agents, such as hydrazine [Reference Wu and Chen25], sodium borohydride [Reference Qiu, Dong and Chen26], and sodium hypophosphite [Reference Zhu, Zhang and Yin27], were often used to synthesize Cu NPs. In this paper, we will demonstrate that a mild, nontoxic, and cheaper reductant, i.e., 1-octadecanol (ODL), is also capable of producing Ag–Cu alloy NPs. Formation of alloy structure was confirmed by elemental distribution within the NPs using high-resolution transmission electron microscopy (HRTEM) and energy-dispersive X-ray spectrometer (EDS). Moreover, the as-synthesized Ag–Cu alloy was proved to be a win–win strategy because Ag effectively prevents the oxidation of Cu while Cu minimizes electromigration.
Results and discussions
A one-pot thermal decomposition method was used to synthesize the nearly monodisperse AgCu alloy NPs under a nitrogen atmosphere. Silver acetate (AgCH3COO) and copper acetate (Cu(CH3COO)2·H2O) were used as Ag and Cu precursors, respectively. Low-cost ODL was used as a reducing agent, oleic acid and oleylamine as surfactant, and 1-octadecene as solvent. The molar ratio between the two precursors for Ag (silver acetate) and Cu (copper acetate) was set at five different values (namely, 9:1, 7:3, 5:5, 3:7, and 1:9) while keeping the total metal salt concentration constant. The synthesized NPs were labeled accordingly. The key feature of our method was the co-reduction of Ag and Cu precursors, forming the monodisperse Ag–Cu alloy NP (to ensure the coexistence of Ag and Cu in each NP). To confirm the composition, various characterization techniques, such as X-ray diffraction (XRD), X-ray photoelectron spectroscopy (XPS), inductively coupled plasma optical emission spectroscopy (ICP-OES), and HRTEM with EDS mapping, were carried out as discussed below.
Characterization of AgCu alloys
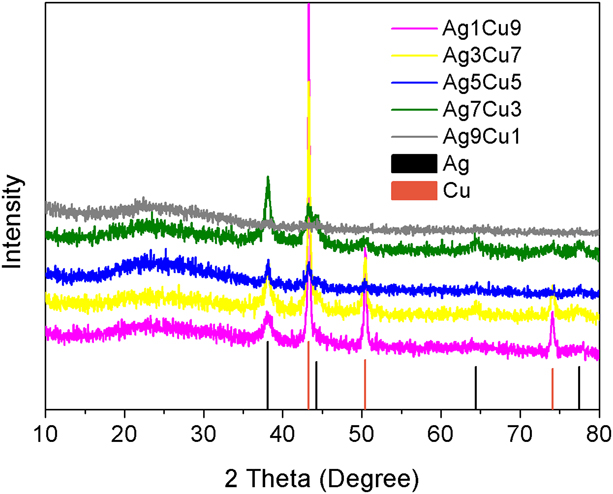
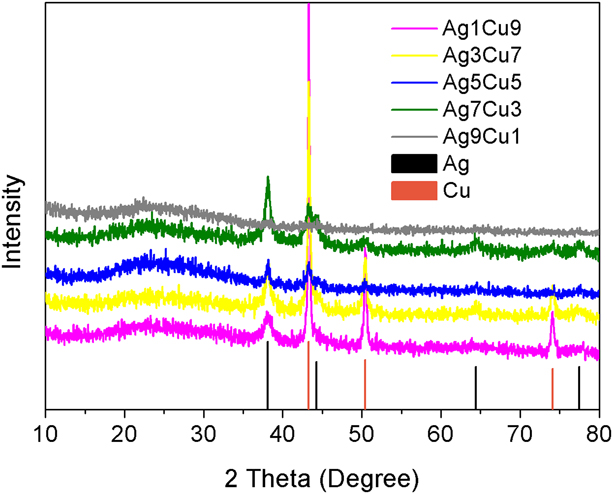
The crystalline structure of the fully dried powder of the NP products was investigated by XRD (Fig. 1). The peak positions of (111), (200), (220), and (311) of Ag are located at 38.2°, 44.3°, 64.5°, and 77.4°. The (111) at 43.4°, (200) at 50.5°, and (220) at 74.2° are from Cu. The diffraction peaks of Ag and Cu existed in all samples, indicating that our samples were composed of both Cu and Ag phases. It is important to note that the typical oxide peaks at 61.7° due to CuO and 37.5° due to Cu2O phase were both absent in the bimetallic spectra, demonstrating the formation of oxide-free Ag–Cu bimetallic NPs. There was a significant decrease in the intensity of Cu peaks as the amount of copper acetate decreased (from the highest to the lowest line).
XRD diffraction patterns of Ag–Cu alloys.
The composition of the synthesized Ag–Cu alloys was analyzed by ICP-OES and the ratios between Ag and Cu were listed in Table I.
Ag and Cu ratios in precursors and alloys.

The ratios between Ag and Cu in the as-synthesized AgCu nanocrystals were consistent with the initial Ag/Cu ratios.
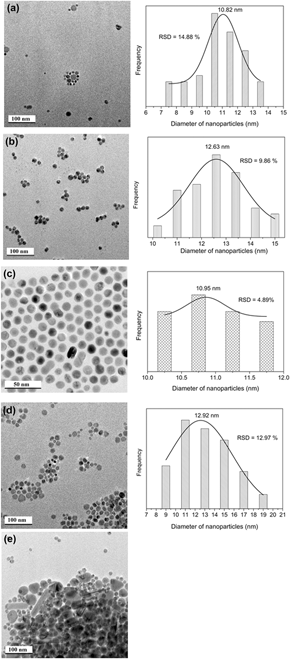
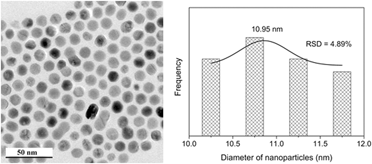
The morphologies of Ag–Cu alloy NPs with different compositions are shown in Fig. 2. All the samples except Ag1Cu9 (as discussed below) were in pseudospherical shape. Compared to pure Ag in Fig. S2, we can clearly see that the addition of Cu increased the relative size distribution (RSD) of the synthesized NPs slightly at first (Ag9Cu1, RSD = 14.88%). Further increasing the amount of Cu resulted in a decreased RSD until the ratio between Ag and Cu was 1:1 (Ag7Cu3, RSD = 9.86%; Ag5Cu5, RSD = 4.89%). After that, in sample Ag3Cu7, the RSD increased again (RSD = 12.97%). When the amount of Cu was 9 times of Ag, Ag and Cu NPs in separated phase were detected [Fig. 2(e)]. Larger Cu NPs and nanorods were mixed with spherical shaped Ag NPs. Ag5Cu5 NPs showed the best morphology and monodispersity among all these samples [Fig. 2(c)]. It should also be noted that, compared to pure Ag or Cu (Figs. S2 and S3), the uniformity of sample Ag5Cu5 was much better. The calculated average size of the bimetallic particles was between that of pure Ag and Cu for all the NPs except sample Ag1Cu9. The distribution of Ag and Cu elements among the particles was in nanoscale.
TEM images of (a) Ag9Cu1; (b) Ag7Cu3; (c) Ag5Cu5; (d) Ag3Cu7; and (e) Ag1Cu9. The right column is the RSD histograms.

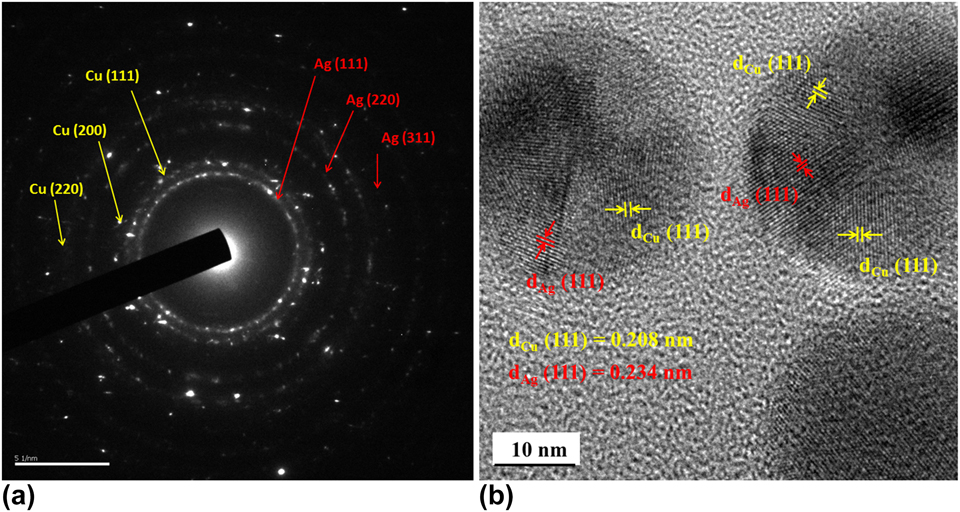
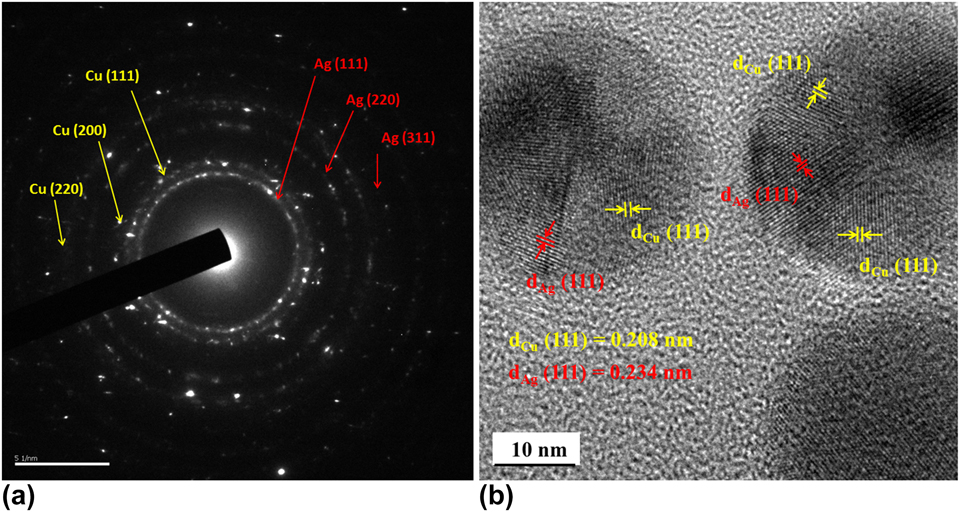
The crystalline nature of Ag5Cu5 was confirmed by selected area electron diffraction pattern (SAED) analysis (Fig. 3). The (111), (200), and (311) rings were indexed to the face centered cubic (fcc) structure of Ag, and the (111), (200), and (220) rings were attributed to the fcc structure of Cu. These patterns indicated that the NP was polycrystalline. For further demonstration of the alloy nanostructure, HRTEM was carried out. The HRTEM image of the Ag5Cu5 NP is shown in Fig. 3(b). The crystal lattice of the selected NP and the regions of different chemical compositions can be clearly seen. The regions were separated by phase boundaries (twin crystal boundary). The lattice distance of 0.208 nm corresponded to (111) plane of Cu while the distance of 0.234 nm was the (111) plane of Ag. Formation of twin crystal boundary could possibly be due to the huge Ag/Cu lattice mismatch and distinct atomic radius as we stated before [Reference Sopousek, Krystofova, Premovic, Zobac, Polsterova, Broz and Bursik28, Reference Weng, Hsu, Lee, Fan and Liao29], or the annealing and fast cooling from high temperature [Reference Qu, Zhang, Wu, Zang and Zhang30]. These results confirmed that the particles were composed of Ag and Cu with good crystallinity. Also, Ag and Cu in the Ag–Cu alloy distributed evenly.
(a) SAED pattern and (b) HRTEM image of Ag5Cu5 alloy NPs.
The HRTEM image of sample Ag7Cu3 is shown in Fig. S4. Two groups of lattice fringes were readily resolved, the lattice distances were 0.234 and 0.204 nm, which could be indexed to the (111) and (200) crystal planes of Ag, respectively. Moreover, a clear lattice distance of 0.208 nm could be indexed to the (111) plane of Cu. HRTEM results revealed that the particles of sample Ag7Cu3 were composed of Ag and Cu and both had good crystallinity. Indeed, the interface boundaries between Cu and Ag were readily resolved.
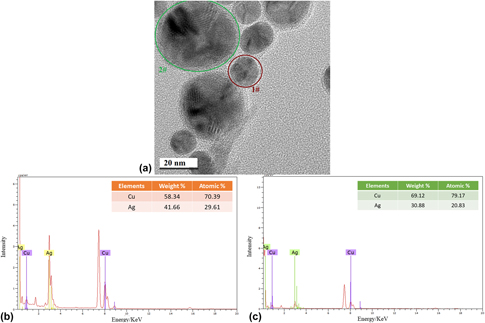
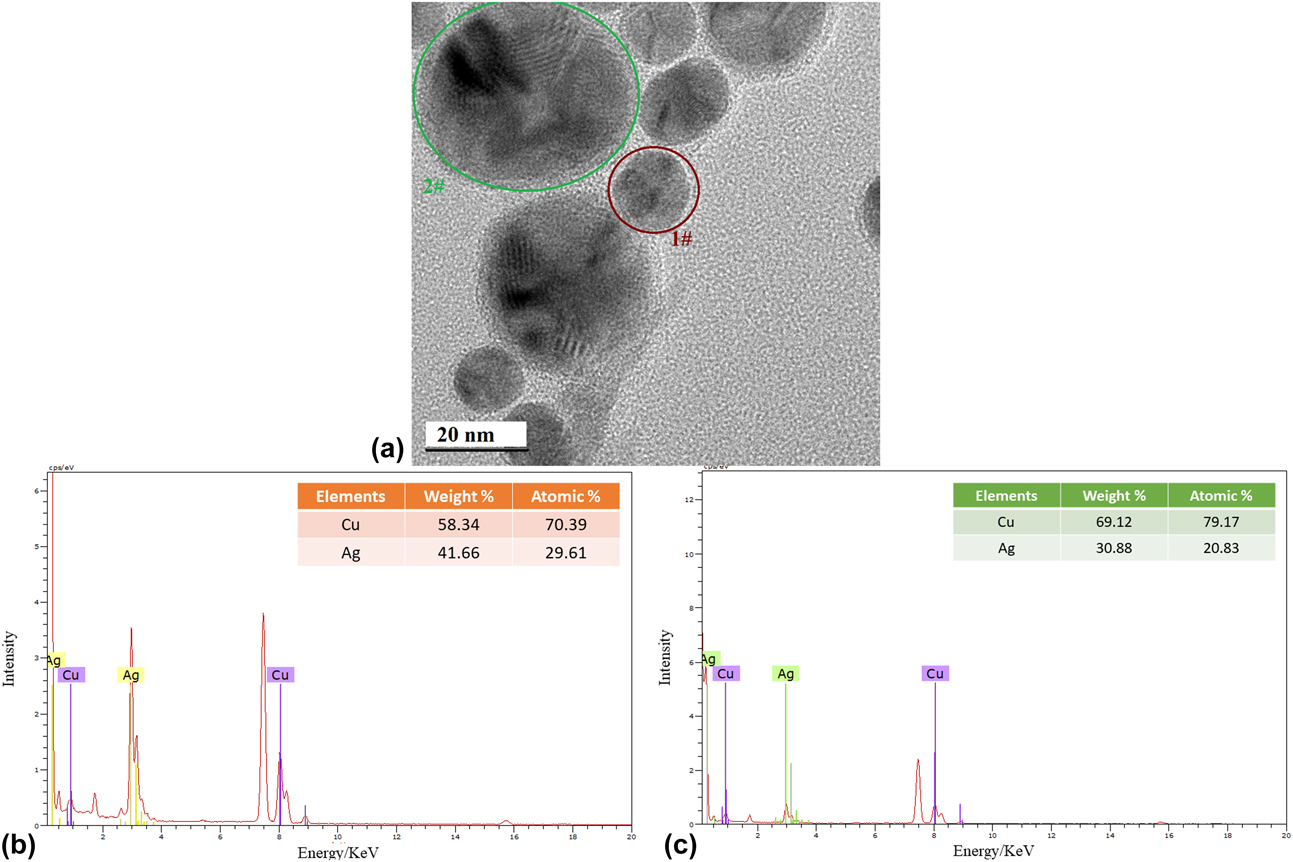
In sample Ag9Cu1 and Ag3Cu7, some particles with an obviously larger size were found. To determine the chemical composition of single particles, EDS with a beam diameter of 2.4 nm was applied. Figure 4(a) shows the HRTEM image of the area analyzed in sample Ag3Cu7. Figure 4(b) reveals the EDS spectrum of particle 1# with a size of about 13 nm, indicating the presence of Cu and Ag elements with an approximate atomic ratio of 7:3, which was consistent with the initial atomic ratio of copper acetate and silver acetate precursors. The EDS spectrum of particle 2# in Fig. 4(c) demonstrated that the particle with a larger size of about 22 nm also contained Ag and Cu but with a larger amount of Cu (atomic ratio between Ag and Cu was about 8:2). This means that, in sample Ag3Cu7, the particles were in a mixed phase of Ag and Cu. But the two elements were unevenly distributed among the particles, resulting in the polydispersity of NPs.
(a) HRTEM image of sample Ag3Cu7; TEM-EDS spectrum of (b) particle 1# and (c) particle 2#.
A similar morphology was observed for Ag9Cu1 NPs. Figure S5(a) shows a representative HRTEM image. The larger particle with a size of about 15 nm demonstrated two groups of fringe spacing which were measured to be 0.207 and 0.235 nm, and the planes were indexed to the (111) planes of Cu and (111) planes of Ag, respectively. The EDS spectrum on this particle revealed the existence of Cu and Ag elements [Fig. S5(b)]. The atomic concentration of Cu and Ag was 68.64 and 31.59%. This ratio was inconsistent with that used for the precursors. More Cu elements were detected in this larger particle. This result agreed well with sample Ag3Cu7 that nonuniform particles resulted from the unevenly distributed Ag and Cu elements. The particles with a larger size commonly contain more Cu elements.
According to the Ag–Cu phase diagram (Fig. S1) [Reference Zhong, Peabody, Blankenhorn, Glicksman and Ehrman31], bulk Ag and bulk Cu have melting points at 961.93 and 1084.87 °C, and Ag and Cu are nearly immiscible below their eutectic temperature of 779 °C. This was confirmed by our XRD results in which the diffraction peaks of Ag and Cu were detected. However, in the nanoscale microstructure, our formed Ag and Cu were in alloyed or patchy phase in one single particle as indicated by TEM images. Only when the amount of Cu was too large (Ag1Cu9), did the Cu and Ag elements distribute separately. That indicated AgCu alloy was formed in nanoscale through our thermal decomposition process. A possible reason is that the energy barrier that is required for the hybrid of nucleus in nanoscale is much lower than that needed for the blending of bulk metals [Reference Park, Joo, Kwon, Jang and Hyeon32, Reference Embden van, Chesman and Jasieniak33].
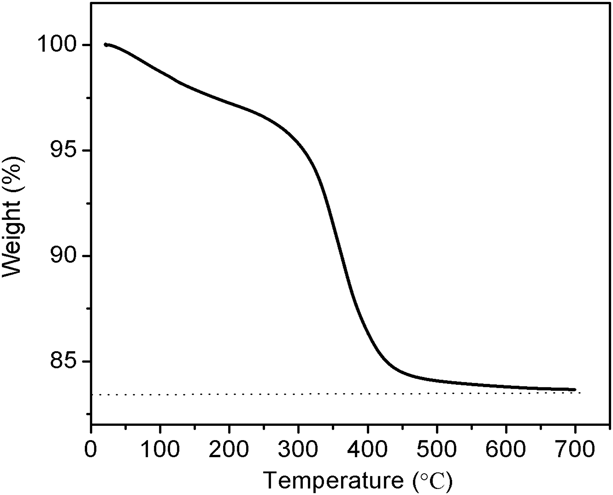
Thermogravimetric analysis (TGA) was used to study the surface of the synthesized NPs. As shown in Fig. 5, 83.67% of sample Ag5Cu5 was left after heating to 700 °C under air atmosphere, indicating that some organics (16.33%) were attached to the surface of the AgCu NPs. These organics might help stabilize the NPs and accounted for the monodispersity and good dispersion of AgCu NPs in nonpolar solvents.
TGA curve of as-synthesized Ag5Cu5 NPs at air atmosphere.

ODL
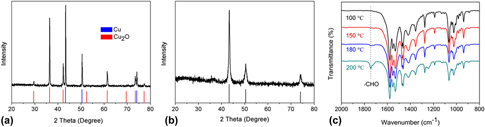
Hydrazine hydrate, a strong reducing agent commonly used in the production of metals, is highly hazardous. Polyols can self-condense to give aldehydes, which can reduce metal ions [Reference Fievet, Lagier and Figlarz34]. Thus, polyols are usually used in organic phase synthesis. Yet its high price hinders the application in large-scale production. Here, we considered using a milder agent, ODL, which is much cheaper than polyols. To eliminate the influence of Ag and other surfactants, we mixed copper acetate with ODL and decomposed the mixture at 200 °C. The products were analyzed by XRD. Copper acetate was also decomposed as a control example. From the XRD results in Figs. 6(a) and 6(b), we can clearly see that the addition of ODL stabilized Cu because when nothing was added, part of Cu was oxidized to Cu2O [Fig. 6(a)].
XRD patterns of the decomposition products from (a) copper acetate and (b) copper acetate with ODL; (c) temporal evolution of FT-IR spectrum recorded from the reaction for copper acetylactonate with ODL.
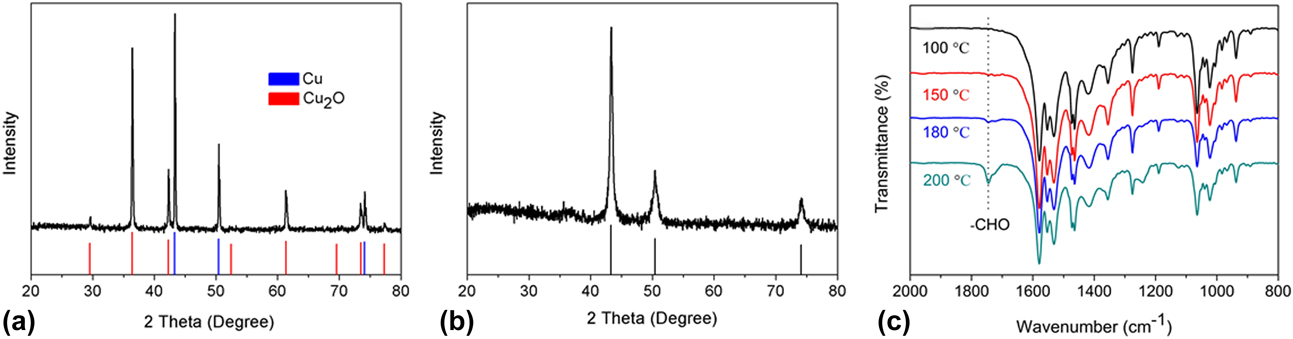
Fourier transform infrared spectrometer (FT-IR) was performed on aliquots withdrawn from the reaction flask to investigate the reaction mechanism. Because ester would form between metal acetate and alcohols or polyols and the peak of ester is near aldehyde in the wavenumber from 1700 to 1800 cm−1, we changed the precursors to copper acetylactonate. Copper acetylactonate was mixed with ODL and the mixture was heated. FT-IR on the aliquots is plotted in Fig. 6(c). Aldehyde was formed in the reaction system and ODL used the aldehyde to reduce metal acetate or metal oxide. ODL is a good choice for our process from both the chemistry and economic points of view.
Oxidation-prevention by Ag
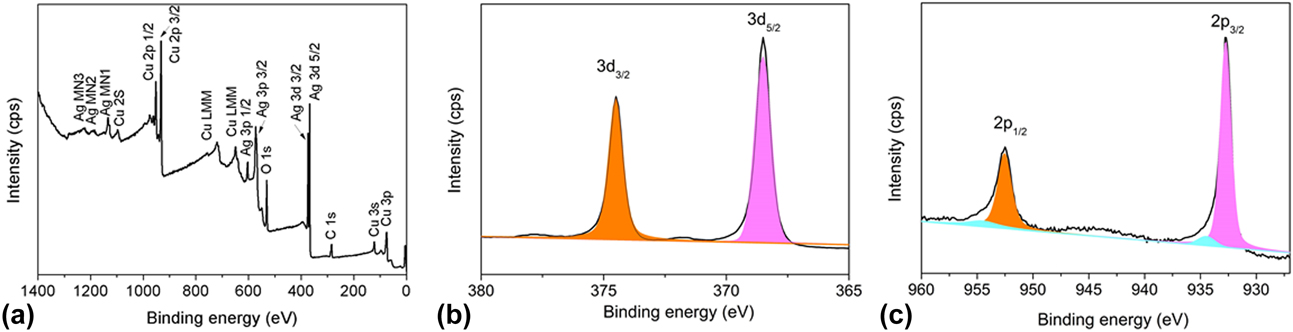
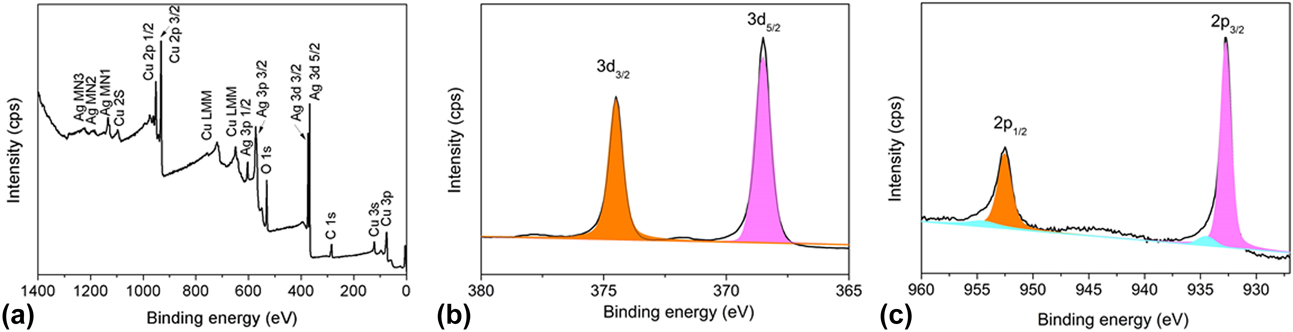
XPS measurements were performed to determine the oxidation state of AgCu NPs. A survey scan on Ag5Cu5, as shown in Fig. 7(a), revealed the presence of elemental Ag, Cu, and O in the sample. The spectra of Ag 3d and Cu 2p are shown in Figs. 7(b) and 7(c), respectively. The binding energy values of the Ag 3d 5/2 and Ag 3d 3/2 appeared at 368.5 and 374.5 eV, respectively, which were associated with pure Ag NPs. In the Cu 2p spectrum, we observed two strong peaks at 932.8 and 952.5 eV, which were associated with Cu 2p 3/2 and Cu 2p 2/1, respectively. These values are found to be consistent with those reported for Cu(0) [Reference Lahtonen, Hirsimäki, Lampimäki and Valden35]. The presence of a small amount of Cu(II) could be found at peaks 934.4 eV and 954.5 eV, and a satellite peak at 943.7 eV. XPS analysis demonstrated the presence of Cu2+ ions while XRD did not show any evidence of copper oxide phase. This suggested that oxide was present only on the surface and the addition of Ag protected Cu from oxidation. In addition, compared with pure Cu (932.4 eV) and Ag (368.3 eV), a peak shift was observed for bimetallic NPs. The peak shift can be attributed to the synergistic electronic effect between Cu and Ag, suggesting the formation of alloy [Reference Abrikosov, Olovsson and Johansson36].
XPS survey spectra of (a) Ag5Cu5 bimetallic NPs; (b) Ag 3d spectra; and (c) Cu 2p spectra of Ag5Cu5 NPs.
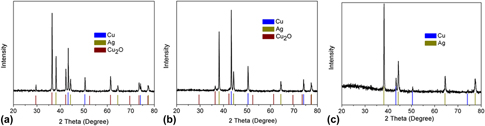
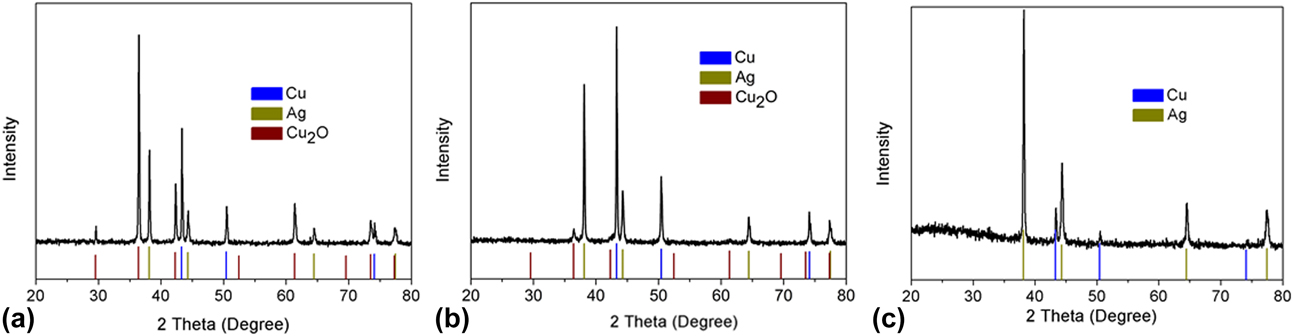
In order to further study the role of Ag in alloy, we mixed copper acetate and silver acetate in different ratios. In the experiment, three molar ratios were used, i.e., 0.9 mmol copper acetate with 0.1 mmol silver acetate, 0.7 mmol copper acetate with 0.3 mmol silver acetate, and 0.5 mmol with 0.5 mmol silver acetate. These mixtures were dissolved in 5 mL ODL and decomposed at 200 °C. The XRD of the product in Fig. 8 shows that when the molar ratio of Ag and Cu was 1:1, only Ag and Cu existed, having no peaks of Cu2O or CuO. For the other two ratios, part of Cu was oxidized to Cu2O. That means Ag could effectively prevent the oxidation of Cu when the amount of Ag was larger than Cu.
XRD patterns of the product from the decomposition of copper acetate and silver acetate in the molar ratios of (a) 9:1, (b) 7:3, and (c) 5:5.
For comparison, Ag and Cu NPs were synthesized and simply mixed in a molar ratio of 1:1. The peaks of copper oxide were detected by XRD for AgCu mixture after storage for about 1 month. Our sample Ag5Cu5 alloy still showed only Ag and Cu phase, which confirmed the stability of the alloy structure.
Electromigration
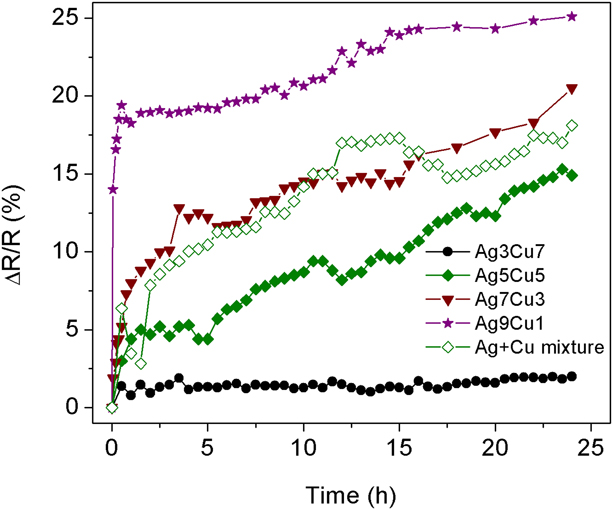
To perform an electromigration test, a single-line conductive track was printed on an ITO-coated glass substrate. Each of the printed lines had a length of 1 cm, a width of 1 mm, and a thickness of 280–300 nm. Four pastes with different AgCu NPs (Ag9Cu1, Ag7Cu3, Ag5Cu5, and Ag3Cu7) were used for testing. A constant voltage (1 V) was applied and the changes in electrical resistance were recorded and compared. Figure 9 shows the increase in resistance (expressed as an ratio to the original resistance) with time for conductive tracks made of different AgCu NPs. After applying the voltage for 25 h, the final ΔR/R ratios of Ag9Cu1, Ag7Cu3, Ag5Cu5, and Ag3Cu7 lines were, respectively, 25.1, 20.5, 18.9, and 2.11%. Compared to other samples, Ag3Cu7 have significantly suppressed the change in resistance (ΔR/R). One possible reason is that the denominator R of Ag3Cu7 is much larger compared to other samples. Another possible mechanism was proposed by Bhagat et al. [Reference Bhagat, Theodore, Chenna and Alford22]. The enhancement in electromigration lifetime after addition of Cu because (i) Cu atoms segregate at Ag grain boundaries, thus retarding Ag diffusion and (ii) there is lower surface energy and less thermal grain boundary grooving in Ag(Cu) grains as compared to Ag grains [Reference Hau-Riege20]. There were many larger particles, which had more segregated Cu atoms in sample Ag3Cu7 (Fig. 2). This means that there were more grain boundaries in this sample than other samples. In sum, the results demonstrated that electrical migration could be significantly reduced by adding some Cu to the Ag NPs.
Changes in resistance as a function of test time.
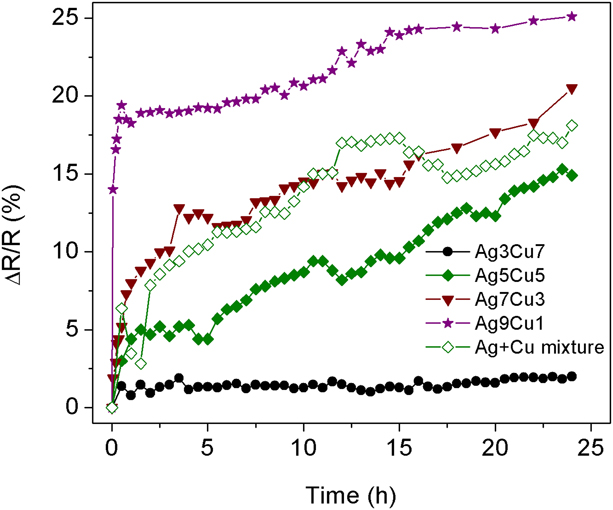
The trend of increase in resistance as a function of time for sample AgCu mixture is displayed in Fig. 8. The resistance of Ag and Cu mixture was rather unstable and the relative increment after 24 h was larger than that of sample Ag5Cu5. This indicated that Cu could work much better in the prevention of electromigration in alloy phase with Ag.
Scanning electron microscopy (SEM) mapping of Ag and Cu elements in Ag5Cu5 alloy and AgCu mixture line after 24 h test is shown in Fig. S6. The general mechanism of resistance increase is electromigration induced formation of voids and agglomeration. Under the same conditions, the density of voids for AgCu mixture sample [Figs. S6(d)–S6(f)] was much higher than that for Ag5Cu5 alloy [Figs. S6(a)–S6(c)], due to agglomeration. The agglomeration of Ag and Cu elements was much lower in Ag5Cu5 alloy sample. This behavior further confirmed the impact of alloy structure in prevention of electromigration.
Electroconductivity
We produced conductive lines on photo paper using a roller pen filled with metal inks. The calculated resistivity of lines sintered with the thermal process was 58 µΩ cm and 70 µΩ cm for Ag5Cu5 alloy and AgCu mixture, respectively. The alloy phase showed improved conductivity compared to mixtures. In addition, the Ag5Cu5 line was still conductive after 5-folds. The NPs were well connected even after cracks were formed.
Conclusions
In this paper, nearly monodisperse Ag–Cu nanoalloy particles with tunable composition were prepared by thermal decomposition of metal acetates. TEM and EDS analyses showed that Ag5Cu5 NPs had the highest size uniformity, and the Ag and Cu elements were evenly distributed among particles. When different amounts of Ag and Cu precursors were used, AgCu alloys with patchy element distribution were obtained. The formation of AgCu alloy was proved to have a win–win effect in that both the oxidation and electromigration problems were improved. AgCu alloy also showed enhanced electrical conductivity.
Experimental section
Chemicals
Silver acetate, 1-octadecene, oleic acid, terpineol, and ethyl cellulose were purchased from Sigma Aldrich, St. Louis, Missouri. Copper acetate monohydrate was from Alfa Aesar, Ward Hill, Massachusetts. Oleyl amine and ODL were from Aladdin, Shanghai, China. Ethanol (95%) and n-hexane (95%) were from Mallinckrodt, St. Louis, Missouri. All chemicals were used directly without any further purification.
Synthesis of Ag–Cu NPs
First, 5 mL 1-octadecene was heated to 130 °C for 30 min under nitrogen atmosphere. Next, 0.564 g (2 mmol) oleic acid, 0.535 g (2 mmol) oleylamine, 0.083 g (0.5 mmol) silver acetate (AgCH3COO), 0.1 g (0.5 mmol) copper acetate (Cu(CH3COO)2·H2O), and 0.541 g (2 mmol) ODL were added. Under the inert atmosphere, the mixture was heated to 200 °C at a heating rate of 10 °C/min and kept at that temperature for 2 h while stirring. Then, the heating mantle was removed, and the reaction was stopped. The reaction system was cooled down to room temperature naturally. Ethanol was added to the mixture to precipitate the synthesized NPs. Then the NPs were washed several times with hexane and ethanol by centrifugation.
The mole ratios between silver acetate and copper acetate were changed from 1:9 to 9:1 with a constant total molar amount of 1 mmol. The resulting Ag–Cu NPs were labeled as Ag1Cu9, Ag3Cu7, Ag5Cu5, Ag7Cu3, and Ag9Cu1, respectively.
Preparation of Ag–Cu pastes and electromigration test
0.114 g ethyl cellulose was added into 5 g terpineol and the mixture was used as polymeric matrix. 1 g Ag–Cu NPs were dispersed in 1 mL terpineol and 0.5 mL hexane. Ag–Cu suspension was mixed with 1 g polymeric matrix by sonication for 1 h. Then the paste was heated at 85 °C for 30 min to remove hexane.
The prepared paste was applied onto a tin doped indium oxide (ITO) coated glass substrate by a screen-printing mesh. The printed pattern was dried in an oven at 80 °C for 30 min. Printing process was repeated for three times. For thermal sintering, the printed pattern was placed in a tube furnace at 250 °C under a H2 and N2 (5:95 in volume) atmosphere for 3 h.
To study the effect of copper on electromigration, four samples with different compositions (Ag9Cu1, Ag7Cu3, Ag5Cu5, and Ag3Cu7) were used to draw the lines for testing. Each of the printed lines had a length of 1 cm, a width of 1 mm, and a thickness of 280–300 nm. A CHI 760E electrochemical workstation was used to apply a constant voltage (1 V) to the metal lines at a room temperature. The changes in electrical resistance were recorded by the electrochemical workstation.
Characterization
XRD patterns were collected with the Powder X-ray diffractometer Philips with Cu Kα radiation (λ = 1.54056 Å). Scan range for all metal nanocrystals was from 20° to 80°. XPS was carried out with Model PHI 5600 XPS Spectrometer (RBD instruments, Bend, Oregon). The chemical composition of the prepared nanocrystals was analyzed ICP-OES using an Optical 7300 DV instrument (PerkinElmer, Inc., Waltham, Massachusetts). The photomicrographs of metal nanocrystals were characterized by TEM (JEM 2010, JEOL) and HRTEM (JEM 2010F, JEOL), equipped with EDS at an accelerating voltage of 200 kV. The EDS spectra of the NPs were taken in high-angle annular dark-field scanning transmission electron microscopy (HAADF-STEM) mode. The software was INCA by Oxford Instrument. For the preparation of samples for TEM analysis, one drop of metal nanocrystal solution was placed onto a carbon-coated copper grid, and the solvent (n-hexane) was allowed to evaporate at 50 °C. The element distribution of metal lines was investigated by JSM-6700F, JEOL SEM with EDS at an accelerating voltage of 10 kV. A FT-IR spectrophotometer (Bio-Rad, FTS6000) was used to record any change of chemical functionality in reaction systems. TGA of the NPs was performed under an air atmosphere by Perkin Elmer UNIX/TGA7 (Shanghai, China).
Supplementary material
To view supplementary material for this article, please visit https://doi.org/10.1557/jmr.2019.71.
Acknowledgment
This work is supported by the Guangzhou Science Technology and Innovation Commission (Grant No. 201704030090).