


INTRODUCTION
Lacustrine sediments have been widely used in paleoseismological investigations in many tectonically active regions, including the Swiss, Italian, French, and New Zealand Alps, the Andes of southern Chile, and the Cascadia subduction margin in North America (e.g., Siegenthaler et al., Reference Siegenthaler, Finger, Kelts and Wang1987; Chapron et al., Reference Chapron, Beck, Pourchet and Deconink1999, Reference Chapron, Van Rensbergen, De Batist, Beck and Henriet2004, Reference Chapron, Ariztegui, Muslow, Villarosa, Prio, Outes, Juvignie and Crivelli2006, Reference Chapron, Juvigne, Muslow, Ariztegui, Magand, Bertrand, Pino and Chapron2007; Schnellmann et al., Reference Schnellmann, Ansellmetti, Giardini, McKenzie and Ward2002, Reference Schnellmann, Anselmetti, Gardini and McKenzie2005, Reference Schnellmann, Anselmetti, Giardini and McKenzie2006; Karlin et al., Reference Karlin, Holmes, Abella and Sylvester2004; Moernaut et al., Reference Moernaut, De Batist, Charlet, Heirman, Chapron, Pino, Brummer and Urrutia2007, Reference Moernaut, Van Daele, Heirman, Fontijn, Strasser, Pino, Urrutia and De Batist2014; Bertrand et al., Reference Bertrand, Charlet, Chapron, Fagel and De Baptist2008; Howarth et al., Reference Howarth, Fitzsimons, Norris and Jacobsen2012, Reference Howarth, Fitzsimons, Norris and Jacobsen2014; Morey et al., Reference Morey, Goldfinger, Briles, Gavin, Columbaroli and Kusler2013; Simonneau et al., Reference Simonneau, Chapron, Vanniere, Wirth, Gilli, Di Giovanni, Anselmetti, Desmet and Magny2013; Strasser et al., Reference Strasser, Monecke, Schnellman and Anselmetti2013; Hilbe and Anselmetti, Reference Hilbe and Anselmetti2014; Kremer et al., Reference Kremer, Hilbe, Simpson, Decrouy, Wildi and Girardclos2015; Van Daele et al., Reference Van Daele, Moernaut, Doom, Boes, Fontijn, Heirman and Vandoorne2015; Wilhelm et al., Reference Wilhelm, Nomade, Crouzet, Litty, Sabatier, Belle and Rolland2016). In these settings, mass wasting deposits and turbidites in lacustrine stratigraphic sequences have been interpreted as indicators of earthquake-triggered failures of subaqueous slopes and have been used to construct chronologies of past seismicity. Most recently, efforts have been aimed at refining interpretations of these sedimentary records, including establishing the variable sensitivity of different lakes to shaking, and developing reconstructions of not only the timing, but also the intensity of past earthquakes (Strasser et al., Reference Strasser, Monecke, Schnellman and Anselmetti2013; Moernaut et al., Reference Moernaut, Van Daele, Heirman, Fontijn, Strasser, Pino, Urrutia and De Batist2014, Reference Moernaut, Van Daele, Strasser, Clare, Heirman, Viel and Cardenas2015; Van Daele et al., Reference Van Daele, Moernaut, Doom, Boes, Fontijn, Heirman and Vandoorne2015). In a limited number of studies, moreover, researchers have sought to identify the signals in lake sediments of earthquake impacts beyond the lakes themselves (Chapron et al., Reference Chapron, Ariztegui, Muslow, Villarosa, Prio, Outes, Juvignie and Crivelli2006; Howarth et al., Reference Howarth, Fitzsimons, Norris and Jacobsen2012, Reference Howarth, Fitzsimons, Norris and Jacobsen2014; Avşar et al., Reference Avşar, Hubert-Ferrari, De Batist and Fagel2014). These investigations, which identify elevated postseismic sediment influx to lakes driven by earthquake-induced landsliding on catchment hillslopes, offer the promise of using lacustrine sedimentary records to monitor earthquake impacts over wider areas.
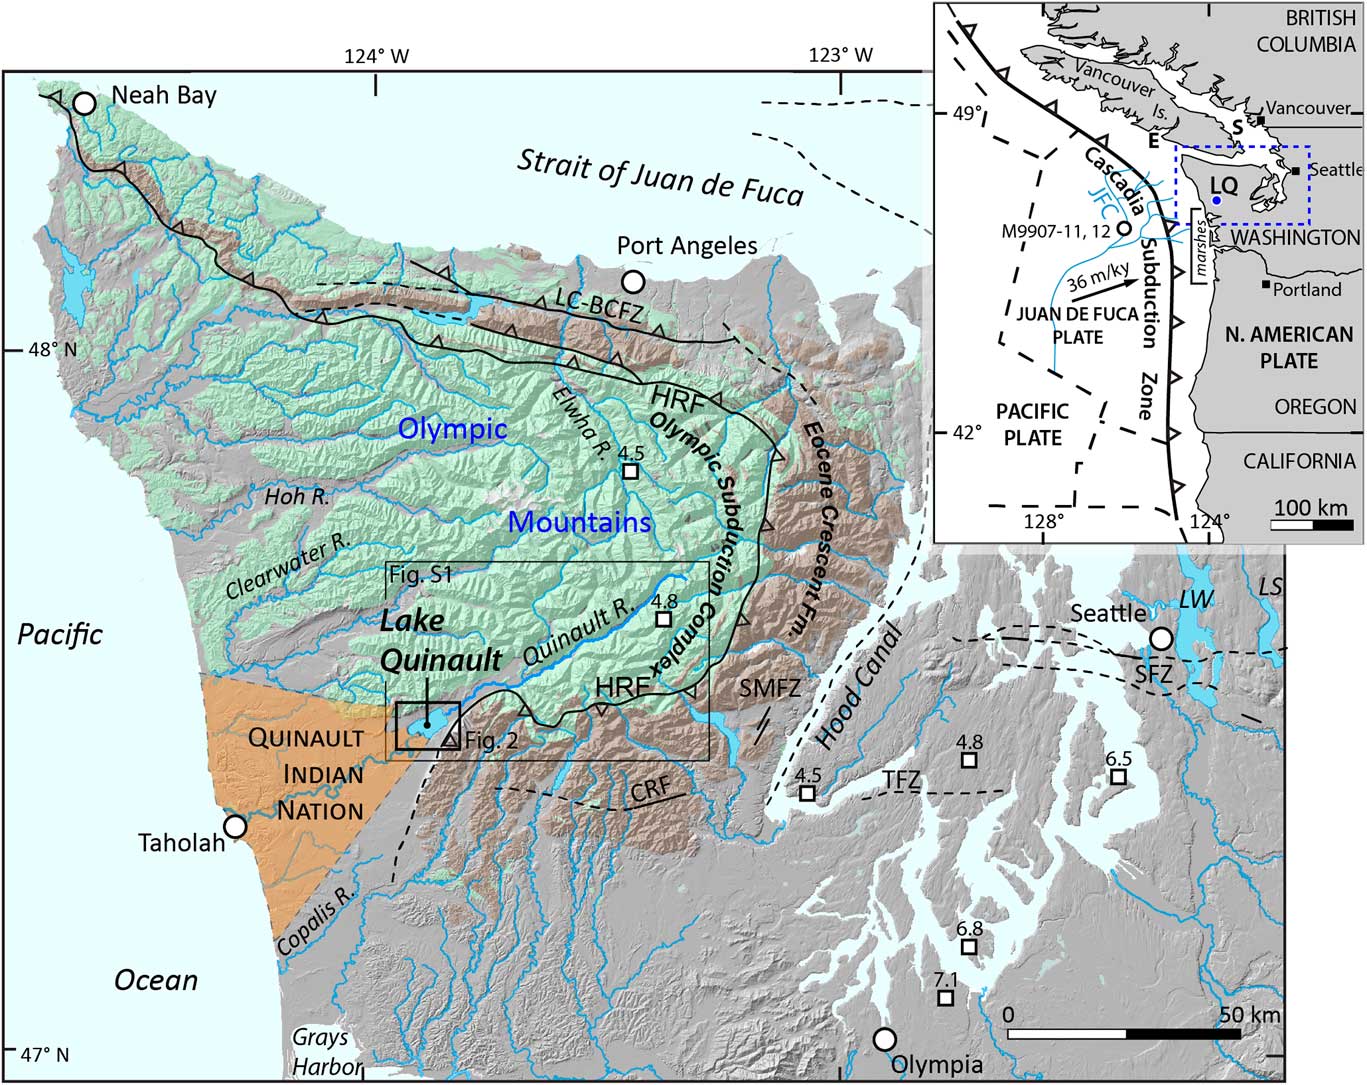
The goal of the present study was to explore the use of lake deposits as records of earthquake shaking and fluvial sediment input from earthquake-induced landslides in the Cascadia region. Lake Quinault, located at the foot of the Olympic Mountains in western Washington about 30 km inland from the Pacific Ocean (Fig. 1), was chosen as a study site because of its location in a seismically active area and potential to trap sediment derived from the steep, landslide-prone catchment of the upper Quinault River. Lacustrine environments such as Lake Quinault that receive large supplies of fluvial detrital sediment can be challenging settings in which to reconstruct paleoseismic history, in part because they preserve sedimentary records of events including hydrologically driven river floods whose products may be difficult to distinguish from those related to earthquakes. Relatively high sediment accumulation rates in these lakes, moreover, mean that long cores are necessary to acquire paleorecords that extend backward for centuries to millennia, thereby posing technical challenges. On the other hand, settings like Lake Quinault provide unique opportunities to assess the effects of seismic events on important upland settings away from the coastal zone where freshwater environments as well as human populations and associated infrastructure may be affected by future earthquakes.
Regional setting of Lake Quinault. Top inset: Simplified tectonic map of the Cascadia subduction zone (CSZ), where the Juan de Fuca plate dives beneath North America at the rate of 36 m/ka at the latitude of the Olympic Mountains (DeMets and Dixon, Reference DeMets and Dixon1999). Lake Quinault (LQ) is located on the west side of the Olympic Mountains. The locations of regional paleoseismic archives discussed in the text, such as Effingham (E) and Saanich (S) Inlets on Vancouver Island, coastal marshes of southern Washington and northern Oregon (marshes), such as the Johns River, Copalis River, and Columbia River estuaries, and offshore turbidite record from the Juan de Fuca (JFC) submarine channel are identified by their abbreviations on the inset map. The white circle depicts the approximate location of deep-sea sediment cores M9907-11 and 12, collected from the JFC (Goldfinger et al., Reference Goldfinger, Nelson, Morey, Johnson, Patton, Karabanov and Gutiérrez-Pastor2012) and highlighted in Figure 10. The area of the larger map is shown by the blue dashed line. Main map: Simplified tectonic and geologic map of the Olympic Peninsula. The subaerial Cascadia accretionary wedge crops out within the Olympic Mountains and is termed the Olympic subduction complex (Tabor and Cady, Reference Tabor and Cady1978), which is in thrust-fault contact with the overlying, and older volcanics of the Eocene Crescent Formation along the Hurricane Ridge Fault (HRF). Regional Holocene-active faults embedded in the upper crust include the Seattle (SFZ), Tacoma (TFZ), Saddle Mountain (SMFZ), Canyon River (CRFZ), and Lake Creek–Boundary Creek (LC-BCFZ) Fault Zones (U.S. Geological Survey, 2006). Epicenters for deep (>50 km) intraslab earthquakes >M 4.5 since 1900 within the map area are identified as squares with corresponding magnitude estimates (Pacific Northwest Seismic Network, 2016). Coseismic landslides in Lakes Washington (LW) and Sammamish (LS) are attributed to earthquakes originating from the SFZ and CSZ. Rectangles identify the areas depicted in Figure 2 and Supplementary Figure 1. (For interpretation of the references to color in this figure legend, the reader is referred to the web version of this article.)
BACKGROUND
Tectonic setting
The Olympic Peninsula in western Washington is situated along the northern Cascadia margin where the Juan de Fuca plate is undergoing subduction beneath the North American plate (Fig. 1). Previous regional work (e.g., Atwater and Hemphill-Haley, Reference Atwater and Hemphill-Haley1997; Atwater et al., Reference Atwater, Tuttle, Schweig, Rubin, Yamaguchi and Hemphill-Haley2003; Kelsey et al., Reference Kelsey, Nelson, Hemphill-Haley and Witter2005; Nelson et al., Reference Nelson, Kelsey and Witter2006; Blais-Stevens et al., Reference Blais-Stevens, Rogers and Clague2011; Goldfinger et al., Reference Goldfinger, Nelson, Morey, Johnson, Patton, Karabanov and Gutiérrez-Pastor2012, Reference Goldfinger, Galer, Beeson, Hamilton, Black, Romsos, Patton, Nelson, Hausmann and Morey2017; Enkin et al., Reference Enkin, Dallimore, Baker, Southon and Ivanochko2013) underlies the consensus that at least eight great megathrust earthquakes (M w 8–9) have occurred in the past 3500 yr. The most recent and best documented of these earthquakes has been constrained to be a magnitude 9 event that occurred on January 26, 1700 (Atwater et al., Reference Atwater, Musumi-Rokkaku, Satake, Tsuji, Ueda and Yamaguchi2005). In addition to earthquakes generated along the plate interface off and potentially beneath the coast of Washington, large regional earthquakes occur beneath the Puget Lowland, both in the overriding North American plate and at depth within the subducting Juan de Fuca slab (e.g., Baker and Langston, Reference Baker and Langston1987; Rogers et al., Reference Rogers, Walsh, Kockelman and Priest1996; Staff of the Pacific Northwest Seismograph Network, 2001; Ichinose et al., Reference Ichinose, Thio and Somerville2004, Reference Ichinose, Thio and Somerville2006). Records of subaqueous slope failures and turbidites from Lake Washington contain sedimentologic evidence for seven seismic events over the last 3500 yr (>30 in the last 12,000 yr), including an estimated M w 7 upper plate earthquake about AD 900 along the Seattle Fault (Atwater and Moore, Reference Atwater and Moore1992; Jacoby et al., Reference Jacoby, Williams and Buckley1992; Karlin and Abella, Reference Karlin and Abella1992, Reference Karlin and Abella1996; Johnson et al., Reference Johnson, Dadisman, Childs and Stanley1999; Karlin et al., Reference Karlin, Holmes, Abella and Sylvester2004), although ambiguity exists as to the causative source mechanism (e.g., plate boundary, upper plate, or lower plate) for many of events identified in Lake Washington sediments. Recent paleoseismic trenching of fault scarps associated with the Saddle Mountain and Canyon River Fault Zones in the southeast Olympic Mountains (Fig. 1), indicate three additional M 7±0.2 earthquakes about 3700, 1800, and 1000 yr BP (Walsh and Logan, Reference Walsh and Logan2007a, Reference Walsh and Logan2007b; Witter et al., Reference Witter, Givler and Carson2008; Barnett et al., Reference Barnett, Sherrod, Hughes, Kelsey, Czajkowski, Walsh, Contreras, Schermer and Carson2015). Of importance to upland terrestrial records of past earthquakes in western Washington, a number of rock avalanche-dammed lakes in the eastern Olympic Mountains date to the time of the most recent known ruptures of either the Seattle or Saddle Mountain Fault Zones around 1100 cal yr BP (e.g., Schuster et al., Reference Schuster, Logan and Pringle1992).
These and other earthquakes generated by faults in the shallow crust of western Washington State are known only from the paleoseismic record (e.g., Nelson et al., Reference Nelson, Personius, Sherrod, Kelsey, Johnson, Bradley and Wells2014; Sherrod and Gomberg, Reference Sherrod and Gomberg2014). In contrast, beneath Puget Sound, deep (>50 km) intraslab earthquakes associated with subduction of the Juan de Fuca plate occur every couple of decades, for example in 1949 (M 6.9–7.1), 1965 (M 6.5), and 2001 (M 6.8) (Baker and Langston, Reference Baker and Langston1987; Chleborad and Schuster, Reference Chleborad and Schuster1998; Ichinose et al., Reference Ichinose, Thio and Somerville2004). Such Benioff-style events have caused liquefaction, limited subaerial landslides, sediment outgassing in lakes, and structural damage to buildings, bridges, and roads (e.g., Pringle, Reference Pringle2001; Troost et al., Reference Troost, Haugerud, Walsh, Harp, Booth, Steele, Wegmann, Pratt, Sherrod and Kramer2001; Walsh et al., Reference Walsh, Pringle and Palmer2001, Reference Walsh, Wegmann, Pringle, Palmer, Norman, Polenz, Logan, McKay, Magsino and Schasse2002), and although it is possible that such events might generate observable sedimentary records in lakes of western Washington, to date, none have yet been reported.
Lake history and characteristics
Lake Quinault formed around 18.6±5.1 ka behind the terminal moraine of the Quinault valley glacier (Staley, Reference Staley2015). The 15 km2 lake has steep sides and a flat bottom with a maximum depth of 73 m (Fig. 2). Upstream of the lake, the Quinault River originates in Olympic National Park at about 2250 m as it drains the rugged central core of the Olympic Mountains, which on geologic time scales (>105 yr) are the fastest deforming subaerial portion of the Cascadia forearc high (Brandon et al., Reference Brandon, Roden-Tice and Garver1998; Pazzaglia and Brandon, Reference Pazzaglia and Brandon2001). Upstream from the lake’s delta, the 600 km2 landslide-prone catchment draining the upper Quinault River (Supplementary Fig. 1) is the major source of water and sediment to the lake as opposed to streams that drain directly into the lake from adjacent uplands. The lake outlet is a single channel cut through the moraine and is referred to as the lower Quinault River.
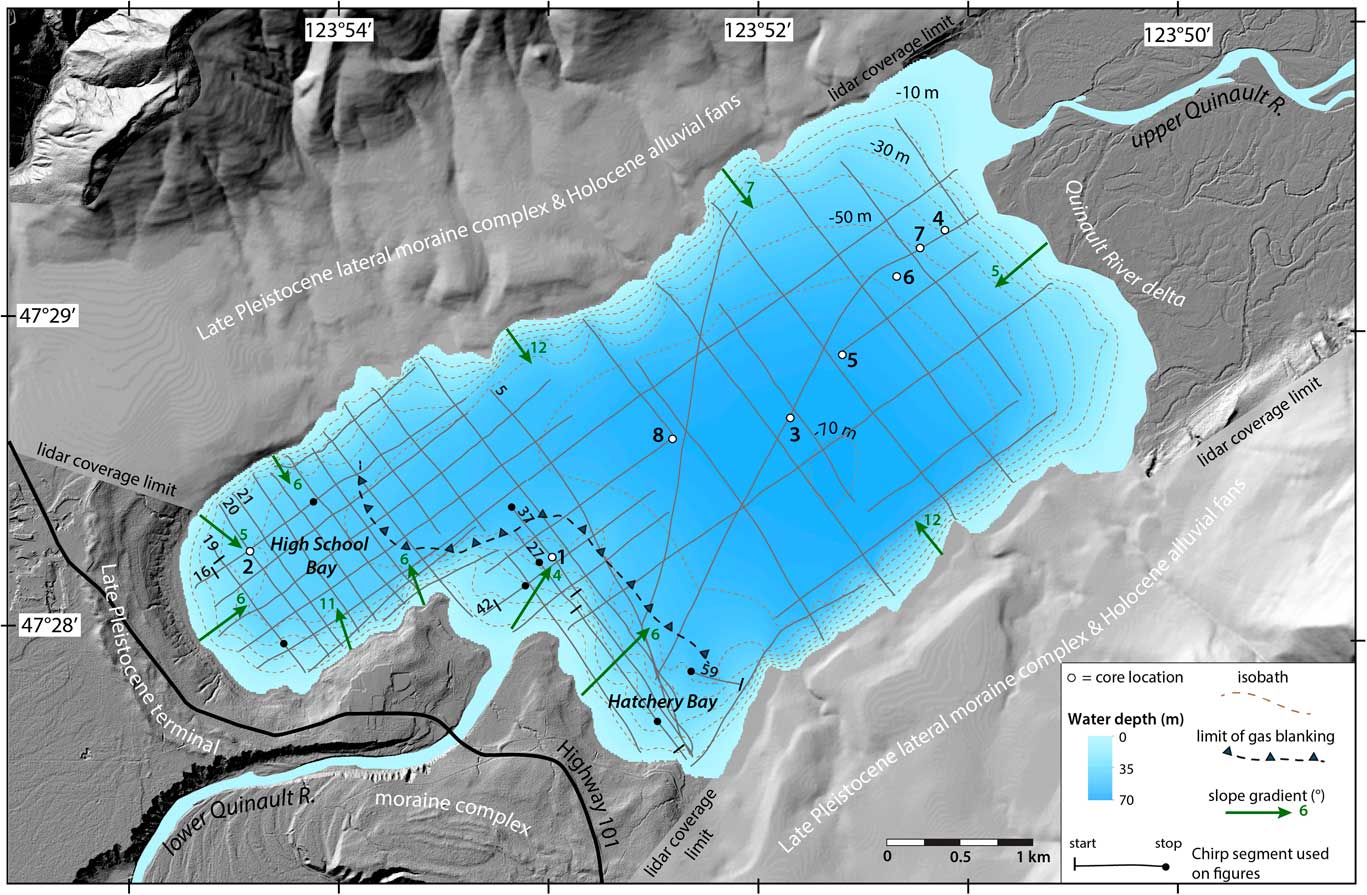
Close-up map of Lake Quinault showing seismic tracklines (solid gray lines; specific lines mentioned in the text are numbered), core locations (circles), and contoured bathymetry (dashed lines; contour interval 10 m), along with locations discussed in the text. Also shown by the heavy dashed line is the approximate boundary between the area of the lake where there is acoustic penetration so that seismic stratigraphy is visible and the area (toward which the arrows point) where there is gas blanking. The gradient of lake-bottom slopes (green arrows) ranges from about 5° to 12°. (For interpretation of the references to color in this figure legend, the reader is referred to the web version of this article.)
Sediment supply to Lake Quinault is modulated by seasonal flow of the upper Quinault River. The low-elevation western slope of the Olympic Mountains experiences mild winters with frequent, heavy winter rainfall that produce major freshets. These floods reduce water residence time in Lake Quinault, and create “fast-flushing” conditions in which lake volume exchanges as frequently as every 3–5 months (Stockner et al., Reference Stockner, Bos, Leavitt, Armstrong and Schindler2003; U.S. Geological Survey, 2015a). During extreme flood events or when historic landsides have occurred in the basin, clay and silt particles from the upper Quinault basin impart turbidity to the lake for extensive periods (e.g., in 1997 for nearly 5 months; Workman, L., personal communication, 2013). Under normal freshet conditions, fine (silt and clay) particles settle out during early spring prior to the snowmelt period. The late May to early June snowmelt freshet results in a temporary reduction of water transparency until early July. During summer months when river discharge is typically low, the lake water is generally of good transparency, clear and without noticeable humic staining. Available measurements of phosphorus (P) and nitrogen (N) concentrations are at detection levels for Lake Quinault, indicating that it is a low-productivity, ultraoligotrophic system (Stockner et al., Reference Stockner, Rydin and Heyenstrand2000).
Potential effects of past earthquakes on Lake Quinault
Given its location above the Cascadia megathrust and proximity to mapped upper crustal faults, the area around Lake Quinault is expected to have experienced strong ground accelerations during past earthquakes (Supplementary Fig. 2). Seismic shaking scenarios for an M 9 Cascadia subduction earthquake or an M 7.4 event on the closest known active fault in the upper crust, the Canyon River Fault, for example, indicate spatially consistent severe peak ground accelerations of 0.5 to 0.55 g and 0.1 to 0.25 g across the Quinault catchment, respectively. In contrast, a modeled M 7.2 deep earthquake within the subducted slab sourced beneath southern Puget Sound, similar to historic events like the Olympia (1949) or Nisqually (2001) earthquakes, is predicted to produce ground accelerations across the Lake Quinault catchment of about 0.1 g (U.S. Geological Survey, 2016). Within the Lake Quinault catchment, these peak ground accelerations are estimated to generate modified Mercalli shaking intensity (MMI) values that will be very strong to severe for a subduction earthquake and moderate to very strong for either an upper crust or deep intraslab earthquake (Worden and Wald, Reference Worden and Wald2016).
By comparison to lakes around the world, and based on its morphology and ample sediment supply from the upper Quinault River, these and other earthquakes are likely to have resulted in slope failures and rapid sediment mobilization (mass wasting) both within Lake Quinault and across its catchment. In this study, a seismic reflection survey and coring campaign were undertaken to assess the record of such effects in lake-bottom sediments. Reconnaissance mapping was additionally conducted in an effort to link earthquake-triggered mass wasting on catchment hillslopes with the lacustrine stratigraphy.
METHODS
Seismic reflection survey
A high-resolution compressed high-intensity radar pulse (CHIRP) seismic reflection survey of Lake Quinault was conducted in May 2013 using an Edgetech SB-512i system that operated at a 2–12 kHz sweep-frequency pulse with 20 ms duration. The instrument was suspended 1.25 m beneath the lake surface using a catamaran towed at a distance of 10 m behind a small boat. Tracklines were run at a speed of ~2.5–3.0 knots, with a cumulative length of ~91 km (Fig. 2). A Wide Area Augmentation System (WAAS)-enabled GPS provided horizontal positioning with an accuracy of about 1–3 m. Two-way travel times were converted to depths by assuming a mean sound velocity of 1500 m/s (Jensen et al., Reference Jensen, Kuperman, Michael and Schmidt2011).
Sediment coring
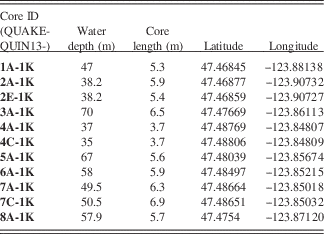
Guided by the results of the seismic survey, piston and gravity cores were recovered from eight sites spaced along the long axis of the lake at water depths between 35 and 70 m (Fig. 2; Table 1) using a Kullenberg coring system (Kelts et al., Reference Kelts, Briegel, Ghilardi and Hsu1986) deployed from a specially constructed platform (R/V KRKII) with a tower and moon pool. The piston cores range from 3.7 to 6.9 m in length and were collected in polycarbonate tubes of 7 cm outer diameter (Table 1). The accompanying gravity cores, which were recovered simultaneously at each coring site to provide a relatively undisturbed sediment-water interface, range in length from about 0.3 to 0.6 cm. The piston cores were cut into ≤1.5 m segments at the Lake Quinault field site. During this preparation, it was observed that the coring process caused disturbance to approximately the upper meter or more of core 8. Several of the cores showed minor expansion after cutting, consistent with the observation of abundant gas bubbles rising to the lake surface following core penetration, especially at the proximal (eastern) end of the lake, adjacent to the Quinault River mouth. Following cutting, all core segments were capped and sealed and transported to the LacCore Facility at the University of Minnesota in Minneapolis, where they were placed in cold storage before further processing and sampling approximately 10 days after recovery.
Kullenberg piston cores collected from Lake Quinault.
Sediment properties and dating
Whole core segments were scanned on a Geotek Standard Multisensor Core Logger (Geotek Limited, Daventry, UK) to measure bulk sediment density, acoustic wave velocity, electrical resistivity, and magnetic susceptibility at 5 mm resolution. The cores were then split, and the sediment surface was cleaned with glass slides in preparation for imaging and description. Cores images were generated on a Geotek Geoscan-IV line scan camera mounted on a dedicated Multi-sensor core logger-core imaging system (MSCL-CIS) track, and the core halves were scanned on a Geotek XYZ Multisensor Core Logger for color spectrophotometric reflectance and high-resolution point sensor magnetic susceptibility at 5 mm resolution. The core lithologies were then described and sampled, including for plant macrofossil material to be used for accelerator mass spectrometry (AMS)–14C analyses to construct core age-depth models. The photos and initial descriptions were later used to tally event layer thicknesses and estimate the extent of bioturbation, using a bioturbation index similar to that first proposed by Droser and Bottjer (Reference Droser and Bottjer1986) and subsequently commonly employed in studies of marine sediments (e.g., Expedition 317 Scientists, 2011). Elemental distributions for two of the cores, 1A and 3A, were generated using an ITRAX micro–X-ray fluorescence scanner at the Large Lakes Observatory in Duluth, Minnesota. The cores were scanned by a Mo X-ray tube with a 2 mm sampling step and a 30 s dwell time.
Samples taken from the cores were transported to North Carolina State University and frozen until further analysis. The particle-size distribution of thawed samples was characterized using a Beckman Coulter LS13-320 Laser Diffraction Particle Size Analyzer equipped with a Universal Liquid Module. The instrument measures particle sizes between 0.04 and 2000 μm.
Plant debris, including twigs, bark, leaf fragments, needles, and roots, were sampled from cores 2, 3, 6, and 7 and were analyzed for radiocarbon (14C) at DirectAMS in Seattle, Washington, and National Ocean Sciences Accelerator Mass Spectrometry in Woods Hole, Massachusetts (Table 2). Prior to submission for analysis, the samples were cleaned with 1N HCl and NaOH (the acid-base-acid [ABA] method; Olsson, Reference Olsson1986) to remove any carbonate coatings or humic acids that may have contaminated them during burial in soils or the lake bed. OxCal 4.2 software (Bronk Ramsey, Reference Bronk Ramsey2009) was used to calibrate the results with the IntCal13 calibration data of Reimer et al. (Reference Reimer, Bard, Bayliss, Beck, Blackwell, Bronk Ramsey and Grootes2013) and the Northern Hemisphere Zone 1 extension of IntCal13 for the years 1950–2010 (Hua et al., Reference Hua, Barbetti and Rakowski2013). An age-depth model for core 2 was generated using a Bayesian approach, as implemented by the R software package Bacon (Blauuw and Christen, Reference Blaauw and Christen2011) and again using the IntCal13 radiocarbon calibration curve (Reimer et al., Reference Reimer, Bard, Bayliss, Beck, Blackwell, Bronk Ramsey and Grootes2013). The age-depth model combines data with “prior” knowledge of stratigraphic ordering to narrow the magnitude of age error envelopes as well as to estimate the ages of undated levels in the core (see, e.g., Wright et al., Reference Wright, Edwards, van de Plassche, Blaauw, Parnell, van der Borg, de Jong, Roe, Selby and Black2017). The calibrated dates used in the model do not account for the probable offset in the age of the dated plant detritus and the age of deposition. The model was constructed using both uncorrected depths and depths corrected for sediment compaction. Lake sediments were decompacted by fitting an exponential curve to the core depth-density records to estimate porosity assuming a density of 2650 kg/m3 for the sediment grains and 1000 kg/m3 for the interstitial fluids. The decompacted depth range (Table 2) reflects the 1-sigma confidence interval of the regression.
Radiocarbon data.
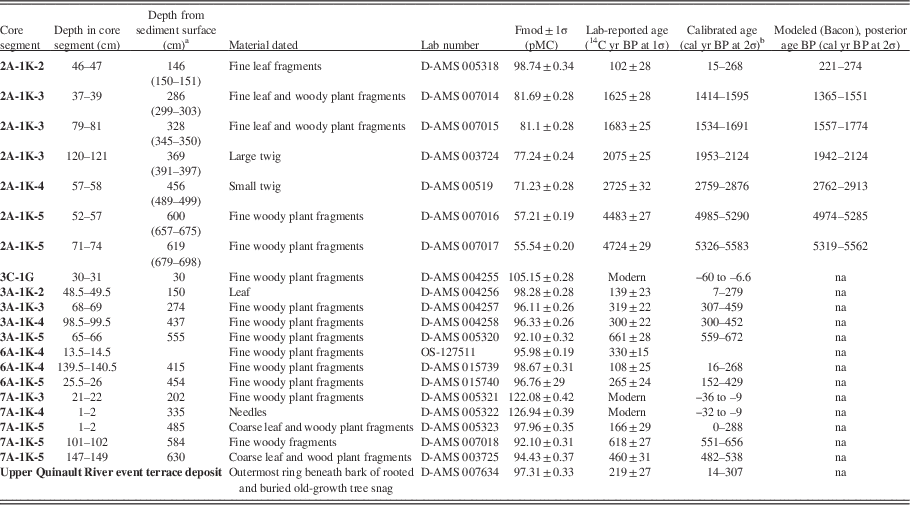
a Depths in parentheses reflect a correction for sediment decompaction using an exponential curve fitted to the core depth-density records to estimate porosity assuming a density of 2.65×10³ kg/m3 for the sediment grains and 1×10³ kg/m3 for the interstitial fluids. The decompacted depth range reflects the 1-sigma confidence interval of the regression.
b Dates were calibrated using the IntCal13 curve and the Northern Hemisphere Zone 1 extension of IntCal13 using OxCal 4.2 software (Bronk Ramsey, Reference Bronk Ramsey2009; Hua et al., Reference Hua, Barbetti and Rakowski2013; Reimer et al., Reference Reimer, Bard, Bayliss, Beck, Blackwell, Bronk Ramsey and Grootes2013). Fmod, fraction modern; na, not applicable.
Catchment reconnaissance
Reconnaissance mapping was conducted in the upper Quinault catchment above the lake to assess the linkage between lacustrine records of earthquake disturbance to potential evidence for subaerial mass wasting–forced stream aggradation during large earthquakes. Radiocarbon samples from the outermost preserved annual ring from buried and rooted subfossil trees were collected from near the Graves Creek–upper Quinault River confluence (Supplementary Fig. 1). The identification of knickzones, channel reaches of anomalously steep gradients, was aided by the plotting of the longitudinal profiles of the Quinault and North Fork Quinault Rivers. These longitudinal profiles were extracted from the 10 m U.S. Digital Elevation Dataset using ArcGIS software and smoothed by applying a first-order polynomial Locally Weighted Smoothing (LOESS) tricube weighting routine in SigmaPlot with a kernel 0.1 times the river channel length in order to remove the influence of source data artifacts.
RESULTS
As detailed subsequently, results of the seismic reflection survey, sediment core analysis, and catchment reconnaissance provide evidence for three episodes of earthquake disturbance in the past 3000 yr. Past earthquakes have triggered failures on the lake’s underwater slopes and delta front as well as subaerial landsliding, partial channel blockage, and forced fluvial sediment aggradation upstream of the lake.
Seismic stratigraphy
Two distinct, superposed seismic facies can be delineated in CHIRP profiles from the distal, southwestern slopes of the lake adjacent to the late Pleistocene moraine (Fig. 3). Seismic facies A extends from the present-day lake floor to about 3 m depth. Seismic facies B extends to the limit of acoustic penetration ~15–20 m beneath the lake bed.
(color online) CHIRP (compressed high-intensity radar pulse) seismic trackline 37, along which core 1 was collected, showing the abrupt contact between seismic facies A and B. Sediment depth was calculated for an acoustic velocity of 1500 m/s.
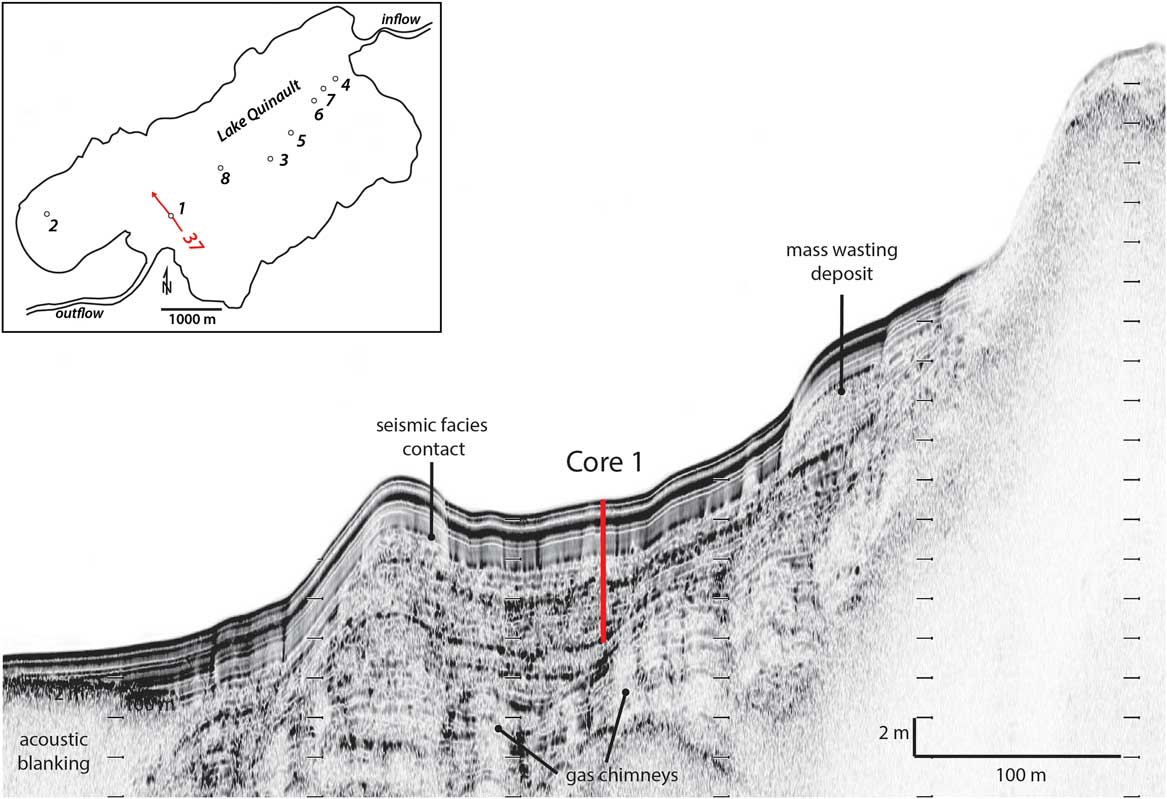
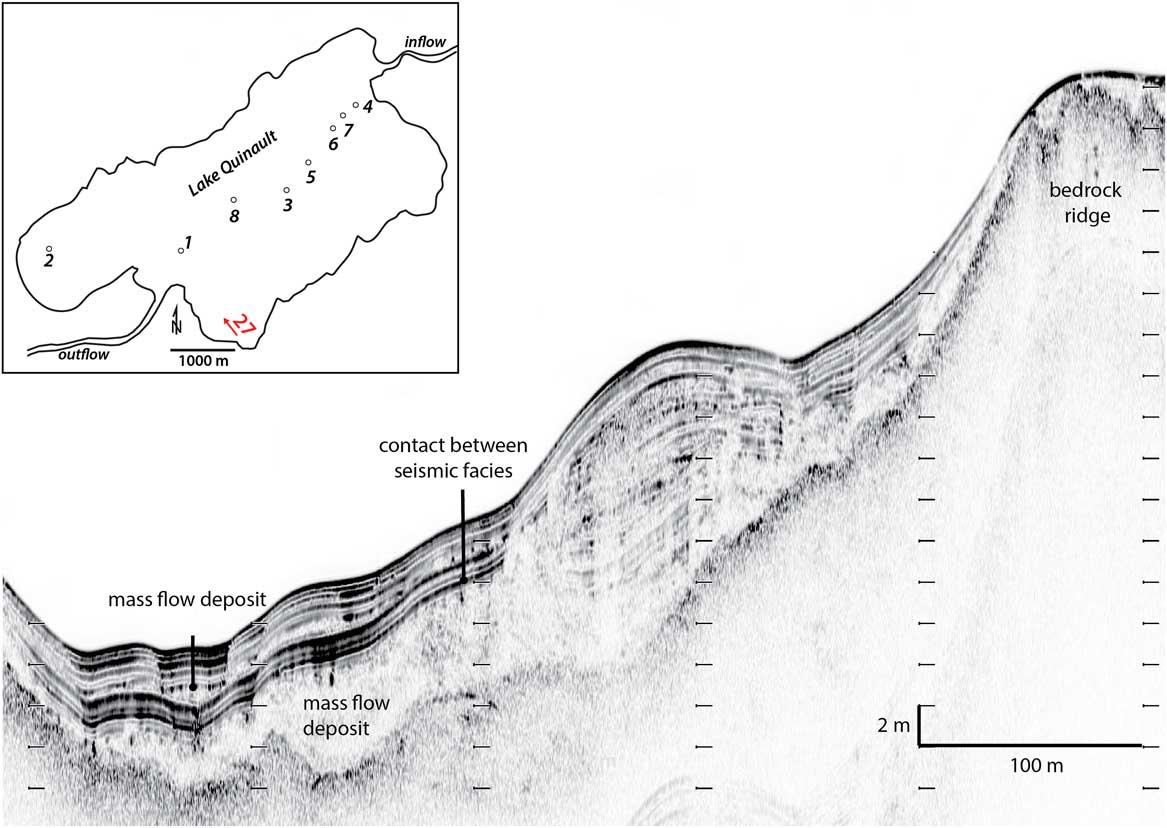
Seismic facies A is characterized by medium- to high-amplitude, parallel, and continuous reflectors. The acoustic layers of this facies indicate even draping of previous bathymetry. The similar pattern of reflections observed in seismic facies A across the entire southwestern side of the lake indicates a uniform stratigraphy. In only one limited area along trackline 27 does seismic facies A contain intercalated lens-shaped sediment bodies with chaotic to transparent seismic character that is indicative of mass wasting deposits (Fig. 4).
(color online) Seismic profile along trackline 27 showing a large subaqueous slide and mass flow deposit in Hatchery Bay that is draped by the acoustically well-stratified seismic facies A. This profile shows a rare example of the intercalation of mass flow deposits within seismic facies A. Sediment depth was calculated for an acoustic velocity of 1500 m/s.
Seismic facies B, in contrast, is characterized by weaker, parallel, and more discontinuous reflectors. Narrow vertical to subvertical zones of acoustic turbidity are abundant in this facies and resemble gas chimneys documented in other locations (e.g., Hovland and Judd, Reference Hovland and Judd1988; Cathles, et al. Reference Cathles, Su and Chen2010; Cukur et al., Reference Cukur, Krastel, Tomonaga, Cagatay and Meydan2013; Fig. 3). In Lake Quinault, the lower ends of the gas chimneys can be traced to 15–20 m depth beneath the lake floor, where acoustic energy is attenuated and below which seismic stratigraphy cannot be resolved. Most of the chimneys extend upward and terminate at the base of seismic facies A, although some cut across it to reach the sediment-water interface. In several places, active venting of gas to the water column was observed during the seismic survey (Supplementary Fig. 3).
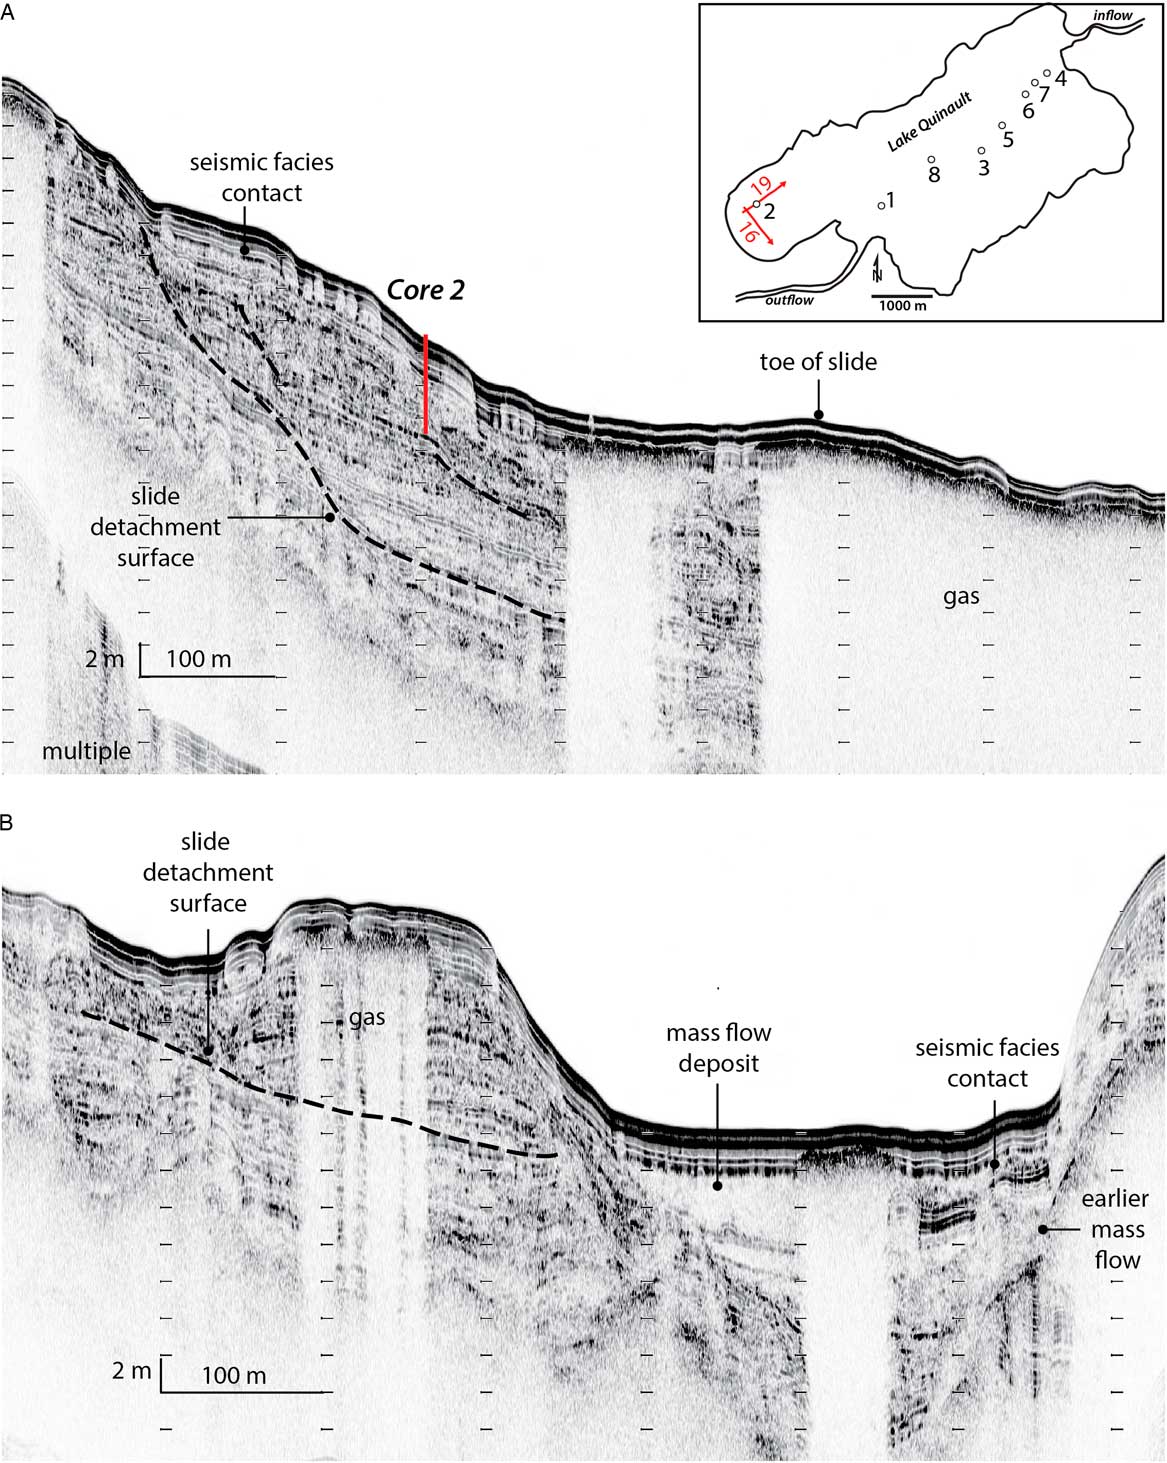
Seismic facies B shows evidence for mass wasting, including two large, lobate slides originating from the subaqueous lake slopes, with volumes of roughly 6×10⁶ m3 and 1×10⁶ m3, which as shown subsequently were likely emplaced around 1400–1700 cal yr BP. In High School Bay along trackline 16 (Fig. 2), a longitudinal profile along the flank of the larger of these slides is imaged (Fig. 5A), and tracklines 19 (Fig. 5B), 20, and 21 image transverse sections across the depositional lobe of the same slide. These lines show progressively lower slide-body relief with distance from the shore toward the center of the lake. The upper 3 m of this slide was sampled in core 2, while the detachment surface at the base of the slide appears to lie approximately 12 m below the sediment-water interface (Fig. 5A). Strata above this surface are cut by listric normal faults, indicating extension and lateral spreading during sliding. In the transverse profiles, this level marks a transition from flat to convex-upward reflectors (Fig. 5B). Similar to subaqueous slides described by Schnellmann et al. (Reference Schnellmann, Anselmetti, Giardini and McKenzie2006) from Lake Lucerne, Switzerland, the continuity of acoustic layering in internal parts of the slide indicates basinward movement of a relatively coherent block of sediment. Flanking the slide deposit, however, is an acoustically chaotic to transparent lens of sediment up to 4 m thick (Fig. 5B). It is likely that this body is a mass flow deposit that has undergone a higher degree of disintegration than the large slide and has ponded in the confined area adjacent to the slide body. The draping of the slide and adjacent mass flow deposit by the relatively undisturbed strata of seismic facies A indicates that movement occurred just prior to accumulation of that facies. In several places, however, seismic facies A shows flexure above the listric faults within the slide, suggesting small-scale, later movement (Fig. 5A). In a few places, the faults extend to the lake bed.
(color online) Seismic images showing side (A) and cross-sectional (B) views of the slide in High School Bay imaged along tracklines 16 and 19, respectively. An interpreted earlier mass flow deposit is visible in panel B. Sediment depth was calculated for an acoustic velocity of 1500 m/s.
The second, smaller slide was imaged in Hatchery Bay (Fig. 2). The CHIRP profiles through this feature suggest that it includes at least two large, stacked, coherent blocks ~50 m long and 5 to 6 m thick, as well as more disintegrated mass flow strata (Fig. 4). Similar to the slide in High School Bay, the entire slide body is draped by the relatively undeformed, acoustically well-layered seismic facies A, providing evidence for penecontemporaneous failure.
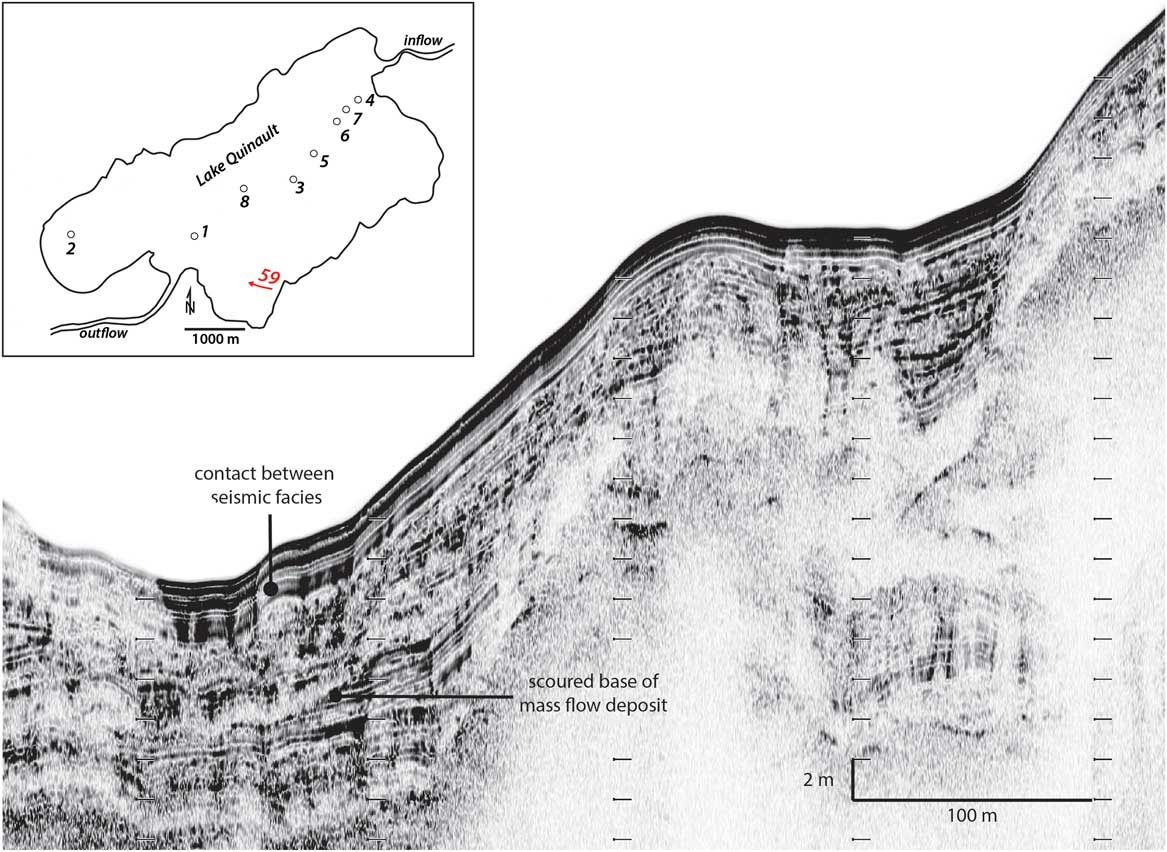
In addition to these two well-delineated subaqueous slides, seismic profiles from the base of the slopes bordering High School Bay and Hatchery Bay show evidence for earlier, more deeply buried mass flow deposits (Figs. 5B and 6). In Hatchery Bay along trackline 59 (Figs. 2 and 6), an acoustically chaotic to transparent sediment body, roughly 1.5 to 2 m thick and at least 130 m in lateral extent, lies approximately 6 m below the relatively flat current lake floor at 52 m water depth. This sediment body has an irregular base that appears to scour downward into well-layered strata below (Fig. 6). The top of the body exhibits hummocky topography.
(color online) Seismic image of trackline 59, showing earlier mass wasting deposits in Hatchery Bay. Note that beneath seismic facies A, stratigraphy is partly obscured by gas, yet the irregular and erosive base of this mass wasting deposit is apparent. Sediment depth was calculated for an acoustic velocity of 1500 m/s.
Although a great deal of information is discernable from CHIRP profiles from the slopes bordering the southwestern side of the lake distal from the Quinault River delta, acoustic penetration decreases abruptly near the base of the slope. Over most of the lake, CHIRP profiles show acoustic blanking indicating absorption of the seismic signal in gas-charged sediments similar to that observed in other lacustrine and marine settings (e.g., Loseth et al., Reference Loseth, Gading and Wensaas2009; Cukur et al., Reference Cukur, Krastel, Tomonaga, Cagatay and Meydan2013; Fig. 2).
Core sedimentology and geochronology
Sediments recovered in cores along the sampling transect from the lake outlet toward the delta reflect the dominance of detrital sediment input from the upper Quinault River, coarsening from silty clay at sites most distal from the river mouth (cores 1 and 2) to clayey silt in the flat basin center (cores 8, 3, and 5), to fine-medium sand at the most proximal sites located on the delta slope (cores 6, 7, and 4; Fig. 7). Based on radiocarbon dates for plant debris in cores 2, 3, and 7 (Table 2 and Fig. 7; Supplementary Fig. 4), mean sediment accumulation rates are estimated to increase across the lake toward the delta from less than 1 to greater than 10 mm/yr, and the sediments in the piston cores are estimated to record roughly 5500 yr on the lake’s distal end and 500–600 yr of deposition at the lake center and on the delta slope. Each of the cores shows an overall coarsening upward trend, reflecting delta progradation and partial sediment infilling of the lake. The cores are dominated by physically stratified sediments, but evidence for moderate bioturbation is discernable in some intervals, suggesting that, like today, the lake was well mixed during sediment accumulation and that oxygen levels in the lower water column were at least episodically sufficient to support benthic organisms (Supplementary Fig. 5). Event layers, comprising centimeter- to decimeter-thick, graded beds of silt and sand that are coarser than the “background” sediments with which they are interstratified, are visually recognizable in each of the cores and are described further in the sections on the sedimentology of the distal, central, and proximal coring sites (Fig. 7; Supplementary Fig. 6).
Photos, magnetic susceptibility logs, and interpretation of a series of cores collected along a transect across Lake Quinault from its western subaqueous slopes to the upper Quinault River delta. Radiocarbon dates for terrestrial plant debris are expressed as the calibrated age ranges at two standard deviations (see also Table 2). The stratigraphic position of evidence for three earthquake disturbance events (Q1, Q2, and Q3) is shown. The bioturbated bed and correlative laminated silt bed (colored yellow) in cores 3, 6, and 7 are interpreted to record reduced sediment accumulation rates in the lake associated with landsliding and partial fluvial channel blockage upstream from the lake following the Q1 event. In cores 1 and 2, deformed strata (colored blue) and an overlying cluster of graded silt beds at about 300 cm depth marks the Q2 event, and the cluster of graded silt beds at about 430 cm depth is inferred to record the Q3 event. (For interpretation of the references to color in this figure legend, the reader is referred to the web version of this article.)
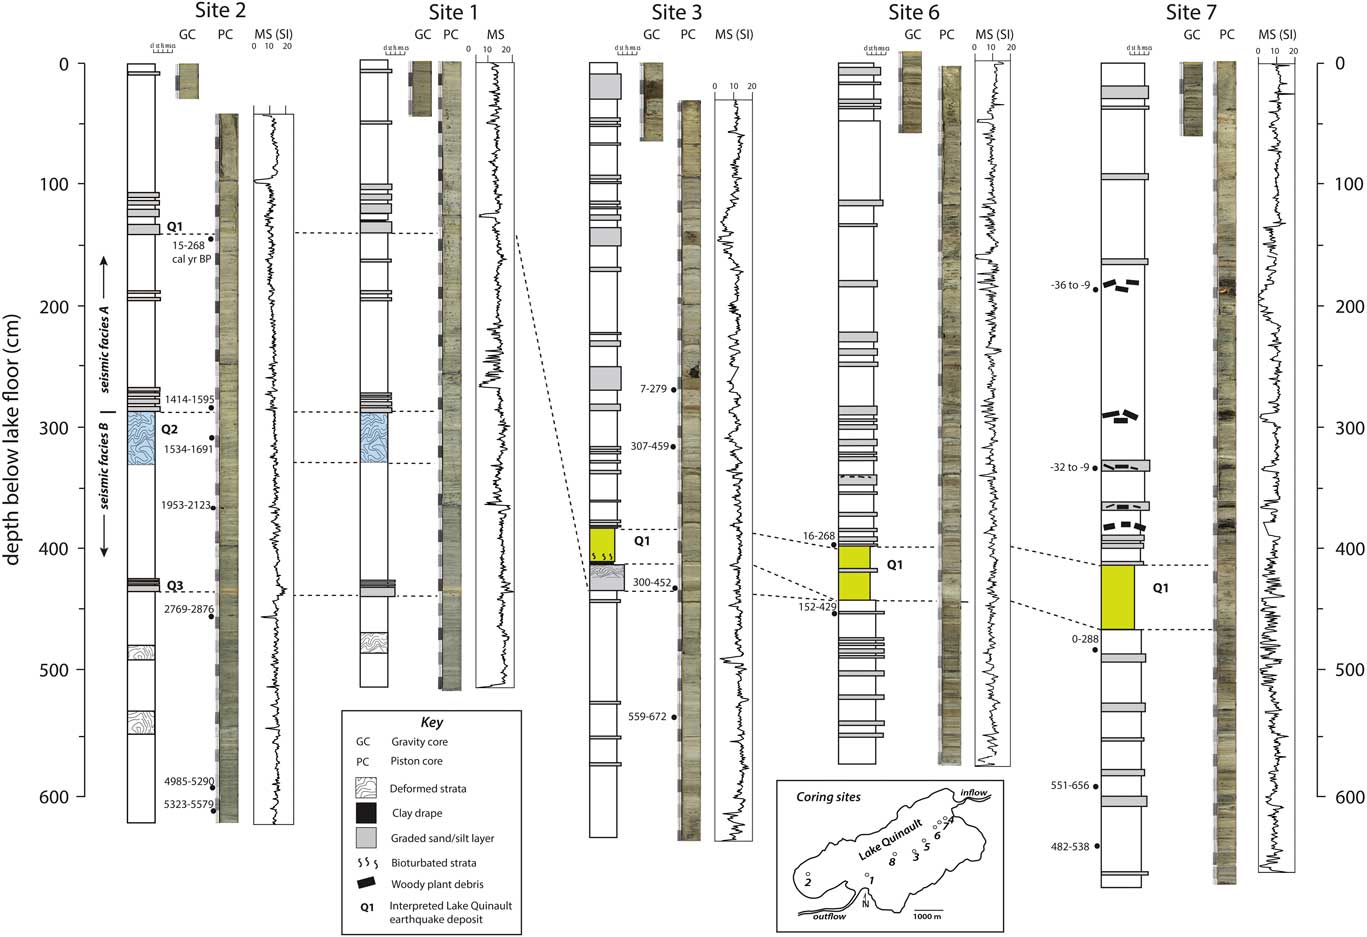
Notably, magnetic susceptibility was not as useful a tool for recognition and correlation of these layers as it has been in studies of deep-sea cores and small lakes from the Cascadia region (e.g., Atwater and Griggs, Reference Atwater and Griggs2012; Goldfinger et al., Reference Goldfinger, Nelson, Morey, Johnson, Patton, Karabanov and Gutiérrez-Pastor2012, Reference Goldfinger, Galer, Beeson, Hamilton, Black, Romsos, Patton, Nelson, Hausmann and Morey2017; Morey et al., Reference Morey, Goldfinger, Briles, Gavin, Columbaroli and Kusler2013). Some silt and sand layers in the Lake Quinault cores exhibit an increase in magnetic susceptibility relative to the finer-grained, underlying and overlying background sediments that likely reflects a higher content of iron-bearing minerals (e.g., layer at ~430 cm depth in piston cores from sites 2 and 1; Fig. 7). In contrast, many of the event layers identified visually show lower magnetic susceptibility compared with the sub- and superjacent strata that may reflect relatively high concentrations of fine plant debris (e.g., layers between 300 and 400 cm depth in piston core from site 7; Fig. 7; Smith, Reference Smith2016). The magnetic susceptibility response of the thickest, visibly most distinctive event layer sampled in the Lake Quinault stratigraphy, at 430 cm depth in core 3 (Fig. 7), is indistinguishable from that of the strata above and below.
Sedimentology at the distal coring sites
Cores 1 and 2, from the distal end of the lake (Fig. 2), were recovered from a flat subbasin on the lake’s southwestern slopes, where sediments have ponded (Fig. 3), and from the gently sloping margin of High School Bay (Fig. 5A), respectively. The two cores exhibit an almost identical stratigraphy, allowing lamina to lamina correlation despite poor recovery of several tens of centimeters of strata at the top of core 2 (Fig. 7). The cores are composed primarily of gray, laminated to thinly bedded silty clay containing sparse diatom tests. These dominantly detrital sediments likely record settling of riverine sediment from low-density suspensions acting as interflows or overflows (Sturm and Matter, Reference Sturm and Matter1978; Lauterbach et al., Reference Lauterbach, Chapron, Brauer, Hüls, Gilli, Arnaud and Piccin2012). Interstratified with the clayey silt are several thicker and coarser graded silt beds that are interpreted as the products of episodic, higher-density suspensions acting as underflows (hyperpycnal flows; Sturm and Matter, Reference Sturm and Matter1978; Mulder and Chapron, Reference Mulder and Chapron2011; Lauterbach et al., Reference Lauterbach, Chapron, Brauer, Hüls, Gilli, Arnaud and Piccin2012). Notably, clusters of these layers are present at several levels in the cores (Fig. 7). A cluster of four beds at about 430 cm depth includes a 6-cm-thick, inversely to normally graded, red-brown silt layer with a gray clay cap and three overlying similar layers that are 2, 1, and 0.5 cm thick, respectively (Fig. 7; Supplementary Fig. 7). A cluster of four normally graded, 4.5- to 3-cm-thick silt beds that are rich in fine woody debris lies at 290 cm depth, with the lower two characterized by gray clay caps (Supplementary Fig. 8). Finally, a cluster of four normally graded silt beds that range in thickness from 10 to 2 cm exists between 143 cm and 103 cm depth. The lowest and thickest of these beds is capped by a distinctive blue-gray lamina of clay.
Soft-sediment deformation is apparent in two intervals in cores 1 and 2 (Fig. 7). The higher and thicker of these intervals lies between 330 and 290 cm depth beneath the lake surface, just below the central cluster of four normally graded silt beds mentioned previously. In core 2, the nose of a small-scale recumbent fold is preserved in this interval (Fig. 7; Supplementary Fig. 8). In core 1, this interval contains discontinuous, disrupted laminae and small-scale normal faulting. Several core properties show shifts coincident with the top of the deformed zone at 290 cm depth, which is interpreted as correlative to the boundary between seismic facies A and B (Fig. 7; Supplementary Fig. 9). Magnetic susceptibility shows a marked decrease above this level as does the ratio of incoherent to coherent X-ray scattering (a proxy for bulk density; Fortin et al., Reference Fortin, Francus, Gebhardt, Hahn, Kliem, Lise-Pronovost, Roychowdhury, Labrie and St-Onge2013), and sediment color becomes generally lighter and of redder hue. A thinner interval of soft-sediment deformation between about 485 and 470 cm depth in cores 1 and 2 does not coincide with noticeable shifts in these parameters.
The cluster of normally graded silt beds at 430 cm depth has a Bacon modeled posterior age of between 2474 and 2816 cal yr BP. The age of the interval of soft-sediment deformation between 330 and 290 cm depth is constrained by the age of plant debris incorporated into the deformed sediments at 328 cm depth (1534–1691 cal yr BP) and into a graded silt deposit that lies just above it (1414–1595 cal yr BP). The cluster of graded silt beds at 143 cm depth lies just above a layer of plant debris that dates to between 15 and 268 cal yr BP and has a Bacon modeled posterior age of between 221 and 274 cal yr BP (AD 1676–1729). The age-depth model for core 2 (Supplementary Fig. 4) indicates that rates of accumulation on the distal side of the lake have increased over time. Sediments near the base of core 2, for example, accumulated at a mean rate of about 0.7 mm/yr, whereas sediments near the top accumulated nearly 10 times more rapidly.
Sedimentology of the central coring sites
Cores 3, 5, and 8, recovered from the flat, central portion of the lake at about 70 m water depth (Fig. 2), are composed primarily of gray, clayey silt layers of several millimeters to centimeters thickness that are interpreted to record settling of sediment from suspension during periods of high river discharge. These sediments become generally siltier upward. Detailed examination of core 3 indicates, moreover, a general upward decreasing trend from moderate levels of bioturbation near the core bottom to little or no bioturbation toward the core top (Supplementary Fig. 5).
A unique, relatively coarse event bed is present at about 4.5 m depth in each of the lake center cores. In core 3, the sharply based bed is characterized by a basal, 5-cm-thick, fining-upward layer of medium to fine sand containing abundant fine woody plant debris, a central 25-cm-thick layer of silt and clay that has apparently been folded, and a 1.5-cm-thick capping layer of light gray clay (Figs. 7 and 8). This bed is interpreted as a turbidite and mass flow deposit that, based on the coarse particle sizes at its base, may have been triggered by a delta-slope failure. The capping clay layer indicates that abundant fine material was suspended as a result of this event and likely required weeks to months to settle from the water column. Fine plant debris incorporated into the base of the turbidite layer in core 3 has an age of between 300 and 452 cal yr BP, although its clearly reworked nature suggests a strong likelihood that this material has an “inbuilt age” (e.g., Gavin, Reference Gavin2001; Montgomery and Abbe, Reference Montgomery and Abbe2006).
(color online) Core photos showing evidence for a subaqueous mass failure on the slope of the Quinault River delta, including a turbidite/mass flow deposit sampled in core 3 from 70 m water depth, at the center of Lake Quinault, and a correlative scour surface preserved in core 7 from the delta slope at 50 m water depth. The overlying, heavily bioturbated bed in core 3 and correlative bed of laminated very fine sand and silt in core 7 are interpreted to mark a temporary reduction of river flow and/or the migration of the Quinault River channel across the delta plain via an avulsion event toward a more distal position with respect to the core sites following the delta-slope failure, which likely was triggered by the AD 1700 Cascadia megathrust earthquake (Q1 event).
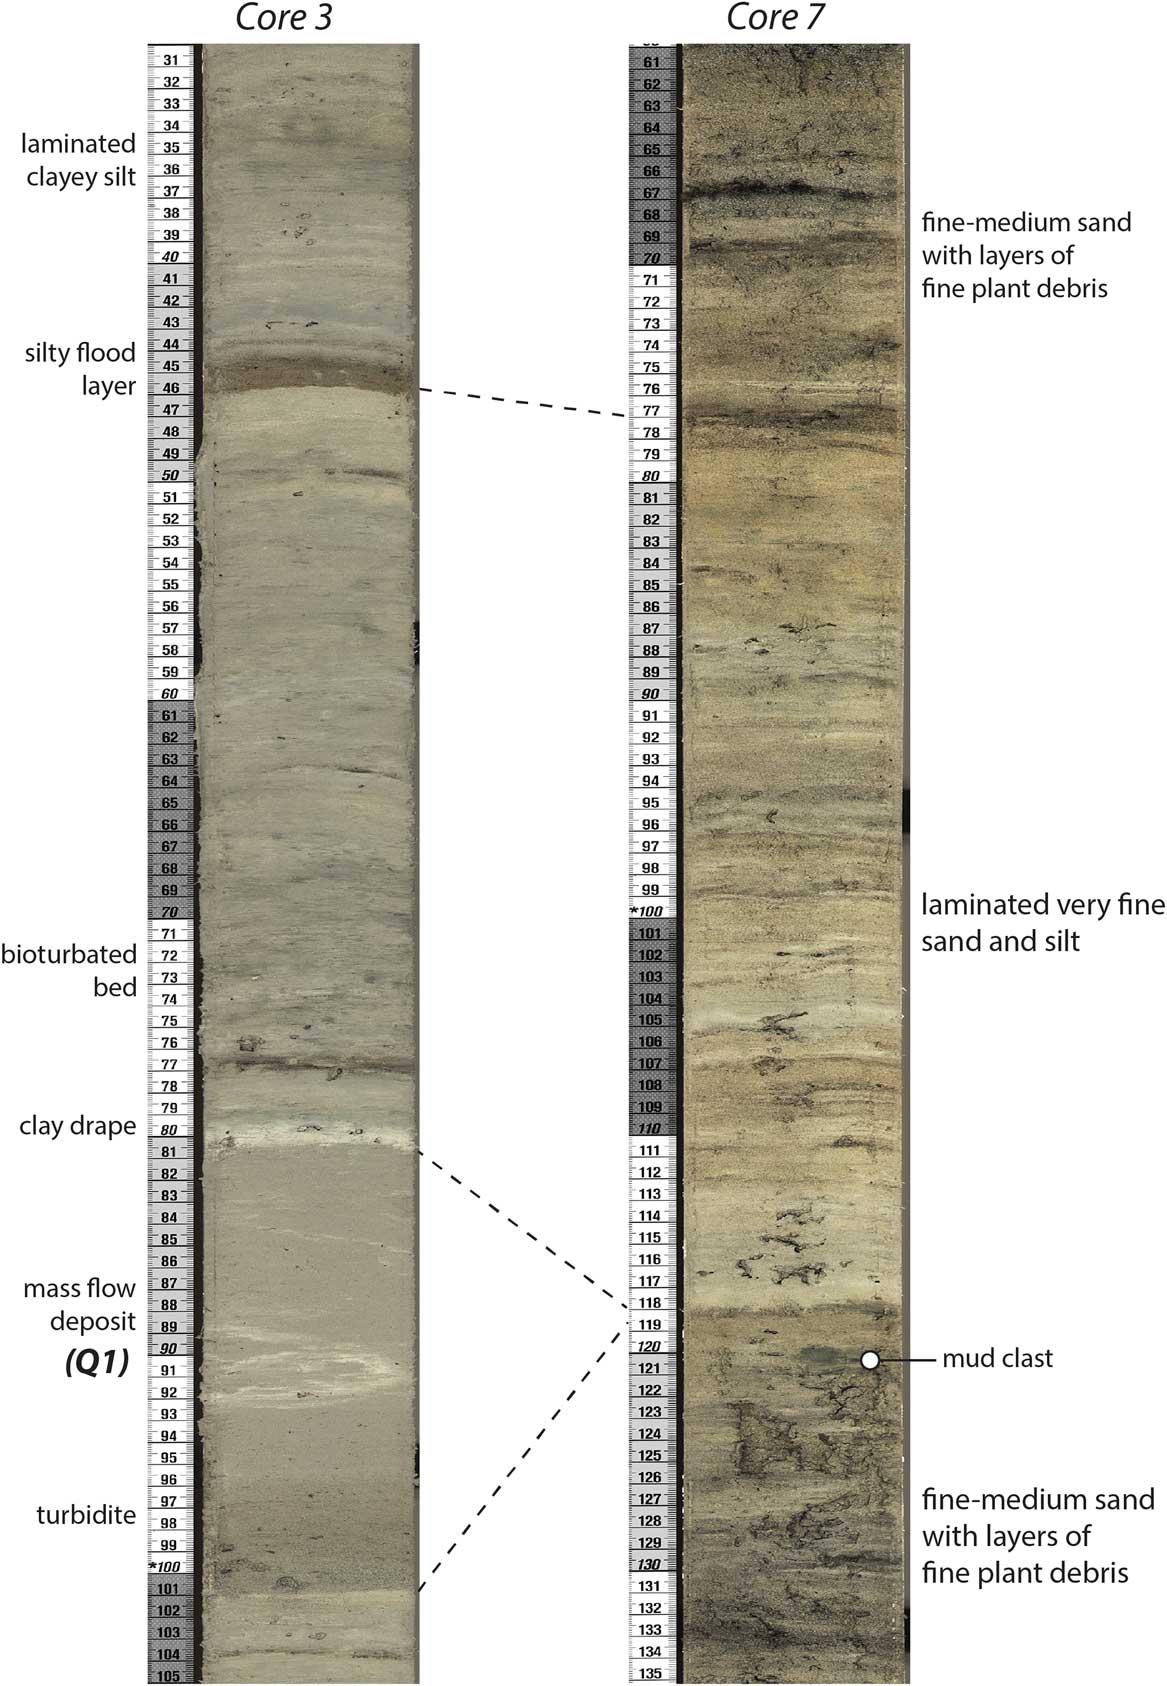
Above the clay layer and separated from it by a 2.5-cm-thick, normally graded layer of clayey silt, is a 10-cm-thick, mottled dark- to light-gray layer of clayey silt that has evidently been highly bioturbated so that physical stratification has been almost completely destroyed. This bed is unique in core 3 in its extent of bioturbation (Supplementary Fig. 5), suggesting a period of extensive biological reworking of the lake bed, possibly as the result of temporarily reduced sediment accumulation rates. Above this level, physical stratification is better preserved.
Beginning at about 4 m depth in each of the lake center cores, many 1- to 20-cm-thick, sharply based layers of brown to gray coarse silt are intercalated with the clayey silt that apparently records “background” sedimentation (Fig. 7; Supplementary Fig. 6). The coarse silt layers, which are rich in fine, woody plant debris, resemble river flood deposits described from many lakes (e.g., Arnaud et al., Reference Arnaud, Revel, Chapron, Desmet and Tribovillard2005; Chapron et al., Reference Chapron, Juvigne, Muslow, Ariztegui, Magand, Bertrand, Pino and Chapron2007; Lauterbach et al., Reference Lauterbach, Chapron, Brauer, Hüls, Gilli, Arnaud and Piccin2012) and are interpreted to have been deposited from density underflows (hyperpycnal flows). Most of these layers are normally graded, but some show inverse grading at their bases followed upward by normal grading, a pattern that has been interpreted elsewhere to reflect the rising and falling limbs of the flood hydrograph (Mulder et al., Reference Mulder, Syvitski, Migeon, Faugères and Savoye2003; St-Onge et al., Reference St-Onge, Mulder, Piper, Hillaire-Marcei and Stoner2004; Simonneau et al., Reference Simonneau, Chapron, Vanniere, Wirth, Gilli, Di Giovanni, Anselmetti, Desmet and Magny2013). In the upper 4 m of core 3, the presence of about 20 graded silt layers in what is roughly a 300- to 400-yr-long sedimentary record suggests that they are the product of floods with decadal to multidecadal frequency. The uppermost layer is 18 cm thick and lies roughly 10 cm below the sediment-water interface. It can be traced across the lake to site 2, where it thins to 3 cm (Supplementary Fig. 10). The postmodern radiocarbon age for plant debris in this uppermost flood layer indicates it was deposited after 1950. Based on average sediment accumulation rates and on calibration of its radiocarbon age to the postbomb calibration curve (Hua et al., Reference Hua, Barbetti and Rakowski2013; Table 2), this layer could be the product of a large March 1997 river flood with a calculated recurrence interval of 100 yr based on Quinault River gauging records of mean daily discharge collected since 1911 (U.S. Geological Survey, 2015a).
Sedimentology of the proximal coring sites
The sedimentology of the prodeltaic environment is illustrated by a core recovered from site 6 at 60 m water depth and two cores recovered from site 7 at about 50 m water depth (Figs. 2 and 7). The lower part of each of these cores, from about 6.5 to 4.6 m below the current lake floor, contains interstratified, centimeter-scale layers of fine to very fine sand and silt, suggesting sediment accumulation modulated by variable river discharge. This pattern is disrupted, however, by abrupt sediment fining at about 4.6 m depth. At each of the sites, a 40-cm-thick bed of laminated silt and clayey silt at that level rests on a subtle, low-angle scour surface and differs from the coarser, more thickly bedded sediments below (Figs. 7 and 8). Within a few centimeters above the laminated bed at each of the sites, stratal thickness increases again and sediments become markedly coarser than they are below it. The upper ~4.0 m of core 6 contains centimeter- to decimeter-scale beds of silty very fine to fine sand, whereas the same interval in cores 7A and 7C is composed of fine to medium sand with common layers of coarse, woody plant debris (Fig. 7; Supplementary Fig. 6).
The cores from sites 6 and 7 record the unsteady progradation of the Quinault River delta during the past 500–600 yr. The laminated silt bed present at 4.6–4.2 m depth in each of the cores, which suggests a temporary disruption of a general pattern of delta outbuilding, is correlative to a bioturbated bed in core 3 from the lake center and is similarly interpreted to mark an interval of reduced sediment delivery to the lake. Together, these beds suggest that the delta-slope failure that triggered the turbidity current and mass flow recorded in the lake center was a nondepositional or erosional event on the prodelta and was followed by temporary reduction of river flow and/or the migration of the upper Quinault River channel across the delta plain via an avulsion event toward a more distal position with respect to the core. Particle-size and bedding thickness trends suggest that accumulation of the silt bed was followed by renewed, stepwise progradation of the Quinault River delta (Fig. 7). Radiocarbon results from wood fragments and leaf debris present about 30 cm below the silt bed in core 7 indicate an age that is younger than 288 cal yr BP (Fig. 7; Table 2, sample 7A-1K-5 1-2), whereas moss and twig fragments from just below and above the silt layer in core 6 indicate an age between 429 and 16 cal yr BP.
Reconnaissance in the upper Quinault Catchment
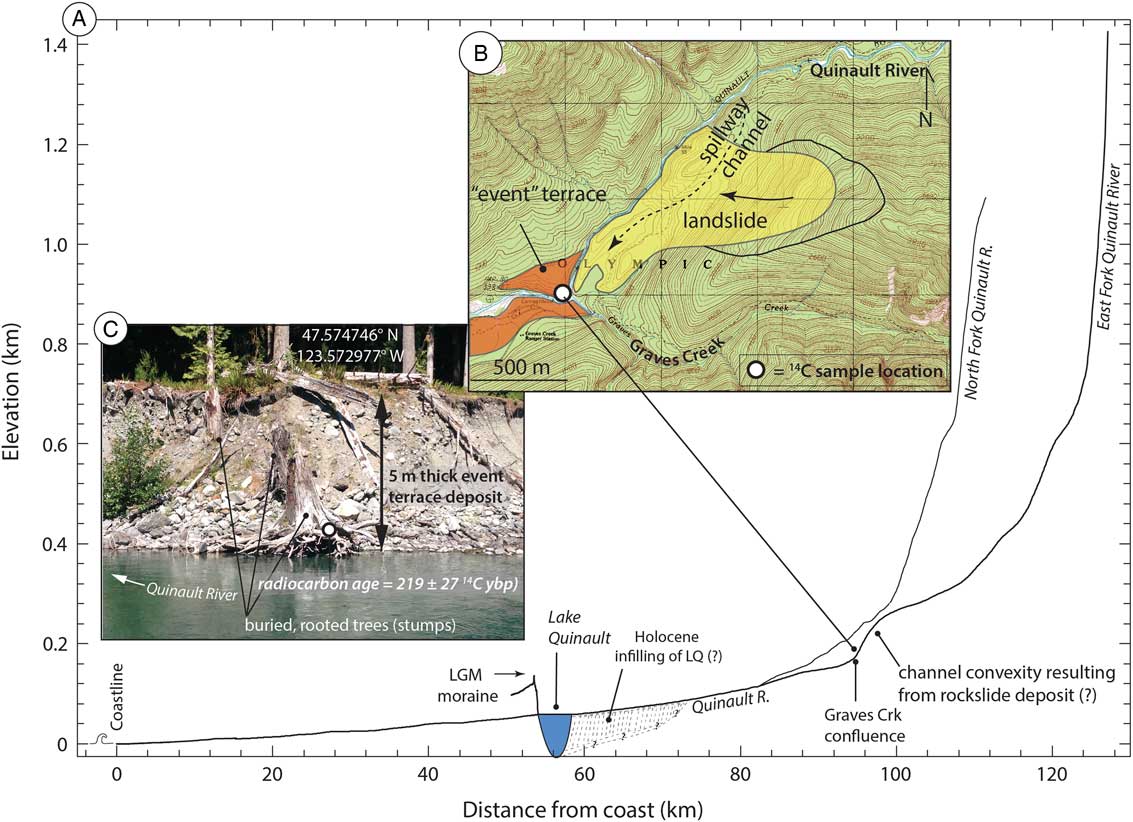
Limited radiocarbon dating of alluvial deposits 10 to 20 km upvalley from the lake is suggestive of forced sediment aggradation in the valley bottom that is penecontemporaneous with delta-slope failure and turbidite/mass deposition at the lake center. The deposits of a 5-m-high alluvial terrace are exposed in a cutbank of the Quinault River across from the Graves Creek confluence where buried conifer tree stumps in growth position are observable as they erode out of the terrace riser (Fig. 9). This “event terrace” is a mappable landform that exists on both sides of the Quinault River for hundreds of meters downstream from the Graves Creek confluence. The presence of numerous buried trees in growth position that are now exposed in a cutbank of the river argues for a relatively short period of rapid sediment accumulation. The valley topography upstream from this event terrace is suggestive of a large valley-blocking landslide, which is coincident with the only prominent convexity (pronounced steepening of the channel gradient) in the longitudinal profile of the Quinault River from the Pacific Ocean to the top of the catchment (Fig. 9A). Additional support for this interpretation is found immediately upstream of the event terrace, where a cutbank exposure of an extensive 15-m-thick, poorly sorted diamict consisting of large, angular boulders within a gravel and sand matrix both overlies and is capped by ~1-m-thick beds of well-sorted fluvial gravels. This stratigraphy suggests the interruption of normal fluvial processes by a large landslide event, after which fluvial deposition likely reinitiated until breaching of the proposed landslide dam led to rapid incision through the dam and subsequent deposition of the event terrace immediately downstream. A possible spillway channel across the landslide deposit is observable in the field and on the 1:24,000-scale topographic map as a now dry, amphitheater-headed valley (Fig. 9). The outermost growth ring beneath bark from one of the buried tree stumps in the event terrace deposit returned an age of 307–14 cal yr BP (Table 2), overlapping the age of the laminated silt bed sampled on the delta slope in cores 6 and 7.
Possible evidence for seismic triggering of fluvial aggradation in the upper Quinault River catchment. (A) Longitudinal profile of the Quinault, North Fork Quinault, and East Fork Quinault Rivers from the Pacific Ocean to their headwaters created from the U.S. Geological Survey (USGS) 10 m digital elevation model (USGS, 2015b). A pronounced convexity in the Quinault River profile is observed immediately above the Graves Creek confluence. (B) Topographic map for the confluence of the Quinault River and Graves Creek reach. The location of an “event” terrace and possible landslide deposit are identified in the orange and yellow polygons, respectively. The photograph depicted in panel C is denoted by the white circle. (C) Photograph of the 5-m-tall aggradational terrace along the north (river right) stream bank immediately across from the Graves Creek confluence. Rooted and buried Sitka spruce (Picea sitchensis) tree stumps are being exposed by recent channel migration and lateral erosion of this terrace deposit. (For interpretation of the references to color in this figure legend, the reader is referred to the web version of this article.)
DISCUSSION
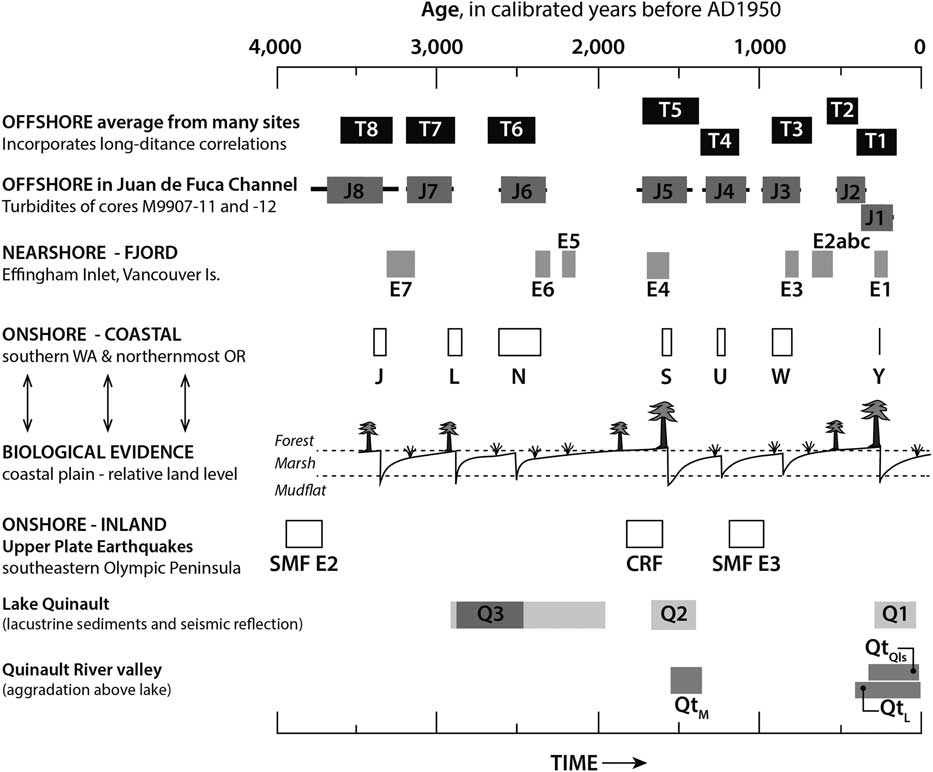
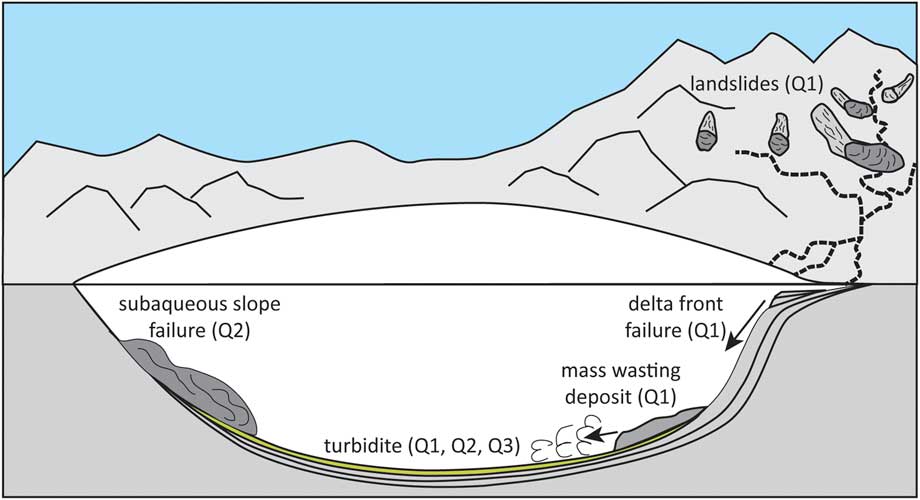
Results from Lake Quinault provide evidence for as many as three episodes of earthquake disturbance in the past 3000 yr. These events, hereafter referred to from youngest to oldest as Q1, Q2, and Q3, occurred sometime after 288, and around 1400–1700 and 2500–2800 cal yr BP, respectively (Fig. 10). As summarized in Figure 11 and discussed further in the next three sections, these events are inferred from seismic reflection, sedimentologic, and geomorphological evidence from different parts of the lake and catchment. The spatial distribution of this evidence partly reflects the limits of the data set (e.g., gas blanking of seismic signals over much of the lake, sampling of only a ca. 500-yr-long record in piston cores from the lake center and delta slope). It is apparent, however, that the spatial distribution of this evidence also reflects the variable sensitivity of the different parts of the system to earthquake shaking, as observed in other lakes (e.g., Anselmetti et al., Reference Anselmetti, Ariztegui, De Batist, Catalina Gebhardt, Haberzettl, Niessen, Ohlendorf and Zolitschka2009; Van Daele et al., Reference Van Daele, Moernaut, Doom, Boes, Fontijn, Heirman and Vandoorne2015). The Q2 event, ca. 1400–1700 cal yr BP, which left a strong imprint on the southwestern slopes of the lake, distal from the Quinault River delta, is discussed first, followed by the younger Q1 event (post–288 cal yr BP), which affected the lake center, delta, and catchment. Finally, we suggest that the third and oldest Q3 event (ca. 2500–2800 cal yr BP) is represented by the cluster of graded silt beds preserved deep in the cores from the distal lake slopes (Fig. 7; Supplementary Fig. 6).
Comparison between the timing of earthquake disturbance events in Lake Quinault (Q1–Q3) and the regional paleoseismological history consisting of both offshore and onshore data sets. Offshore data include the deep sea turbidite records both as an average of many sites along the Cascadia margin (T-events) and from just the Juan de Fuca submarine channel (J-events; Atwater and Griggs, Reference Atwater and Griggs2012; Goldfinger et al., Reference Goldfinger, Nelson, Morey, Johnson, Patton, Karabanov and Gutiérrez-Pastor2012, Reference Goldfinger, Galer, Beeson, Hamilton, Black, Romsos, Patton, Nelson, Hausmann and Morey2017), as well as from the nearshore marine fjord record of Effingham Inlet on the west coast of Vancouver Island (E-events; Enkin et al., Reference Enkin, Dallimore, Baker, Southon and Ivanochko2013). Onshore records include buried soils in coastal marsh deposits that record coseismic subsidence (events L–Y; Atwater et al., Reference Atwater, Tuttle, Schweig, Rubin, Yamaguchi and Hemphill-Haley2003) and trenching of upper-plate fault scarps along the Saddle Mountain (SMF) and Canyon River (CRF) Faults (Walsh and Logan, Reference Walsh and Logan2007a, Reference Walsh and Logan2007b; Barnett et al., Reference Barnett, Sherrod, Hughes, Kelsey, Czajkowski, Walsh, Contreras, Schermer and Carson2015). Within the upper Quinault River valley, episodes of fluvial valley-bottom aggradation is denoted as either the middle (QtM) or lower (QtL) alluvial terraces of Bountry et al. (Reference Bountry, Randle, Piety, Lyon, Abbe, Barton, Ward, Fetherston, Armstrong and Gilbertson2005), or the landslide terrace deposit (QtQls) of this study. The age range shown for the Lake Quinault Q3 event reflects the limiting minimum and maximum radiocarbon dates obtained for plant debris above and below a cluster of graded beds in core 2 (light-gray bar), and the Bacon modeled age of the basal layer in the cluster (dark gray).
(color online) Illustration summarizing the earthquake disturbance inferred in Lake Quinault and its catchment during the Q1, Q2, and Q3 events (after Van Daele et al., Reference Van Daele, Moernaut, Doom, Boes, Fontijn, Heirman and Vandoorne2015).
Response of subaqueous slopes to regional earthquakes
Lake Quinault is situated in an area that has experienced numerous large earthquakes during which shaking is expected to have been intense (Supplementary Fig. 2). Within the limits of the present data set, however, it appears that the fine-grained detrital sediments that cover most of the lake’s subaqueous slopes have been undisturbed during many of these events, including during the now well-documented AD 1700 megathrust event. Sediments deposited on the distal, western slopes of the lake, in particular, appear to have been virtually undisturbed during the past 1400–1700 yr, as represented by deposits comprising seismic facies A (Figs. 3–6). Several recent investigations at locales in the Chilean Andes, the French and Swiss Alps, and the Southern Alps of New Zealand have addressed the variable sensitivity of lakes to earthquake impacts (Howarth et al., Reference Howarth, Fitzsimons, Norris and Jacobsen2014; Moernaut et al., Reference Moernaut, Van Daele, Heirman, Fontijn, Strasser, Pino, Urrutia and De Batist2014; Van Daele et al., Reference Van Daele, Moernaut, Doom, Boes, Fontijn, Heirman and Vandoorne2015; Wilhelm et al., Reference Wilhelm, Nomade, Crouzet, Litty, Sabatier, Belle and Rolland2016). The threshold of minimum local seismic intensity to trigger mass movement deposits and related turbidites has been demonstrated to range from MMI-V (moderate) to MMI-VII (very strong) on the modified Mercalli and roughly equivalent Medvedev-Sponheuer-Karnik scales (Musson et al., Reference Musson, Grunthal and Stucchi2010; Moernaut et al., Reference Moernaut, Van Daele, Heirman, Fontijn, Strasser, Pino, Urrutia and De Batist2014), with determining factors including slope angle, sediment thickness, and sediment geotechnical properties (Wilhelm et al., Reference Wilhelm, Nomade, Crouzet, Litty, Sabatier, Belle and Rolland2016 and references therein). Slope angles on the order of 10 degrees, typical of Lake Quinault (Fig. 2), are considered favorable for generation of earthquake-triggered mass movements in lakes because they are steep enough to generate high loading forces, but shallow enough to permit sediment accumulation (Strasser et al., Reference Strasser, Hilbe and Anselmetti2011; Van Daele et al., Reference Van Daele, Moernaut, Doom, Boes, Fontijn, Heirman and Vandoorne2015; Wilhelm et al., Reference Wilhelm, Nomade, Crouzet, Litty, Sabatier, Belle and Rolland2016). On the other hand, the sediments that have accumulated on the distal slopes of Lake Quinault have properties associated with low sediment sensitivity to mass failure during earthquakes in other lakes, including high cohesive clay content, and moderate rates of accumulation (Wilhelm et al., Reference Wilhelm, Nomade, Crouzet, Litty, Sabatier, Belle and Rolland2016).
Slope failure 1400–1700 cal yr BP—the Q2 event
The ca. 1400–1700 cal yr BP (Q2) event marks an important exception to the apparent general stability of Lake Quinault’s subaqueous, nondeltaic slopes. CHIRP seismic data from the distal end of the lake provide evidence for the dramatic impacts of this event on the lake stratigraphy but unfortunately are limited to the west end of the lake by gas blanking of the acoustic signal elsewhere. Gas blanking is commonly observed near sites of fluvial sediment input to lakes where rates of organic carbon burial are high (e.g., Chapron et al., Reference Chapron, Van Rensbergen, De Batist, Beck and Henriet2004; Duck and Herbert, Reference Duck and Herbert2006; Cukur et al., Reference Cukur, Krastel, Tomonaga, Cagatay and Meydan2013), and the fact that seismic stratigraphy is only apparent on the distal side of Lake Quinault may similarly reflect that phenomenon. On many of the Lake Quinault CHIRP profiles, however, the abrupt transition from acoustic blanking to acoustic penetration depths of 15 m or more coincides with evidence for fracturing and faulting (e.g., Fig. 5A), suggesting that deformation may have facilitated localized degassing of the lake bed. Disturbance of sediments during the 1400–1700 cal yr BP event apparently allowed gas to escape from sediments on the slopes, as revealed by numerous gas chimneys interpreted from the seismic profiles. The CHIRP profiles indicate that comparable disturbance on these slopes has not occurred since and has been rare during the past. Based on estimated rates of sediment accumulation for the lower part of core 2, for example, the age of the earlier mass wasting deposit buried about 6 m beneath the lake surface in Hatchery Bay (Fig. 6) is thousands of years older.
The lack of significant disruption of sediments on the southwestern side of Lake Quinault during the AD 1700 earthquake or at any time in the past ca. 1400–1700 yr is surprising given its location in a region where large earthquakes are known to occur on the subduction interface at a frequency of roughly 500 yr (Fig. 10). What was the nature of the ca. 1400–1700 cal yr BP event and why did it cause widespread mass wasting on the southwestern margin of Lake Quinault when subsequent regional subduction zone earthquakes apparently did not? One possibility is that the deformation event at Lake Quinault was not related to an earthquake generated at the subduction interface but instead was triggered on a nearby, upper crustal fault. The Canyon River Fault (Fig. 1), 30 km southeast from Lake Quinault, is thought to have produced a surface-rupturing earthquake of estimated magnitude 6.8 to 7.5, and charcoal from an offset buried soil horizon recovered in a fault scarp trench across this fault returned a calibrated limiting maximum rupture age of 1830–1600 cal yr BP (Walsh and Logan, Reference Walsh and Logan2007a, Reference Walsh and Logan2007b). It is possible that seismic ground accelerations at Lake Quinault were greater during this shallow, local hypocenter event than during subduction earthquakes. Similar events may have caused mass failures on the lake’s subaqueous slopes with return intervals of several thousands of years as suggested by seismic reflection imagery (Figs. 5 and 6).
Alternatively, it is possible that the mass wasting event ca. 1400–1700 cal yr BP was in fact triggered by a great subduction earthquake during which shaking was particularly strong at Lake Quinault and/or site conditions rendered the sediments on the lake’s southwestern margin particularly prone to failure. Evidence for a Cascadia earthquake around 1540–1610 cal yr BP is recognized at Grays Harbor, Willapa Bay, and the Columbia River estuary (the buried shoreline marsh “S” event; Atwater et al., Reference Atwater, Tuttle, Schweig, Rubin, Yamaguchi and Hemphill-Haley2003), where it resulted in an unusual amount of coseismic subsidence (Shennan et al., Reference Shennan, Long, Rutherford, Green, Innes, Lloyd, Zong and Walker1996; Atwater et al., Reference Atwater, Tuttle, Schweig, Rubin, Yamaguchi and Hemphill-Haley2003; Fig. 10). The southern Washington buried soil “S” event has been correlated to coastal, fjord, and deep-sea sites along the entire Cascadia margin (Blais-Stevens et al., Reference Blais-Stevens, Rogers and Clague2011; Goldfinger et al., Reference Goldfinger, Nelson, Morey, Johnson, Patton, Karabanov and Gutiérrez-Pastor2012; Enkin et al., Reference Enkin, Dallimore, Baker, Southon and Ivanochko2013; Hutchinson and Clague, Reference Hutchinson and Clague2017) and may demark a single very long rupture of the subduction thrust or a swift series of two or more shorter ruptures separated by a few decades. Nelson et al. (Reference Nelson, Kelsey and Witter2006) summarized evidence for coastal subsidence and tsunamis during this period at eight coastal sites from British Columbia to northern California, suggesting rupture over much of the plate boundary and generation of a magnitude 9 earthquake. Kelsey et al. (Reference Kelsey, Nelson, Hemphill-Haley and Witter2005) and Nelson et al. (Reference Nelson, Kelsey and Witter2006) conclude that there is evidence for two unusually large tsunamis a few decades apart about 1600–1700 cal yr BP, and that they are the highest tsunamis recorded in the past 2000 yr both at Bradley Lake, Oregon, and Lagoon Creek, northern California. They also noted that the ca. 1600 cal yr BP earthquake(s) followed the longest interseismic interval (800–1130 yr) of the past 5000 yr (e.g., Atwater and Hemphill-Haley, Reference Atwater and Hemphill-Haley1997; Kelsey et al., Reference Kelsey, Nelson, Hemphill-Haley and Witter2005; Goldfinger et al., Reference Goldfinger, Grijalva, Burgmann, Morey, Johnson, Nelson and Gutierrez-Pastor2008, Reference Goldfinger, Nelson, Morey, Johnson, Patton, Karabanov and Gutiérrez-Pastor2012; Atwater et al., Reference Atwater, Carson, Griggs, Johnson and Salmi2014) (Fig. 10).
In Effingham Inlet in British Columbia (Fig. 1), where an 11,000-yr-long record includes 21 debris-flow deposits ascribed to seismic shaking of steep fjord walls, the roughly 1600 cal yr BP “E4” layer is the thickest deposit in the past 3000 yr, exclusive of one attributed to the M 7.2, AD 1946 crustal earthquake centered 60 km from the inlet (Enkin et al., Reference Enkin, Dallimore, Baker, Southon and Ivanochko2013). Enkin et al. (Reference Enkin, Dallimore, Baker, Southon and Ivanochko2013) noted that the thickness of such layers in Effingham Inlet might reflect a variety of factors, including the magnitude and duration of seismically induced ground shaking and the volume of sediment built up in the local environment between shaking events (see also Goldfinger et al., Reference Goldfinger, Grijalva, Burgmann, Morey, Johnson, Nelson and Gutierrez-Pastor2008, Reference Goldfinger, Nelson, Morey, Johnson, Patton, Karabanov and Gutiérrez-Pastor2012; Rong et al., Reference Rong, Jackson, Magistrale and Goldfinger2013). In Lake Quinault, it is possible that the long period of apparent seismic quiescence along the Cascadia subduction interface prior to the 1400–1700 cal yr BP event allowed the accumulation of not only a relatively thick layer of undisturbed sediment, but also interstitial biogenic gas on the lake’s southwestern slopes, making them especially prone to failure through the buildup of gas pore pressure and the concomitant decreases in the sediment coefficient of friction (e.g., Sultan et al., Reference Sultan, Cochonat, Canals, Cattaneo, Dennielou, Haflidason and Laberg2004).
Delta-slope failure during the AD 1700 Cascadia earthquake—the Q1 event
Cores from the proximal and central part of Lake Quinault provide clues that the slopes of the Quinault River delta and upper Quinault River catchment may have been more sensitive recorders of seismicity than were the lake’s distal subaqueous slopes. Although delta front failures can occur in lakes in the absence of earthquake triggers (e.g., Girardclos et al., Reference Girardclos, Schmidt, Sturm, Ariztegui, Pugin and Anselmetti2007), the timing of the only such failure recorded in the 500-yr-long history sampled in proximal-central Lake Quinault cores brackets that of the well-documented AD 1700 Cascadia megathrust event (Atwater et al., Reference Atwater, Musumi-Rokkaku, Satake, Tsuji, Ueda and Yamaguchi2005) and as such seems to be more than fortuitous. In their study of 17 Chilean lakes, Van Daele et al. (Reference Van Daele, Moernaut, Doom, Boes, Fontijn, Heirman and Vandoorne2015) documented a similar sensitivity of deltas to failure during the M 9.5 1960 and M 8.8 2010 earthquakes in south-central Chile.
In Lake Quinault, moreover, the suite of deposits associated with the mass flow and turbidite attributed to delta-slope failure points to a hillslope-fluvial-lake system response to an earthquake similar to that observed in the aftermath of recent earthquakes in mountainous regions of Taiwan and China (e.g., Dadson et al., Reference Dadson, Hovius, Chen, Dade, Lin, Hsu and Lin2004; Hovius et al., Reference Hovius, Meunier, Lin, Hongey, Chen, Dadson, Horng and Lines2011; Fan et al., Reference Fan, Van Wester, Korup, Gorum, Xu, Dai, Huang and Wang2012; Wang et al., Reference Wang, Jin, Hilton, Zhang, Densmore, Gen and West2015). Mass wasting on the delta was followed by a temporary fining and slowing of sediment accumulation not only on the prodelta slope (laminated silt bed in cores 6 and 7; Figs. 7 and 8), but also at the lake center (bioturbated silt bed in core 3; Figs. 7 and 8; Supplementary Fig. 4). The lateral extent of these impacts suggests that they are not simply a product of migration of the incoming river channel to the lake away from the core sites, but rather resulted from a decrease in sediment delivery as a consequence of partial fluvial channel blockage, perhaps represented by deposits still preserved in the upper Quinault River catchment (Fig. 9). Based on average sediment accumulation rates of roughly 0.9 cm/yr for the lower 4 m of core 7 (Table 2), this blockage may have persisted for several decades.
Within a few centimeters above the laminated and bioturbated silt beds recording these impacts, however, sediments at both the delta slope and lake center site coarsen, and flood layers become increasingly common (Fig. 7). These trends are suggestive of delta progradation in the years following earthquake disturbance. An increase in sediment accumulation rates sometime after about 200–300 cal yr BP apparent in the age-depth model for core 2 (Supplementary Fig. 3) is consistent with this scenario, but the data do not allow us to say whether this occurred in response to the AD 1700 earthquake or was perhaps related to later, anthropogenic impacts within the catchment above the lake. The floodplain of the upper Quinault River, between the lake and the confluence of the main stem with the North Fork Quinault River, was logged in the early 1900s, and large woody debris was removed. These activities may have led to increased bank erosion (Bountry et al., Reference Bountry, Randle, Piety, Lyon, Abbe, Barton, Ward, Fetherston, Armstrong and Gilbertson2005) and could account for some or all of the increased sediment accumulation rates observed in the lake during the past few centuries.
Lacustrine records of upstream earthquake effects during the Q1, Q2, and Q3 events
Upstream effects of the 1700 Cascadia earthquake and earlier events may have been transformed into stratigraphic records in Lake Quinault. It is evident that relatively few hyperpycnal flows in the past ca. 5000 yr have been sufficient to carry enough sediment to the distal side of the lake to generate graded layers in excess of a few centimeters thickness. The putative AD 1997 flood layer (recurrence interval = 100 yr), for example, thins from a maximum of 18 cm at site 3 to only 3 cm at site 2 (Fig. 7; Supplementary Fig. 10). The cluster of four 10- to 2-cm-thick graded silt layers between 143 and 103 cm depth in cores 1 and 2, which lies just above a layer of leaf debris with a Bacon modeled age of 221–274 cal yr BP (AD 1676–1729), is reasonably interpreted to represent a series of storms that occurred in the decades following the AD 1700 (Q1) event, as the apparent stream blockage was removed, sediment was flushed from the fluvial system, and the delta prograded forward.
The 5- to 7-cm-thick graded silt layers that are preserved at greater depth in the lake bed at sites 1 and 2, which accumulated when the river delta was farther to the east than its present location, suggest that earlier earthquakes may similarly have modulated sediment supply and delta progradation in Lake Quinault. The clustering of these thicker beds into groups of three to four layers that generally thin and fine upward is intriguing. The fine clay drapes that are best developed on the lowermost and thickest bed in each cluster indicate that the individual beds were not the products of pulsation of one hyperpycnal flow. Instead, the slow settling velocity of this fine material requires that each bed was deposited during a separate event followed by a period of quiescence. These characteristics suggest that each cluster represents a protracted response of the sedimentary system to an episode of sediment input, perhaps triggered by widespread landsliding in the upper Quinault River catchment in the months to years following the event.
Annual to decadal responses of fluvial systems have been observed following recent earthquakes as sediment introduced by mass wasting to the channel network is mobilized and transported during periods of high flow (e.g., Dadson et al., Reference Dadson, Hovius, Chen, Dade, Lin, Hsu and Lin2004; Hovius et al., Reference Hovius, Meunier, Lin, Hongey, Chen, Dadson, Horng and Lines2011; Fan et al., Reference Fan, Van Wester, Korup, Gorum, Xu, Dai, Huang and Wang2012; Wang et al., Reference Wang, Jin, Hilton, Zhang, Densmore, Gen and West2015). Clusters of turbidites/hyperpycnites in other lakes have similarly been interpreted to record the postearthquake response of catchments (Chapron et al., Reference Chapron, Juvigne, Muslow, Ariztegui, Magand, Bertrand, Pino and Chapron2007; Howarth et al., Reference Howarth, Fitzsimons, Norris and Jacobsen2012). In Lake Quinault, the position of the cluster of graded beds at 290 cm depth in cores 1 and 2, just above the deformed zone and capping a subaqueous landslide at site 2 attributed to an earthquake around 1400–1700 cal yr BP (the Q2 event; Fig. 7; Supplementary Fig. 8), supports the link between seismicity and subsequent “hyperpycnite” deposition.
The linkage of graded silt beds in the lake stratigraphy to mass wasting in its catchment during and following earthquakes is supported, moreover, by valley-bottom geomorphic mapping by the U.S. Bureau of Reclamation (Bountry et al., Reference Bountry, Randle, Piety, Lyon, Abbe, Barton, Ward, Fetherston, Armstrong and Gilbertson2005), which identified three prominent mid- to late Holocene alluvial terrace surfaces between Lake Quinault and the confluence of the North Fork and Quinault Rivers. Their intermediate-level terrace returned an age from detrital conifer charcoal of 1560±40 14C yr BP (1550–1360 cal yr BP) that overlaps with the timing of the Q2 event in Lake Quinault and the Cascadia subduction zone “S” event of Atwater and Hemphill-Haley (Reference Atwater and Hemphill-Haley1997) and Atwater et al. (Reference Atwater, Tuttle, Schweig, Rubin, Yamaguchi and Hemphill-Haley2003). Similarly, the lowest (youngest) terrace identified by Bountry et al. (Reference Bountry, Randle, Piety, Lyon, Abbe, Barton, Ward, Fetherston, Armstrong and Gilbertson2005) returned a limiting maximum detrital Populus charcoal radiocarbon age of to 270±40 14C yr BP (470–10 cal yr BP). Although the probability-weighted median age (340 cal yr BP) reported for the lowest terrace is older than the AD 1700 subduction zone earthquake, this is expected for detrital charcoal present in the fluvial system at the time of the earthquake. Collectively, these fluvial deposits and associated geochronology are suggestive of intervals of forced aggradation in the Quinault River system, perhaps in response to short-lived (years to decades) increases in hillslope sediment delivery to the fluvial system via earthquake-triggered mass wasting in the catchment.
Uneven response of Lake Quinault to subduction earthquakes
The three disturbance events identified in the Lake Quinault sedimentary record overlap with the timing of great Cascadia subduction earthquakes as inferred from nearby coastal marsh subsidence and deep-sea turbidites, suggesting a causal association (Fig. 10). Event Q1 appears to coincide with the AD 1700 event designated as buried marsh soil Y and marine turbidite T1 in those records, whereas event Q2 overlaps with the S (T5) event. Event Q3 is less well dated at Lake Quinault and could coincide either with the N (T6) or L (T7) events. Several other of the events identified in marsh and turbidite paleoseismic records are not identified in the Lake Quinault sediments, however. The offshore record contains eight (T1–T8) turbidite groupings suggestive of paleoseismic triggering by slip on the subduction thrust during the period of record from Lake Quinault (Fig. 10; Goldfinger et al., Reference Goldfinger, Nelson, Morey, Johnson, Patton, Karabanov and Gutiérrez-Pastor2012, Reference Goldfinger, Galer, Beeson, Hamilton, Black, Romsos, Patton, Nelson, Hausmann and Morey2017). The absence of discernable signals from some of these events may in part reflect the limitations of the present data set that includes only a 500-yr-long record from the prodelta and lake center versus a longer (ca. 5000 yr) record only from sites perched above the lake bottom, on the distal (western) slopes of the lake. On the other hand, it is notable that the Y, S, and L events, which generated the largest amount of coseismic subsidence in nearby coastal marshes over the past 3500 yr (Fig. 10), may be those that were intense enough to have preserved a signal on the distal underwater slopes of Lake Quinault.
The absence of obvious seismic disturbance in Lake Quinault from some earthquakes identified in the offshore paleoseismic record may potentially inform ongoing debate about the nature of segmentation of the Cascadia megathrust, as well as the amount and distribution of slip during specific events (e.g., Wells et al., Reference Wells, Blakely, Sugiyama, Scholl and Dinterman2003, Reference Wells, Blakely, Wech, McCrory and Michael2017; Kelsey et al., Reference Kelsey, Nelson, Hemphill-Haley and Witter2005; Nelson et al., Reference Nelson, Kelsey and Witter2006; Wang et al., Reference Wang, Engelhart, Wang, Hawkes, Horton, Nelson and Witter2013; Atwater et al., Reference Atwater, Carson, Griggs, Johnson and Salmi2014; Goldfinger et al., Reference Goldfinger, Galer, Beeson, Hamilton, Black, Romsos, Patton, Nelson, Hausmann and Morey2017; Hutchinson and Clague, Reference Hutchinson and Clague2017). The western subaqueous slopes of Lake Quinault appear to have remained undisturbed between events Q2 and Q1, including, for example, during an earthquake inferred to have occurred soon after 1000 cal yr BP. Turbidites deposited in the deep sea at that time are grouped as T3 by Goldfinger et al. (Reference Goldfinger, Nelson, Morey, Johnson, Patton, Karabanov and Gutiérrez-Pastor2012, Reference Goldfinger, Galer, Beeson, Hamilton, Black, Romsos, Patton, Nelson, Hausmann and Morey2017), and based in part on the distinctiveness of their relatively coarse particle sizes offshore northern Washington, they are correlated between cores with high confidence there. If the coarseness of turbidites is at least in part a function of earthquake size (e.g., Goldfinger et al., Reference Goldfinger, Nelson, Morey, Johnson, Patton, Karabanov and Gutiérrez-Pastor2012; Moernaut et al., Reference Moernaut, Van Daele, Heirman, Fontijn, Strasser, Pino, Urrutia and De Batist2014), slope-failure deposits and associated turbidites correlative to the offshore T3 deposits could be expected at Lake Quinault, although none are observed. According to the correlation of Goldfinger (Reference Goldfinger2011), the likely onshore coastal marsh equivalent to the T3 event from the records of southern Washington and northern Oregon is the buried soil “W”, dated to 910–800 cal BP by tree roots in a buried subsided marsh soil at the mouth of the Columbia River (Atwater and Griggs, Reference Atwater and Griggs2012; Fig. 10). Evidence in the terrestrial record for a single megathrust rupture at this time, however, is equivocal (Nelson et al., Reference Nelson, Kelsey and Witter2006; Hutchison and Clague, 2017). Subsided soils of this age are patchily distributed and locally poorly developed in coastal marshes of southwestern Washington (e.g., Shennan et al., Reference Shennan, Long, Rutherford, Green, Innes, Lloyd, Zong and Walker1996; Atwater and Hemphill-Haley, Reference Atwater and Hemphill-Haley1997). On Vancouver Island to the north, tsunami deposits in two lakes and a debris-flow deposit in Effingham Inlet overlap in age with soil W at the Columbia River estuary (Hutchinson and Clague, Reference Hutchinson and Clague2017). To the south, along the Oregon coast, tsunami deposits of overlapping age are present at some sites, but absent at others (Nelson et al., Reference Nelson, Kelsey and Witter2006). In their recent review, Hutchinson and Clague (Reference Hutchinson and Clague2017) highlight evidence from two sites on the Oregon coast for two tsunamis around this time, less than 200 yr apart (Kelsey et al., Reference Kelsey, Nelson, Hemphill-Haley and Witter2005; Minor and Peterson, Reference Minor and Peterson2016), indicating the possibility of discrete, partial margin ruptures.
If the earthquake that triggered the deposition of the T3 turbidites offshore of Washington at that time was the result of a partial megathrust rupture, it was almost certainly <M w 9. Perhaps the inland shaking intensity of the W earthquake was not of substantial duration or severity to generate disturbance to the Lake Quinault sedimentary sequence imaged in CHIRP seismic profiles (Figs. 3 and 5) or as recorded in cores 1 and 2 from the western end of the lake (Figs. 7 and 10).
CONCLUSIONS
The suitability of various lakes or parts of lakes as sensitive and continuous paleoseismological recorders has been explored by numerous investigators. Researchers have sought lakes or lake subbasins with minimal fluvial input so that turbidites resulting from seismogenic remobilization of hemipelagic sediments from subaqueous lake slopes can be readily distinguished from those related to river flooding or nonseismic failures of delta slopes (Moernaut et al., Reference Moernaut, Van Daele, Strasser, Clare, Heirman, Viel and Cardenas2015). Recent studies, moreover, have identified water-rich, noncohesive surficial diatomaceous muds as being particularly sensitive to remobilization on lake slopes during earthquakes and to produce turbidites within lakes shaken by relatively short return interval earthquake events (Moernaut et al., Reference Moernaut, Van Daele, Strasser, Clare, Heirman, Viel and Cardenas2015). The detrital, river-dominated stratigraphic record of Lake Quinault is thus perhaps not an optimal target for reconstructing a regional paleoseismic history, although the lake sits in a suitable location to record great subduction and other large earthquakes. These complications highlight the importance (as noted by numerous other workers) of building regional paleoseismic histories based on multiple archives.
A number of factors may have resulted in an uneven response of Lake Quinault to regional earthquake events, including the length of interseismic intervals. It is intriguing that the three disturbance events recognized in the lake stratigraphy appear to correspond to those subduction earthquakes during the period of record that resulted in the most coseismic subsidence in nearby coastal marshes. As such, the Lake Quinault record may provide insight relative to the ongoing debate about the segmentation of the Cascadia subduction zone and the distribution of slip during specific events. Results from this initial study of Lake Quinault, moreover, provide insight into the impacts of large earthquakes on the upland environments along the northern Cascadia margin that have to date remained minimally studied and speculative (e.g., Wegmann and Pazzaglia, Reference Wegmann and Pazzaglia2002). The Lake Quinault record indicates that these events may have had strong, decadal-scale impacts on fluvial and lake ecosystems.
ACKNOWLEDGMENTS
We are extremely grateful to the Quinault Indian Nation for providing access to Lake Quinault, and particularly to Bruce Wagner, Larry Gilbertson, and Bill Armstrong (Department of Fisheries, Quinault Indian Nation) for logistical support during the field study. Research activities in Olympic National Park were facilitated by Jerome Freilich. Chris and Tom Iversen at Lochaerie Resort were gracious hosts during our stay at the lake. Graduate students J. Davies and B. Riddell assisted with the collection of the seismic and core data from the lake, and undergraduates Corey Moore and Deanna Metevier provided laboratory assistance with particle-size analyses and pretreatments of samples for radiocarbon analyses. Improvements to an earlier version of this manuscript resulted from a review by Brian Sherrod. The present manuscript was significantly improved by the thorough reviews of Brian Atwater and Chris Goldfinger, whose efforts are gratefully acknowledged. Financial support for this study was provided by the U.S. National Science Foundation Geomorphology and Land Use Dynamics Program, EAR-1226064.
Supplementary material
To view supplementary material for this article, please visit https://doi.org/10.1017/qua.2017.96



