I. INTRODUCTION
As an important p-type semiconductor, copper sulfide (CuS) has extensively attracted ever increasing attention in the past few years due to its wide range of optical and electrical applications, such as catalysts, solar cells, optical filter, cathode materials in lithium rechargeable batteries, and superionic materials (which exhibits metallic conductivity at room temperature, but transform into superconducting at 1.6 K or fast-ion conducting at high temperature). Reference Cheng, Wang, Wang and Geng1–Reference Zhang, Hu and Tao6 In addition, CuS can be used as a new type of agent for photothermal treatment of cancer in biochemistry as well. Reference Lakshmanan, Zou, Hossu, Ma, Yang and Chen7
On the other hand, in recent years, considerable attention has been given to the environmental problems involving organic pollutants. For example, dye-containing wastewater contains a large amount of recalcitrant toxic substances, such as azo and benzol groups, which contribute to an increasing risk in the incidence of bladder cancer among humans. Reference Deng, Ge, Hu, Yao, Han and Zhao8 To dispose the contaminants in aqueous and/or gas states, especially for the removal of organic compounds, many methods have been proposed, in which the use of photocatalyst has been recognized as a promising technology. Reference Cheng, Wang, Wang and Geng1 For instance, it was reported that nanosized CuS materials could function as photocatalysts for the degradation of organic pollutants with preferable catalytic ability. Reference Cheng, Wang, Wang and Geng1,Reference Deng, Ge, Hu, Yao, Han and Zhao8–Reference Huang, Wang, Gu and Zhai10 But most of the tests on the photocatalytic activity of CuS nanostructures were carried out under UV light irradiation, although the band gap of nanosized CuS materials is only 1.27–2.22 eV, which implies that CuS nanostructures can, theoretically, assist the photocatalytic mineralization of dye molecules under visible light. Reference Deng, Ge, Hu, Yao, Han and Zhao8,Reference Basu, Sinha, Pradhan, Sarkar, Negishi, Govind and Pal11 Therefore, in the past few years, much attention has been paid on investigating the photocatalytic activity of various CuS nanomaterials under visible light, because photocatalysts that can utilize natural light (containing only 4% ultraviolet light) instead of UV light obviously show more advantages in environmental protection and energy conservation. Until now, several literatures have reported that CuS nanostructures synthesized by solvent-based approaches can exhibit excellent photocatalytic activity on methylene blue (MB) under sunlight but with the assistance of hydrogen peroxide (H2O2) Reference Tanveer, Cao, Ali, Aslam, Idrees, Khan, But, Tahir and Mahmood12–Reference Yang, Song, Teng and Xia15 and enhanced degradation of nitrobenzene and 4-nitrophenol under visible light irradiation. Reference Saranya, Ramachandran, Samuel, Jeong and Grace16
Moreover, it is well known that the size and morphology of photocatalysts will dramatically influence their performance to decompose or destroy the organic pollutants because of their different specific surface areas and even active structures. Reference Cheng, Wang, Wang and Geng1,Reference Deng, Ge, Hu, Yao, Han and Zhao8–Reference Huang, Wang, Gu and Zhai10 Therefore, obtaining new structures of CuS nanomaterials with a high specific surface area via a relatively simple route and developing morphology-controlled preparation methodologies are an ever-lasting goal in materials chemistry and evoke great interest there. To date, much attempt has been focused on the fabrication of various forms of nanosized CuS materials, such as hollow spheres, Reference Huang, Xiao, Chen and Wang2,Reference He, Yu and Zhao5 nanorods, Reference Larsen, Sigman and Ghezelbash17,Reference Mao, Dong, Kurth and Mohwald18 nanotubes, Reference Tan, Zhu, Lu, Xue, Bao, Liu, Fei and Zhao19,Reference Lu, Gao and Zhao20 nanowires, Reference Chen, Deng, Xu, Wang, Wen, Yang, Yang, Wang and Ge21,Reference Wang and Yang22 flower-like structures, Reference Ji, Cao, Feng, Chang, Ma, Liu and Zheng23 and nanowalls. Reference Feng, Li, Liu, Li, Cui, Wang, Jiang, Liu and Yuan3 And various methods such as hydrothermal or solvothermal methods, Reference Cheng, Wang, Wang and Geng1,Reference Zou, Zhang, Zhang, Zhao and Huang24 template-assisted growth, Reference Lu, Zhao, Chen and Xie25 and microwave irradiation Reference Liao, Chen, Xu, Yang and Zhu26 have been reported for the preparation of different morphologies of CuS nanomaterials. However, all these methods are normally of complicated and difficult operational processes. On the other hand, low-temperature chemical vapor deposition (LTCVD) is a simple, controllable, flexible, and reproducible method, by which one can synthesize metal oxide nanostructures with good crystallization. And Feng et al. Reference Feng, Li, Liu, Li, Cui, Wang, Jiang, Liu and Yuan3 even prepared CuS nanowalls by evaporating S vapor on a copper substrate and investigated their field emission properties. Inspired by their work, we performed a systematical investigation on the effects of preparation parameters on the morphology of CuS nanostructures. Surprisingly, many kinds of novel nanostructures (including the CuS nanoneedles, nanowalls and nanosheet nano-networks presented in this work) could be fabricated simply by adjusting the reaction conditions such as the temperature and flow rate of argon gas. And the influence of nanomaterial morphology on the photocatalysis activity under UV and visible light on the degradation of the model compounds rhodamine B (RhB) and MB in aqueous phase were systematically investigated.
II. EXPERIMENTAL PROCEDURE
A. Materials preparation
The CuS nano-network samples were prepared by using an experimental vacuum, horizontal double-zone tube furnace system. In the tube, the temperature decreases gradually along the downstream, giving two temperature (high temperature, HT; low temperature, LT) regions, which can effectively control the temperature gradient in the tube and thus the growth temperature of the samples on the substrates. In a typical process, sulfur powder as the evaporation source and copper foil (about 1 cm2 with a thickness of 0.01 mm) as the substrate were loaded separately in a quartz tube which was inserted into the furnace tube. For each processing test, 0.5 g commercially bought reagent grade S powder was placed at the center of HT zone of the furnace, while a copper foil was located at the center of LT zone, nearly 20 cm apart from the S powder on the downstream of the furnace. Before heating, the quartz tube was evacuated and flushed repeatedly with Ar gas for several times so as to eliminate the remnant gases in the tube. Then under a constant gas flow of 100 sccm, the HT zone of the furnace was heated up to 300 °C, while the LT zone was kept at 150, 170, and 200 °C for the growth of CuS nanostructures and held there for 1 h. After that, the furnace was cooled naturally to room temperature simply by shutting down the heating system of the furnace. Finally, black film-like products could be found on the surface of the copper foil. In another group of tests to explore the influence of Ar gas flow rate, the temperature of LT zone was fixed at 170 °C, but the gas flow was controlled at 10, 100, and 200 sccm, while all the other experimental parameters were kept unchanged.
B. Materials characterization
The phase composition of the as-prepared products was identified via grazing incidence x-ray diffraction (XRD, D/max-RB, Rigaku Corp., Tokyo, Japan; Cu Kα radiation, and λ = 1.5418 Å) in a continuous scanning mode with a rate of 6°/min and an incidence angle of 1° of the x-ray. The morphology and microstructure were examined by field emission scanning electron microscopy (FE-SEM, S4800, Hitachi, Tokyo, Japan) and transmission electron microscopy (TEM, Tecnai G2 F20 U-TWIN, FEI Company, Hillsboro, Oregon). The chemical composition was measured by an energy dispersive x-ray (EDX) spectroscope attached to the SEM, and an x-ray photoelectron spectroscope (XPS, Thermo escalab 250Xi, ThermoFisher Scientific, Waltham, Massachusetts; non-monochromated Mg Kα radiation, photon energy 1253.6 eV) in which the spectrum was calibrated with the binding energy of C1s line (285 eV). The diffuse reflectance UV–vis spectra of the solid products were recorded on a Cary 5000 UV–vis spectrometer (Varian, Salt Lake City, Utah) using BaSO4 as the reference and converted to absorbance spectra by the Kubelka–Munk method.
C. Evaluation on photocatalytic activity
The photocatalytic activity of the products was evaluated by decomposing the model compounds RhB and MB in aqueous media under ultraviolet and visible irradiations with the as-prepared products as catalysts. Typically, for the test under ultraviolet irradiation, 20 mg of each photocatalyst was dispersed in 50 mL of RhB solution with a concentration of 5 mg/L. During the catalytic degradation, under continuous magnetic stirring, the reaction mixture was kept in the dark for 30 min to reach the adsorption–desorption equilibrium, and then the ultraviolet irradiation was executed by a 500 W mercury lamp with an intensity on the mixture surface of 40 mW/cm2. But for the test under visible irradiation, MB solution with the initial concentration of 5 mg/L was used, and the irradiation was carried out by a 500-W xenon lamp, from which the wave length of the resultant light was approximately 280–790 nm, while all the other conditions were kept as those in the test under ultraviolet irradiation. Throughout the degradation process of the organic dye RhB or MB, after every 15 min reaction, 2–3 mL supernatant sample was collected from the reaction mixture and the dispersed catalyst was removed by a centrifuge. Then the resultant clear solution was analyzed by UV/vis spectroscopy (SP-752, Shanghai Spectrum Instruments Co., Shanghai, China) at the wave length of 552 nm for RhB or 664 nm for MB, at which they present the maximum absorption, respectively. Because the absorbance of the dye depends linearly on its concentration according to the Lambert–Beer law, thus the measured concentration of the dyes in the clear solution can represent that of the organic contaminants without photocatalytic degradation. After the analysis, the clear solution with the sediment during centrifuging was poured back into the reaction mixture.
III. RESULTS AND DISCUSSION
A. Composition and structure of CuS nano-networks
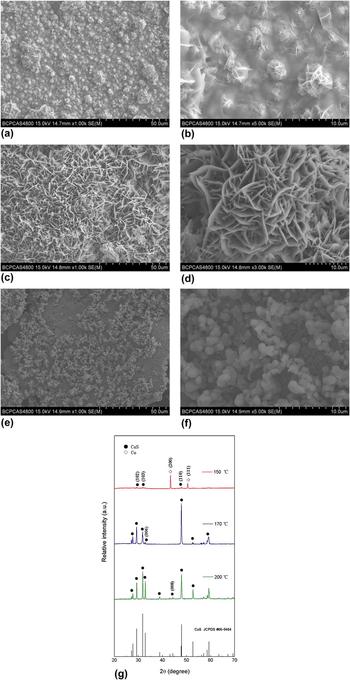
During the LTCVD growth of the present CuS nano-networks, after systematical investigation, it was found that both the growth temperature and Ar gas flow rate play key roles in controlling their morphologies. Figures 1(a)–1(f) show the FESEM images of the obtained samples grown at a temperature of 150, 170, and 200 °C under a fixed gas flow of 100 sccm. As seen from Fig. 1(a), many small islands with a diameter of 2–10 µm were formed on the Cu foil at the growth temperature of 150 °C. And the higher magnification SEM image as shown in Fig. 1(b) reveals that the small islands were composed of some nanoflakes with a thickness of 20–50 nm, which were well connected to form a network. At the growth temperature of 170 °C, however, a large scale of extended network connected by nanowalls (nano-network) was successfully fabricated as shown in Fig. 1(c). And most of the nanowalls were perpendicular to the surface of copper foil and well connected with each other, as shown in the higher magnification SEM image [Fig. 1(d)]. The thickness of the nanowalls was 100–200 nm with a length of 2–10 µm, much thicker and more uniform compared with that of the samples grown at 150 °C. In addition, at the growth temperature of 200 °C, only particles with diameters of several hundred nanometers were obtained [see Figs. 1(e) and 1(f)].
FE-SEM images in different magnifications of the CuS nano-networks synthesized at (a, b) 150, (c, d) 170, and (e, f) 200 °C under a constant gas flow of 100 sccm and (g) their corresponding XRD patterns.

The identity of the samples prepared at different temperatures was established by XRD patterns. As seen from Fig. 1(g), except for the signal of Cu metal from the substrate, all the remnant diffraction peaks of the sample prepared at 150 °C can be assigned to the hexagonal CuS crystalline phase (JCPDS card no 06-0464, a = 3.796 Å and c = 16.344 Å). Additionally, the peak intensity of the CuS phase in the present sample is relatively low when compared with those of the other samples prepared at higher temperatures. These results mean that at 150 °C, the Cu foil has been partially converted into CuS, which is in accordance with the microstructure observation as shown in Figs. 1(a) and 1(b). However, the diffraction peaks of the samples prepared at 170 and 200 °C can completely be indexed to the hexagonal CuS crystalline phase. No secondary phase was detected in the XRD detection limit, indicating that both products are of single phase with very high purity. And their intense and sharp diffraction peaks suggest that the as-prepared products have a high degree of crystallization. In particular, the SEM-EDX spectrum of the samples prepared at 170 °C (see Fig. S1 in the Supplementary Materials) indicates that the obtained nano-networks are composed of Cu and S with an atomic ratio of 53:47, which is very close to the stoichiometric CuS if the experimental error is taken into account. In addition, the strongest peak for the sample prepared at 170 °C corresponds to the (110) plane of CuS crystals, while that of the standard CuS powder is (103). This relative intensity deviation in XRD patterns indicates that the present CuS crystals have significantly preferential orientation in the direction of
 $\left\{ {11\bar 20} \right\}$
facets, confirming that the prepared samples is 2D nanostructures. The typical high resolution transmission electron microscopy (HRTEM) and corresponding selected area electron diffraction (SAED) pattern of the samples prepared at 170 °C as shown in Fig. S2 also reveal that the nano-networks are of single crystal, in which the lattice fringes in HRTEM image [see Fig. S2(a)] are clearly observed with a distance of about 0.32 nm, corresponding to the inter space of
 $\left( {10\bar 10} \right)$
planes of CuS crystals, and the hexagonal symmetry spots in the SAED pattern [Fig. S2(b)] indicate that the CuS nano-networks are single-crystalline and the electron beam was incident in the [0001] direction of the hexagonal structure. The diffraction spots with a lattice spacing of 0.32 nm correspond to the
 $\left\{ {10\bar 10} \right\}$
Bragg reflection of hexagonal CuS crystals. In a word, the XRD, HRTEM, and SAED results are all well consistent with each other, confirming that the prepared samples at 170 °C is 2D CuS nanostructures. Besides, the XRD pattern of the sample prepared at 200 °C matches well with the standard pattern of CuS powder, implying that such CuS crystal grew without preferential orientation, which is in accordance with its particle feature as shown in Figs. 1(e) and 1(f).
From the above discussion, it can be summarized that when the growth temperature is too low (e.g., 150 °C in this study), the energy supplied for the system is possibly so less that the CuS crystals may be difficult to form and grow; whereas, when the temperature is too high (here higher than 200 °C), the chemical reaction between S gas and Cu foil is so violent that the CuS crystals will grow too quickly into particles; and it is about 170 °C that fits for the growth of the present CuS nano-networks. Therefore, further investigations are required to elaborate on the growth mechanism of the nano-networks.
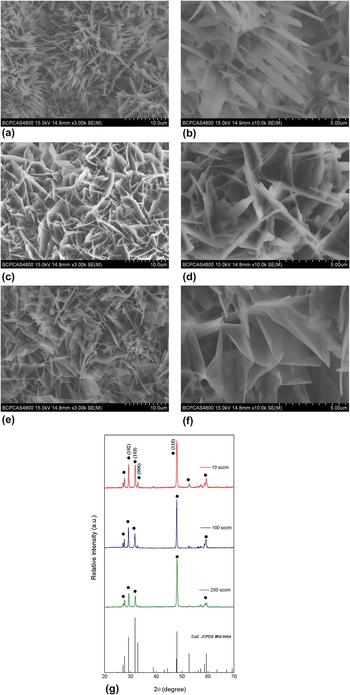
To study the effect of Ar gas flow rate on the morphology of the products, the fabrication was carried out at a fixed growth temperature of 170 °C but with varied gas flow rate from 10 to 200 sccm. As seen from Figs. 2(a)–2(f), various nano-networks with different morphologies were successfully grown on the Cu foils on large scale under the designed conditions. And all the obtained products were of relatively high density. Specifically, under the gas flow rate of 10 sccm, there are many nanoneedles protruding from the nano-networks. Some of the nanoneedles were more like nanoswords with an average length of about 5 µm and thickness of 20–40 nm, while the width ranges from 500 to 800 nm with uniform size throughout their length. Under the gas flow rate of 100 sccm, numerous nanoflakes were vertically grown, looking like nanowalls. The nanowalls were well connected with each other, constructing the nano-networks. With increasing gas flow rate, the nanowalls were converted into nanosheets with a thickness of 20–40 nm under the flow rate of 200 sccm. From these results, it can be concluded that a higher gas flow rate would lead to the formation of the products from nanoneedles to nanosheets.
FE-SEM images in different magnifications of the CuS nano-networks synthesized at 170 °C under a gas flow of (a, b) 10, (c, d) 100, and (e, f) 200 sccm and (g) their corresponding XRD patterns.

The crystalline structure of the obtained samples was also identified by XRD analysis. The result is shown in Fig. 2(g), in which the intensities of all the diffraction peaks are normalized. From this figure, it can be easily seen that the strongest peak of all the samples is corresponding to the (110) plane of CuS crystal, which is different from that of the standard CuS powder (103). And the intensity ratio between (110) and (103) planes of the samples prepared under the gas flow rate of 10, 100, and 200 sccm is 2.22, 3.22, and 4, respectively. The strong intensity of the (110) peak in the sample XRD patterns indicates the preferential orientation of the nano-networks. And a higher intensity ratio of the (100) to (103) peaks implies that such CuS crystals are more likely to grow in the direction of
 $\left\{ {11\bar 20} \right\}$
facets, which would result in 2D nanostructures.
Reference Lu, Cai, Zhang, Li, Sun, Heo and Cho27
Thus, the highest intensity ratio of the (110) to (103) peaks in the sample prepared under the gas flow rate of 200 sccm was in agreement with its nanosheet structure, because it has the biggest 2D nanostructure among the three samples. On other hand, it was found from the XRD patterns that the relative diffraction peak intensity of the (006) lattice planes in the samples prepared under the gas flow rate of 100 and 200 sccm were 0.06 and 0.05, respectively, while that in the sample prepared under the gas flow rate of 10 sccm was 0.15. The particularly high intensity of the (006) peak of the sample prepared under the gas flow rate of 10 sccm indicates that the CuS nanoneedles protruding from the nano-networks [as shown in Figs. 2(a) and 2(b)] may also grow preferably along the orientation of (006),
Reference Lu, Cai, Zhang, Li, Sun, Heo and Cho27
thus finally resulting in the needle-like structure.
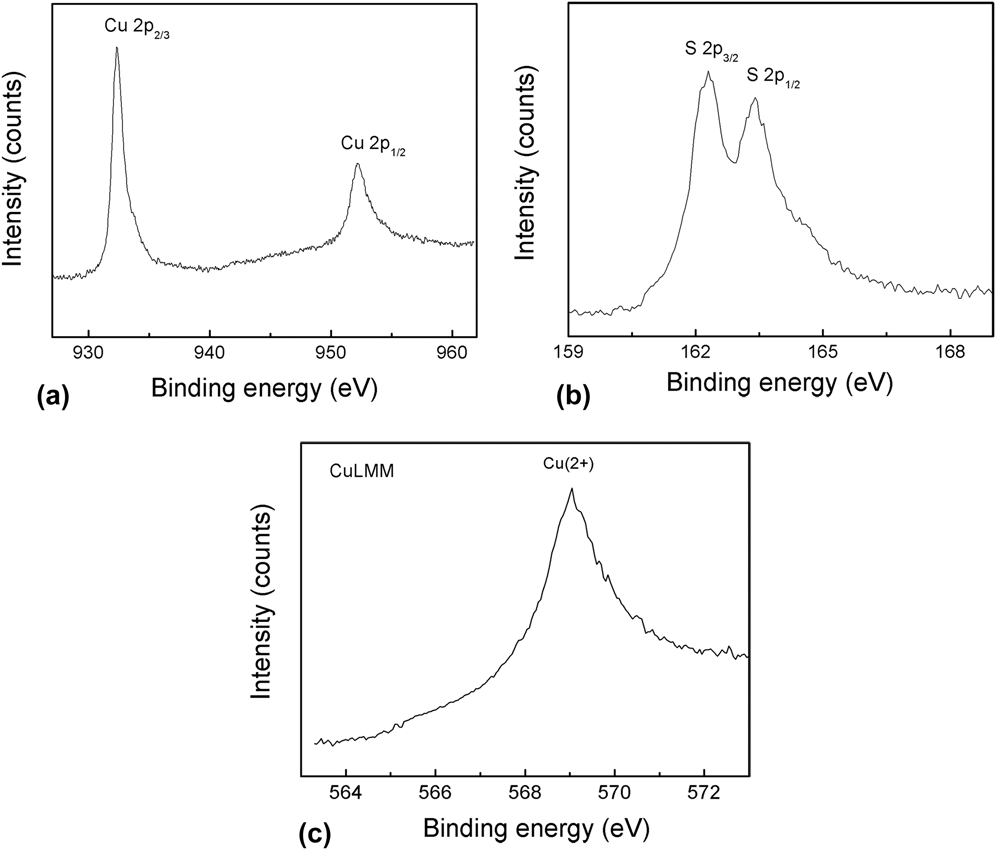
The successful preparation of the present CuS nano-networks was further confirmed by the XPS analysis as shown in Fig. 3. In Figs. 3(a) and 3(b), the signals of 2p3/2 and 2p1/2 (932.5 and 952 eV) exhibit essentially identical binding energy for Cu 2p, and the peaks at 162.5 and 163.7 eV correspond to S 2p3/2 and 2p1/2, respectively. The peak areas of Cu and S cores were also measured, which are 131,064.65 and 14,119.49, respectively. Then the peak areas were corrected by the XPS sensitivity factors of Cu and S elements, which are 5.321 and 0.666, giving an atomic ratio of Cu to S of 1:1.1, which is very close to the stoichiometry of CuS and in agreement with the EDX result. Moreover, the Cu LMM Auger peak region can provide a clear means of differentiating the oxidation states of Cu. According to a previous report, Reference Ghodselahi, Vesaghi, Shafiekhani, Baghizadeh and Lameii28 the main LMM peaks for Cu (2+), Cu (1+), and Cu (0) are located at 569.2, 570.2, and 567.8 eV, respectively. In agreement with this report, here from Fig. 3(c), it can be seen that the only Cu LMM peak for the present samples appears at 569.3 eV, further revealing that the as-prepared nano-networks were of pure CuS.
Typical XPS spectra of Cu 2p core level (a), S 2p core level (b), and Cu LMM (c) in the prepared CuS nano-networks.

B. Formation mechanism of CuS nano-networks
The formation of the present hexagonal CuS nanocrystals originates from the corrosion of Cu foil by sulfur vapor in the following reaction.
 $${\rm{Cu}}\left( {\rm{s}} \right) + {\rm{S}}\left( {\rm{g}} \right) \to {\rm{CuS}}\left( {\rm{s}} \right),\quad \,\,\,\,\quad \Delta G_{\rm{m}}^\theta = - 290.3\,{\rm{kJ\cdot}}{{\rm{mol}}^{ - 1}}\quad .$$
This chemical reaction is a spontaneous one in theory. But the CuS crystal growth may be extremely slow at room temperature like the process of rusting iron. During heating, they grow rapidly. In the present case, when the growth temperature increased from 150 to 170 °C, the crystals of CuS grew remarkably. However, a temperature higher than 200 °C would lead to samples consisting of irregular lump crystals, owing to the “over-corrosion” led by the strong chemical reaction. In such case, every growth direction of CuS nuclei was quick enough because of the higher chemical reaction rate, leading the nuclei expanding rapidly to particles. Therefore, only at an appropriate temperature (170 °C in this study), the crystal growth rate is moderate, and CuS nanostructures were grown preferentially.
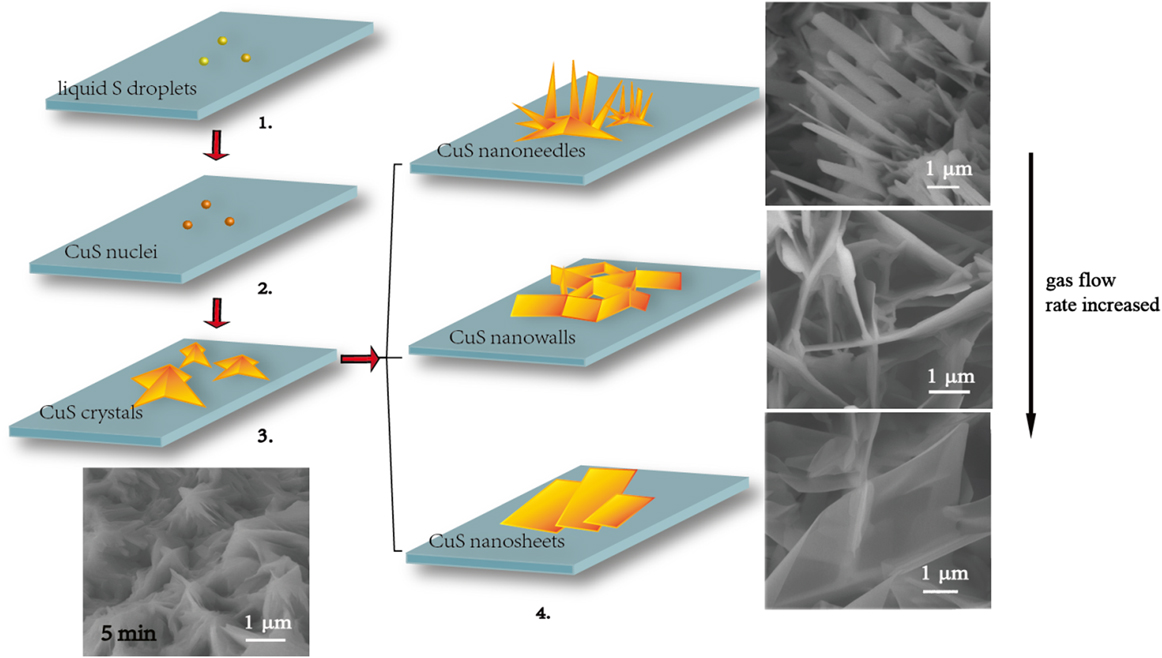
Because the growth temperatures applied in this work (150–200 °C) are higher than the eutectic point of Cu and S (115 °C) but lower than the gasification point of sulfur (240 °C), with an appropriate temperature and flow rate of argon gas, the sulfur vapor would be carried by argon gas to the surface of copper foil in a lower temperature zone to form liquid sulfur droplets, which act as a liquid medium. Thus a solid-liquid-solid (SLS) process may be the main growth mechanism of the present CuS nano-networks,
Reference Feng, Li, Liu, Li, Cui, Wang, Jiang, Liu and Yuan3
which can be illustrated schematically in Fig. 4. At the first step, the sulfur vapor was carried by Ar gas to the surface of copper foil in the lower temperature zone to form liquid sulfur droplets, where the liquid sulfur droplets acted as a liquid medium. At second step, the liquid sulfur reacted with Cu, forming CuS nuclei. In general, the crystal faces perpendicular to the fast growth direction have smaller surface area and those perpendicular to the slow growth direction thus dominate the product morphology.
Reference Wang, Li, Li, Wang and Chen29
The c/a ratio of the as-prepared hexagonal CuS crystals from XRD result is about 4.31, a value greater than that of the ideal hexagonal crystals (i.e., c/a > 1.633)
Reference Liao, Chen, Xu, Yang and Zhu26
implying that {0001} facets have a surface energy lower than
 $\left\{ {10\bar 10} \right\}$
and
 $\left\{ {11\bar 20} \right\}$
ones.
Reference Lu, Cai, Zhang, Li, Sun, Heo and Cho27
Thus, the CuS crystal nuclei will grow faster on
 $\left\{ {10\bar 10} \right\}$
and
 $\left\{ {11\bar 20} \right\}$
facets and more slowly on (0001) plane, forming small nanocrystals (step 3). The {0001} crystal surfaces with larger surface area would limit the exposure of the other higher-energy surfaces to S vapor, reducing the total energy of the nanocrystals and resulting in the formation of the observed stable 2D nanostructures (nanoneedles, nanowalls, or nanosheets) in the present study.
Reference Lu, Cai, Zhang, Li, Sun, Heo and Cho27
All these nanostructures would further grow anisotropically and might be well connected to form the extended nano-networks (step 4).
Schematic of the growth mechanism of the present CuS nano-networks.
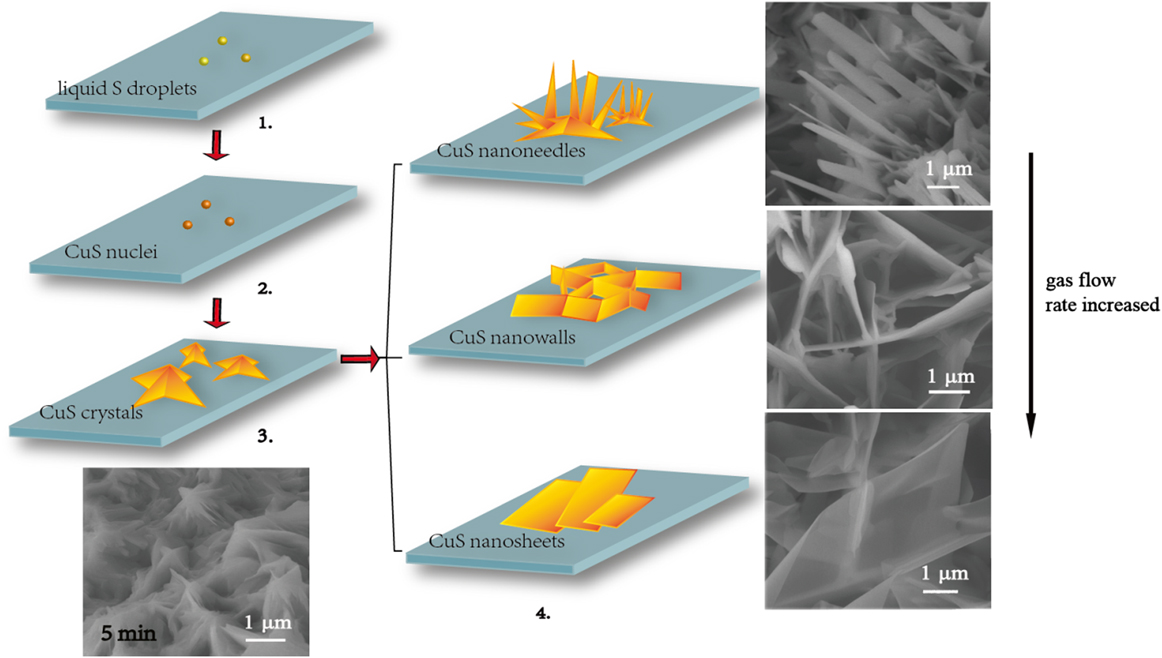
As the Ar gas flow rate increased from 10 to 200 sccm, more S vapor will be brought onto the Cu foils. A high enough S concentration would lead to high enough CuS growth rate along
 $\left\{ {10\bar 10} \right\}$
and
 $\left\{ {11\bar 20} \right\}$
facets. Thus, it will induce the CuS nanocrystals to become wider and thinner, resulting in the formation of CuS nanosheets. When the gas flow rate is low, the super saturation of CuS nuclei in the system would increase and the growth rate along
 $\left( {006} \right)$
planes may be faster than those along the other planes. Thus, under the gas flow rate of 10 sccm, CuS nanoneedles grew and formed from the bottom networks.
C. Photocatalytic activity of CuS nano-networks
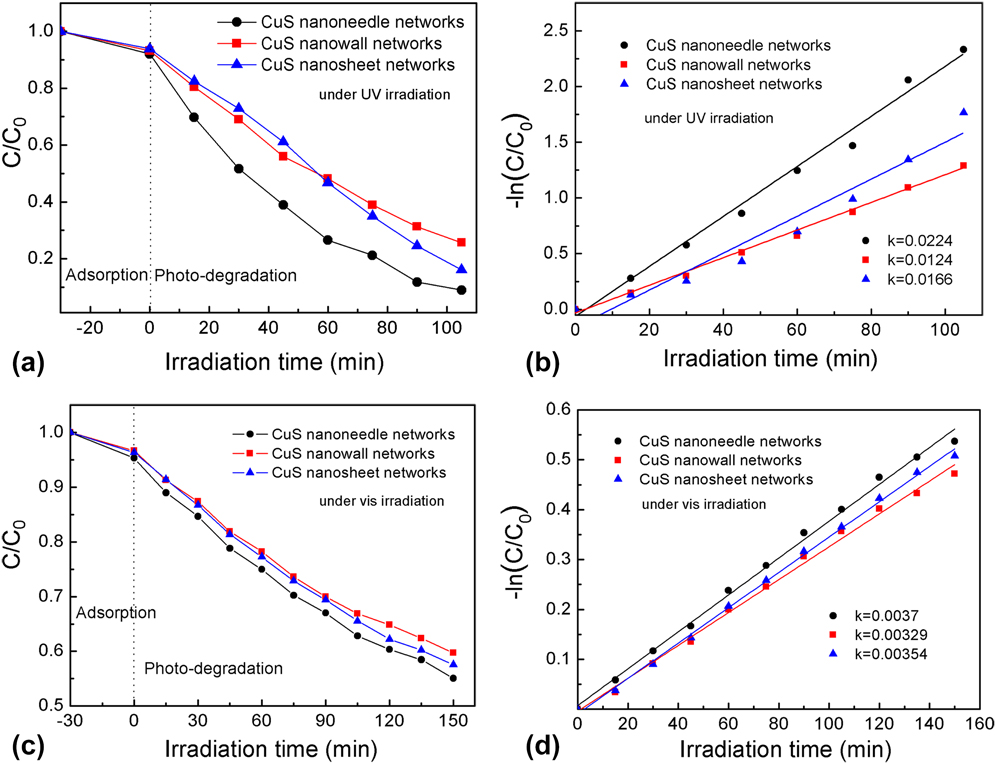
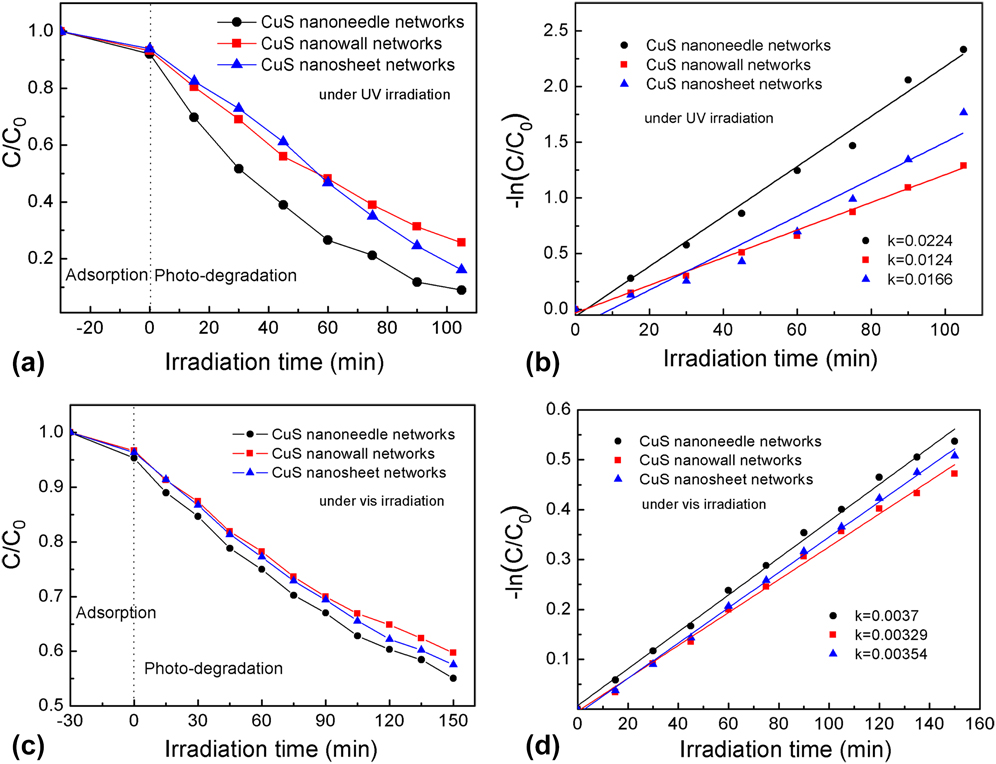
To demonstrate the photodegradation on organic contaminants of the as-prepared nano-networks with CuS nanoneedles, nanowalls, and nanosheets, their photocatalytic activities were investigated under ultraviolet or visible irradiation. Because MB is too easily degraded under ultraviolet irradiation even without any catalyst (see Fig. S3), so we choose RhB as the dye for the tests under such experimental conditions. To compare the catalytic activity of the as-prepared nano-networks with CuS nanoneedles, nanowalls, and nanosheets, the dependence of the residual RhB concentration on reaction time after photocatalysis under ultraviolet irradiation was plotted in Fig. 5(a). In the designed tests, after adsorption in the dark for 30 min, all the samples reached the adsorption–desorption equilibrium, at which the decolorization effect on RhB by the CuS nanoneedle, nanowall, and nanosheet networks were 8.0, 6.8, and 6.2 wt%, respectively. In the photodegradation stage, the absorbance to light (552 nm) of the residual dye after ultraviolet irradiation decreased dramatically with increasing time, due to the excellent photocatalytic degradation by the present nano-networks. The recorded decolorization effects by the CuS nanoneedle, nanowall, and nanosheet networks under UV irradiation for 105 min can reach 91, 75, and 84 wt%, respectively, among which the nano-networks with CuS nanoneedle networks present the best effect and those with the CuS nanowall networks perform the lowest.
(a) Decolorization effect on RhB under UV by the as-prepared CuS nano-networks with nanoneedles, nanowalls, and nanosheets and (b) their corresponding −ln(C/C 0 ) vs. time plots. (c) Decolorization effect on MB under visible light by the as-prepared CuS nano-networks with nanoneedles, nanowalls, and nanosheets and (d) their corresponding −ln(C/C 0 ) vs. time plots.
In literature, it has been already proved that the photocatalytic decomposition of RhB aqueous solution agrees with pseudo-first-order kinetics. Reference Huang, Wang, Gu and Zhai10,Reference Meng, Zhu, Choi, Park and Oh30 As a result, the kinetics can be expressed as follows:
 $$- \ln \left( {{C \mathord{\left/ {\vphantom {C {{C_0}}}} \right. \kern-\nulldelimiterspace} {{C_0}}}} \right) = kt\quad ,$$
where k is the apparent reaction rate constant, and C 0 and C are the initial and instant concentrations of RhB in the reaction solution, respectively. Figure 5(b) presents the corresponding plots of –ln(C/C 0) versus t during the irradiation from 0 to 105 min. The rate constant of the photocatalytic reactions under ultraviolet irradiation with the CuS nanoneedle, nanowall, and nanosheet networks was calculated as 0.0224, 0.0124, and 0.0166 min−1, respectively, also indicating that under ultraviolet irradiation the CuS nanoneedle networks presented the highest performance on decomposing RhB and the CuS nanowall networks performed the lowest.
When it comes to the photocatalytic activity of the as-prepared nano-networks with CuS nanoneedles, nanowalls, and nanosheets under visible irradiation, because the photodegradation of RhB in aqueous media by CuS photocatalysts is quite slow (see Fig. S3), so MB was chosen as the organic dye to compare their performances. The dependence of the residual MB concentration on reaction time after photocatalysis was plotted in Fig. 5(c). In the designed tests, after adsorption in the dark for 30 min, all the samples also reached the adsorption–desorption equilibrium, at which the decolorization effect on MB by the CuS nanoneedle, nanowall, and nanosheet networks were 4.7, 3.4, and 3.7 wt%, respectively. During the photodegradation stage, the residual MB concentration after visible irradiation decreased with the reaction time, which is similar with their performance under ultraviolet irradiation. After visible irradiation for 150 min, the prepared nano-networks with CuS nanoneedles presented the highest photocatalytic degradation on MB, in which the residual MB concentration dropped down to 55 wt%. Again, the nano-networks with CuS nanosheets showed the lower activity in decomposing MB among the three catalysts, resulting in 57 wt% residual MB in the solution after 150 min of reaction. The nano-networks with CuS nanowalls displayed the lowest activity in decomposing MB with 59 wt% MB remained in the solution. Through the corresponding plots of –ln(C/C 0) versus t as illustrated in Fig. 5(d), the rate constant k values of the photocatalytic reactions with the CuS nanoneedle, nanowall, and nanosheet networks were calculated as 0.0037, 0.00,329, and 0.00,354 min−1, respectively, implying that under visible irradiation the CuS nanoneedle networks also presented the highest performance on decomposing MB and the CuS nanowall networks performed the lowest.
In summary, in both case, the CuS nanoneedles nano-network presented better performance than the other two nanostructures, exhibiting great potential as photocatalysts in wastewater treatment.
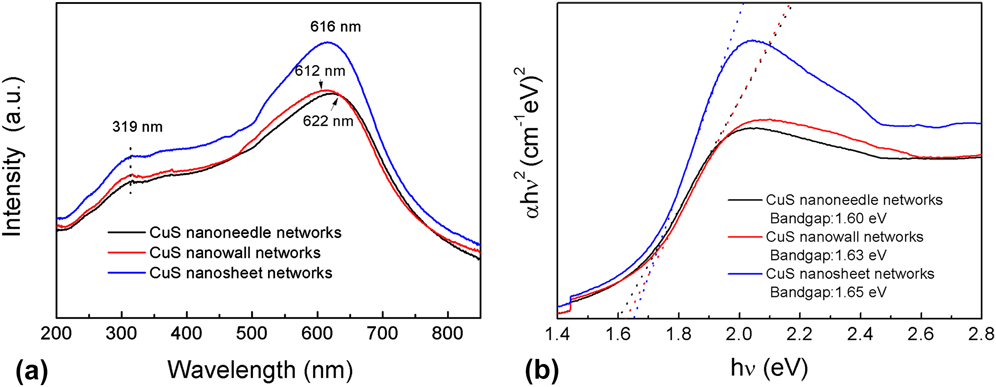
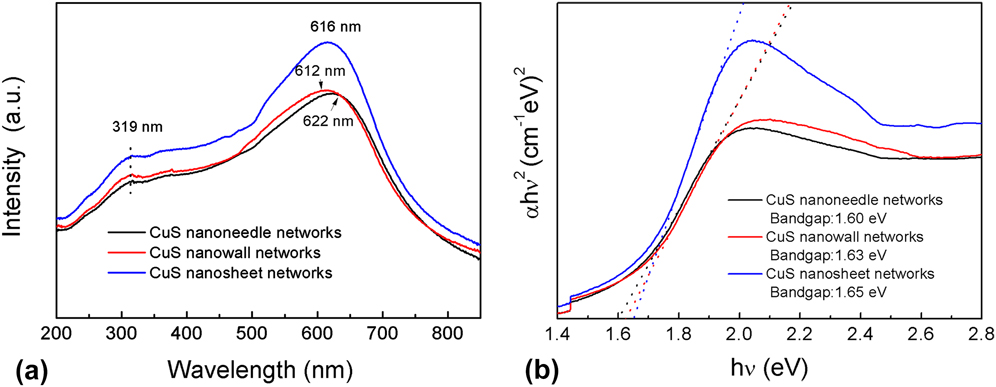
To help understand the photocatalytic properties of the prepared CuS nano-networks, their absorption was investigated by UV–vis absorption spectroscopy. The recorded UV–vis absorption spectra as shown in Fig. 6(a) reveal that the obtained CuS nano-networks present unsymmetrical hump peaks in the whole spectrum, involving in a broad peak centered at 612–622 nm in the visible region and a weak peak at about 319 nm in the UV region. This feature is the characteristic of covellite CuS. Reference Ding, Wang, Guo, Guo and Huang9 And it can be concluded that the obtained CuS nano-networks have a broad absorption in both near-UV and visible regions, corresponding to the photocatalytic activity in these regions presented above.
(a) UV–vis absorption spectra of the as-prepared CuS nano-networks and (b) the calculation diagram of their band gaps.
The band gaps of CuS networks were determined by the following equation:
 $${\left( {\alpha h\nu } \right)^2} = B\left( {h\nu - Eg} \right)\quad ,$$
in which hν is the photon energy, E g is the apparent optical band gap, B is a characteristic constant of the semiconductor, and α is the absorption coefficient. Reference Weng and Hodgson31 The indirect band gap can be determined using this equation when the straight portion of the (αhν) Reference Huang, Xiao, Chen and Wang2 against hν plot is extrapolated to intersect the energy axis at α = 0 [as shown in Fig. 6(b)]. The intercept value on the energy axis was found to be 1.60 for CuS nanoneedles, 1.63 for CuS nanowalls, and 1.65 eV for CuS nanosheets. It is known that the photocatalysis of semiconductors is an absorption process of a photon by band gap of the materials, generating electron–hole pairs in the semiconductor particles. Reference Senthilkumaar, Rajendran, Banerjee, Chini and Sengodan32 The narrower the band gap of the photocatalyst is, the more photons it can absorb. Therefore, in the present study, the nano-networks with CuS nanoneedles, which have the narrowest band gap, would present the highest photocatalytic activity among the three nano-networks. Besides, the enhanced absorbance of the CuS nanosheet networks over the CuS nanowall networks from 280 to 790 nm in the UV–vis absorption spectra [Fig. 6(a)] provides a possibility for improving the photocatalytic performance of the CuS nanosheet networks over the CuS nanowall networks.
In a word, the high photocatalytic activity of the CuS nanoneedles can be ascribed to its unique structure. The nanosize of such needles could not only reduce the radiationless recombination of electron–hole pairs, Reference Ding, Wang, Guo, Guo and Huang9 being also in favor of the photocatalysis of dyes, but also desorbed more molecules on the catalyst surface, which would have more unsaturated surface coordination sites exposed to the reaction solution. Reference Huang, Wang, Gu and Zhai10
IV. CONCLUSIONS
A simple, facile, and fast method was developed to fabricate vertically oriented CuS nano-networks with controlled morphology on the surface of a copper foil on the basis of LTCVD. The morphology of the CuS nano-networks could be changed from nanoneedles, nanowalls to nanosheets by simply adjusting the reaction temperature and flow rate of argon gas. Compositional and structural analyses revealed that all the three CuS nano-networks are single-crystalline. And their growths were possibly controlled by a SLS mechanism. The photocatalytic activities of the different shaped CuS nanostructures have been evaluated by their photodegradation on RhB (under ultraviolet irradiation) and MB (under visible irradiation). All the three CuS nano-networks have good photocatalytic degradation activity on RhB and MB, among which the CuS nanoneedle nano-networks presented the best performance due to the lowest band gap and highest specific surface area of the CuS crystals. The as-prepared CuS nanoneedle nano-networks would be promisingly excellent photocatalysts for wastewater treatment.
Supplementary Material
To view supplementary material for this article, please visit http://dx.doi.org/jmr.2015.373.
ACKNOWLEDGMENTS
The authors would like to thank the National Natural Science Foundation of China for financial support (Grant nos. 61274015, 11274052 and 51172030), Excellent Adviser Foundation in China University of Geosciences from the Fundamental Research Funds for the Central Universities, and Fund of State Key Laboratory of Information Photonics and Optical Communications (Beijing University of Posts and Telecommunications).