Obesity has emerged as a growing health problem globally and increased the risk for multiple chronic diseases, including cancers, type 2 diabetes and CVD(Reference Lauby-Secretan, Scoccianti and Loomis1–Reference Powell-Wiley, Poirier and Burke3). Compared with BMI, some adiposity measures including fat mass index (FMI) and fat-free mass index (FFMI), which could account for body composition are superior when assessing the association of adiposity with disease or mortality risk in observational studies(Reference Khan, Chong and Le4,Reference Liu, Ma and Lou5) . Technological advances have now allowed us to measure body composition and fat distribution accurately(Reference Iyengar, Arthur and Manson6,Reference Chen, Arthur and Iyengar7) . Previous studies have revealed the opposite effects of trunk fat and leg fat on the incidence and mortality of chronic disease(Reference Zong, Zhang and Yang8–Reference Zhang, Hu and Wu10). Body fat distribution is sex-specific, and the different health outcomes associated with fat distribution have been investigated among women. Specifically, upper-body fat and lower-body fat of women showed detrimental and beneficial effects on several chronic diseases, including CVD and lower-extremity arterial disease, respectively(Reference Chen, Arthur and Iyengar7,Reference Chen, Arthur and Kamensky11) .
Previous studies suggest that genetics, environment and lifestyle factors contribute to obesity and detrimental fat distribution(Reference Williams, Mesidor and Winters12–Reference Li and Qi14). As a key modifiable lifestyle factor, better diet quality was related to reduced body fat, increased lean mass and lower trunk-to-leg fat ratio(Reference Xu, Greene and Earp15). In a cross-sectional study, both prolonged sitting time and insufficient physical activity were associated with higher body and trunk fat percentages(Reference Liao, Hu and Imm16). Sleep characteristics, such as sleep duration, were also related to body composition as well as fat distribution(Reference Xu, Zhao and Yu17,Reference Wirth, Hébert and Hand18) . However, previous observational studies had small sample sizes and generally focused on single lifestyle factors. Large epidemiological studies investigating the association of multiple lifestyle factors with body composition and fat distribution remain scarce.
In addition, the role of genetics in body composition and fat distribution has been established by large-scale genome-wide association studies (GWAS)(Reference Pulit, Stoneman and Morris19,Reference Rask-Andersen, Karlsson and Ek20) . Recent GWAS for the proportion of body fat distributed to the arms, trunk and legs have identified ninety-eight independent associations with body fat distribution(Reference Rask-Andersen, Karlsson and Ek20). Genetic susceptibility of body composition and fat distribution defined by polygenic risk scores (PRS) can be constructed through aggregating associated genetic variants. However, it remained unclear whether there is an interaction between modifiable lifestyle factors and genetic susceptibility on body composition and fat distribution.
Therefore, we proposed to investigate modifiable lifestyle behaviours and the interaction with genetic susceptibility factors in relation to body composition and fat distribution obtained by bioimpedance measures among women in the UK Biobank cohort study.
Methods
Study population
The UK Biobank is a large population-based cohort study that recruited approximately 500 000 participants aged 37–73 years between 2006 and 2010 in the UK. Details of the study design and data collection have been previously documented(Reference Sudlow, Gallacher and Allen21). At baseline, participants completed touchscreen questionnaires about lifestyle and other potentially health-related information, took physical measurements and provided blood samples used for genotyping.
For the primary analysis, we excluded those with missing information on lifestyle factors, anthropometric and bioimpedance measures, leaving 121 664 women. For the subsequent genetic analysis, 118 544 women remained after further excluding those with missing genetic data or sex mismatch (online Supplementary Figure 1).
Assessment of healthy lifestyle factors
We included six healthy lifestyle factors (defined as no current smoking, low to moderate alcohol intake, healthy diet, regular physical exercise, less sedentary hours and healthy sleep) to investigate the associations of healthy lifestyle with body composition and fat distribution. Detailed information about the assessment of each healthy lifestyle factor is described in online Supplementary Table 1. Each lifestyle factor was coded 1 if meeting the healthy criterion and 0 if not. Then, we summed the score of all the six lifestyle factors and the lifestyle score ranged from 0 to 6, with a higher score indicating a healthier lifestyle.
Consistent with previous epidemiological studies, the healthy lifestyle score was constructed using an equal weighting strategy(Reference Khera, Emdin and Drake22,Reference Rutten-Jacobs, Larsson and Malik23) , which enhances transparency and interpretability in large-scale population analyses. Participants were classified into favourable (4–6), intermediate (3) and unfavourable (0–2) lifestyle groups based on healthy lifestyle score.
Assessment of BMI, body composition and fat distribution
Anthropometric and biometric measurements were collected by trained staff from UK Biobank. BMI was computed by dividing weight (kilograms) by the square of height (metres). Body composition was estimated utilising the Tanita BC-418MA body composition analyser (Tanita Corporation) via bioimpedance analysis. The whole-body fat mass and regional fat mass for specific body segments, including the right arm, right leg, left arm, left leg and trunk, were calculated. For limbs, arm (or leg) fat mass was determined as the sum of measurements from the right and left sides. For body composition, we calculated FMI and FFMI by whole-body fat mass and fat-free mass divided by height squared (m2), respectively. For body fat distribution, the proportions of body fat distributed to the arms (arm fat ratio, AFR), legs (leg fat ratio, LFR) and trunk (trunk fat ratio, TFR) were calculated as their respective fat masses divided by the whole-body fat mass.
Construction of polygenic risk score
All participants from UKB were genotyped using the UK BiLEVE Axiom Array or UK Biobank Axiom Array (Affymetrix), which share over 95 % of Single Nucleotide Polymorphism (SNP). Genotype imputation was performed using the Haplotype Reference Consortium, together with the merged UK10K and 1000 Genomes Phase 3 reference panels, implemented in IMPUTE4. PRS for each trait were constructed based on summary statistics from large-scale GWAS of body composition and fat distribution. Specifically, the PRS for BMI was constructed using 281 BMI-associated SNP (P < 5 × 10⁻⁶) identified among women in the largest available GWAS, with effect size estimates obtained from the GWAS Catalog(Reference Pulit, Stoneman and Morris19). PRS for FMI and FFMI were constructed using eighty-two SNP (P < 5 × 10⁻⁸) reported in a previous study (online Supplementary Table 2)(Reference Larsson, Bäck and Rees24). PRS for AFR, TFR and LFR were derived using thirteen, fifty-six and thirty-three SNP, respectively (P < 1 × 10⁻⁷), based on recent GWAS findings (online Supplementary Table 3)(Reference Rask-Andersen, Karlsson and Ek20). All included SNP were independent lead variants as defined in the original GWAS. For each individual, the PRS was calculated as the sum of the number of effect alleles (0, 1 or 2) weighted by their corresponding GWAS-derived effect sizes (β coefficients). Participants were categorised into low (tertile 1), intermediate (tertile 2) and high (tertile 3) genetic risk groups based on the tertiles of the PRS distribution.
Assessment of covariates
Covariates adjusted in this study included age at recruitment, race (white, non-white), menopausal status (yes, no, not sure), education level (college or university, lower than college and unknown) and Townsend deprivation index (continuous).
Statistical analysis
Density plots were utilised to visually depict the distribution of BMI, body composition and fat distribution across different lifestyle categories by excluding participants with measures below the first percentile or above the 99th percentile.
Multiple linear regression models were used to estimate the coefficient (Beta) and 95 % CI for the associations between healthy lifestyle factors and adiposity measures, with adjustment for age at recruitment, race, menopausal status, education and Townsend deprivation index. Given the positively skewed distributions for BMI, FMI, FFMI, AFR and LFR, log-transformed values were used. The results of multivariate linear regression analysis were presented as percentage differences compared with the reference group by using the equation: (exp (β–coefficient) − 1) × 100 %. TFR was entered on the natural scale, and we calculated the percent differences through the β-coefficient divided by the mean of the reference group.
We further conducted stratified analyses based on menopausal status (premenopausal, postmenopausal) and genetic risk (low, intermediate and high PRS) to evaluate the associations between lifestyle categories and body composition and fat distribution. Sensitivity analyses were performed to assess the robustness of our findings. We repeated the analyses by excluding women with chronic diseases (cancer, CVD, type 2 diabetes or hypertension).
Additionally, we fitted the restricted cubic spline regression for PRS with three knots (placed at the 10th, 50th and 90th percentiles) to examine the dose–response association of PRS with corresponding measures. To assess the joint effect, participants were categorised into nine subgroups jointly subclassified by the categories of healthy lifestyle score (favourable, intermediate and unfavourable) and PRS (low, intermediate and high PRS). The regression models were further adjusted for the first ten principal components of ancestry. Joint effects of each healthy lifestyle factor and genetic risk were also examined.
All statistical analyses were performed using SAS 9·4 (SAS Institute) and R 4.2.1. All P values were two-sided, and P < 0·05 was considered statistically significant.
Results
Characteristics of participants
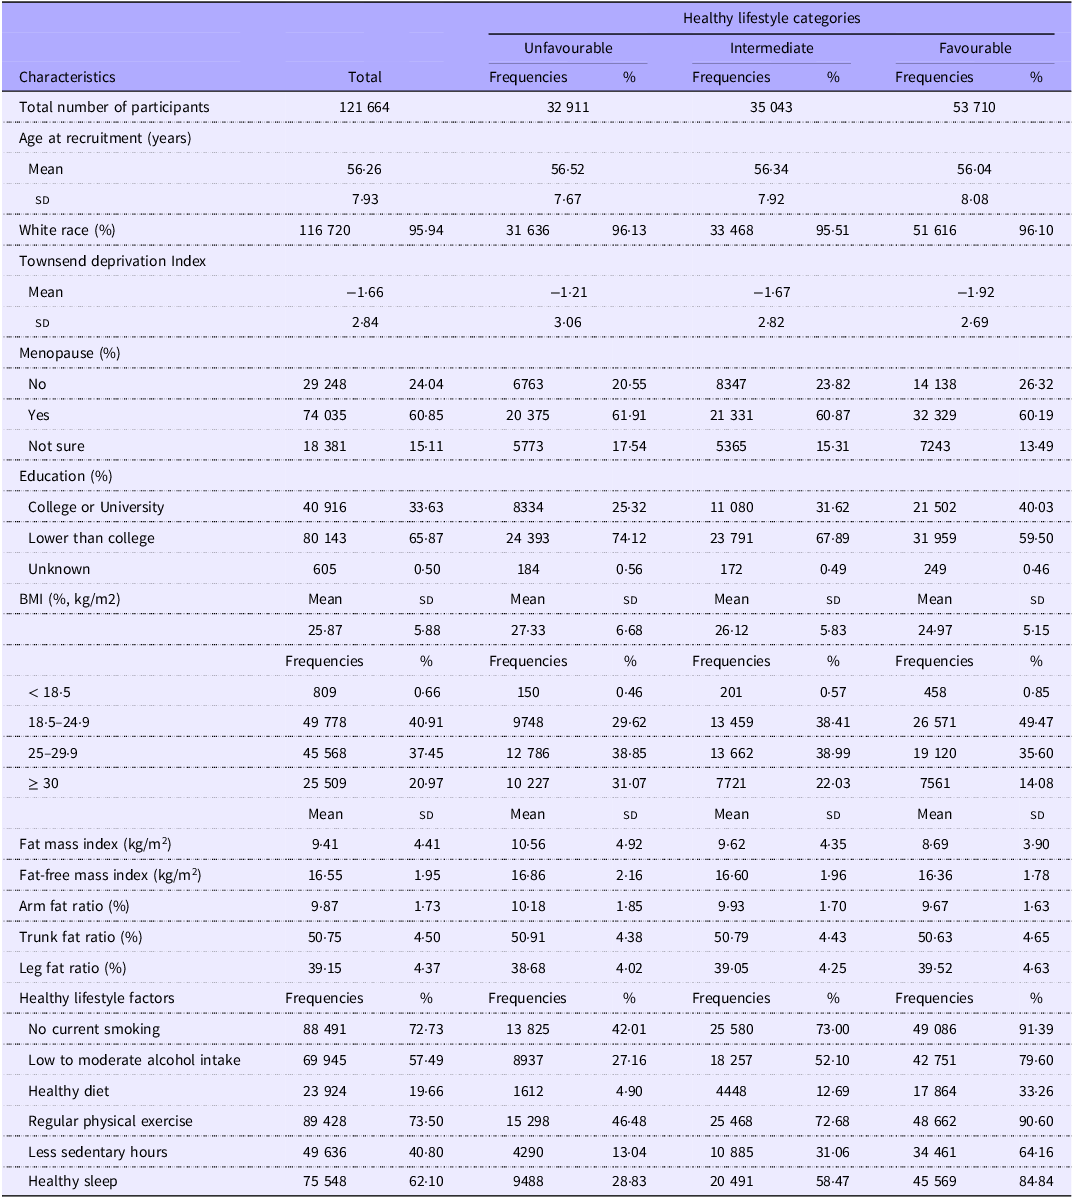
Table 1 shows the characteristics of participants according to healthy lifestyle categories. Among the 121 664 participants, 32 911 (27·05 %) had an unfavourable lifestyle, 35 043 (28·80 %) had an intermediate lifestyle and 53 710 (44·15 %) had a favourable lifestyle. Compared with those with an unfavourable lifestyle, participants with a favourable lifestyle tended to have higher socio-economic status, higher education level, lower BMI, lower FMI, lower FFMI, lower AFR, lower TFR and higher LFR.
Characteristics of participants according to healthy lifestyle categories

Table 1. Long description
The table presents data on 121664 participants categorized into unfavourable, intermediate, and favourable lifestyle groups. It includes frequencies and percentages for various characteristics such as age at recruitment, white race, Townsend deprivation Index, menopause status, education level, BMI, fat mass index, fat-free mass index, arm fat ratio, trunk fat ratio, leg fat ratio, and healthy lifestyle factors. Participants with a favourable lifestyle tend to have higher socio-economic status, higher education level, lower BMI, lower fat mass index, lower fat-free mass index, lower arm fat ratio, lower trunk fat ratio, and higher leg fat ratio compared to those with an unfavourable lifestyle. The table provides mean and standard deviation for continuous variables and frequencies and percentages for categorical variables.
Values are means (sd) or median (interquartile range, IQR) for continuous variables and frequencies (percentages) for categorical variables.
Associations of healthy lifestyle on body composition and fat distribution
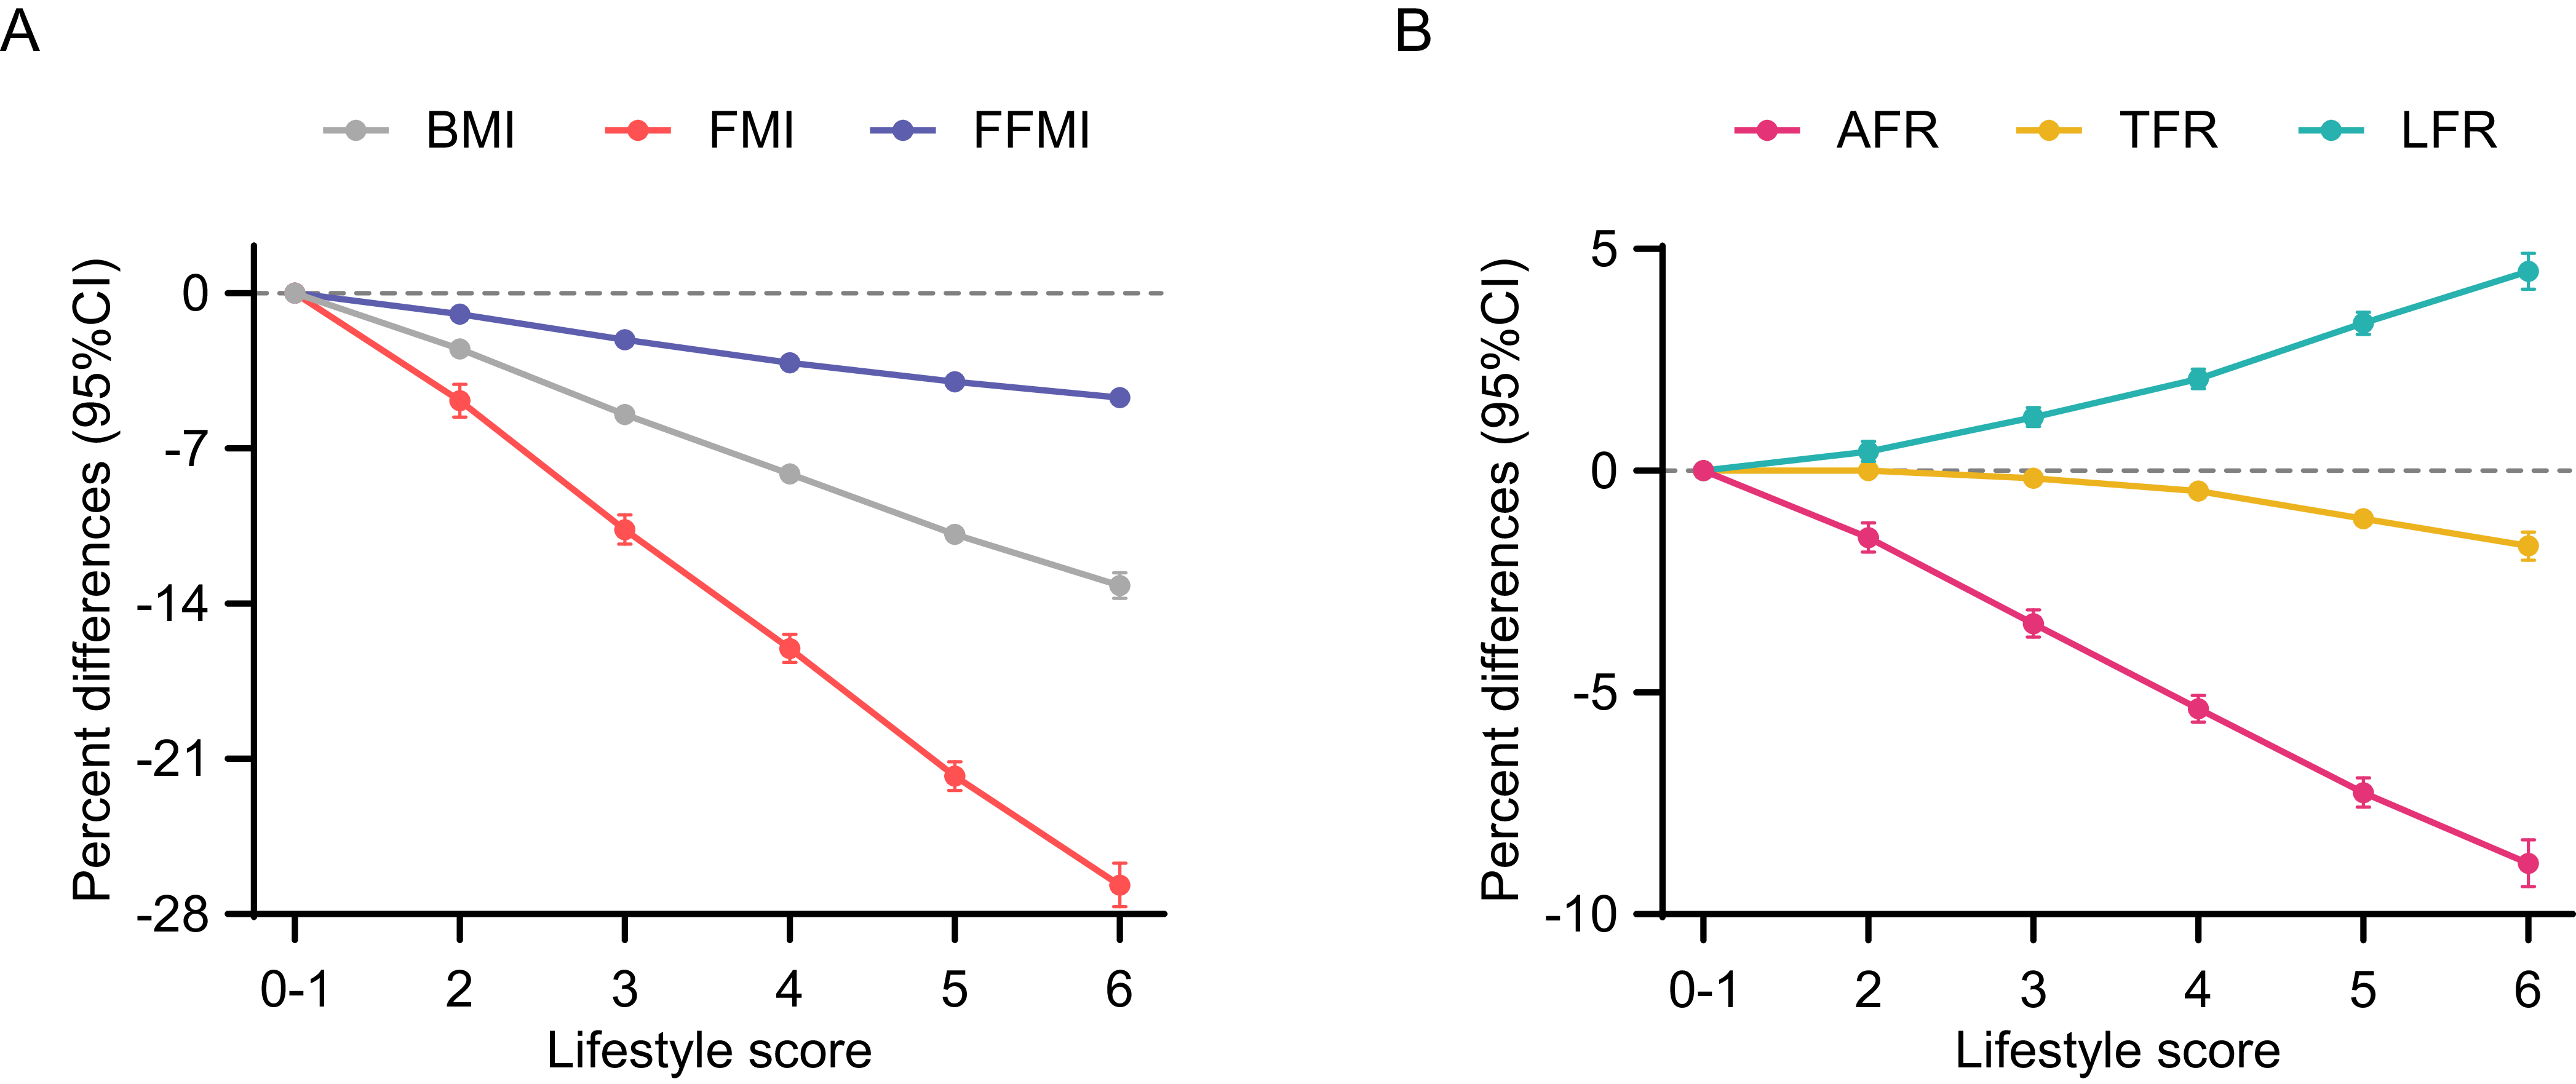
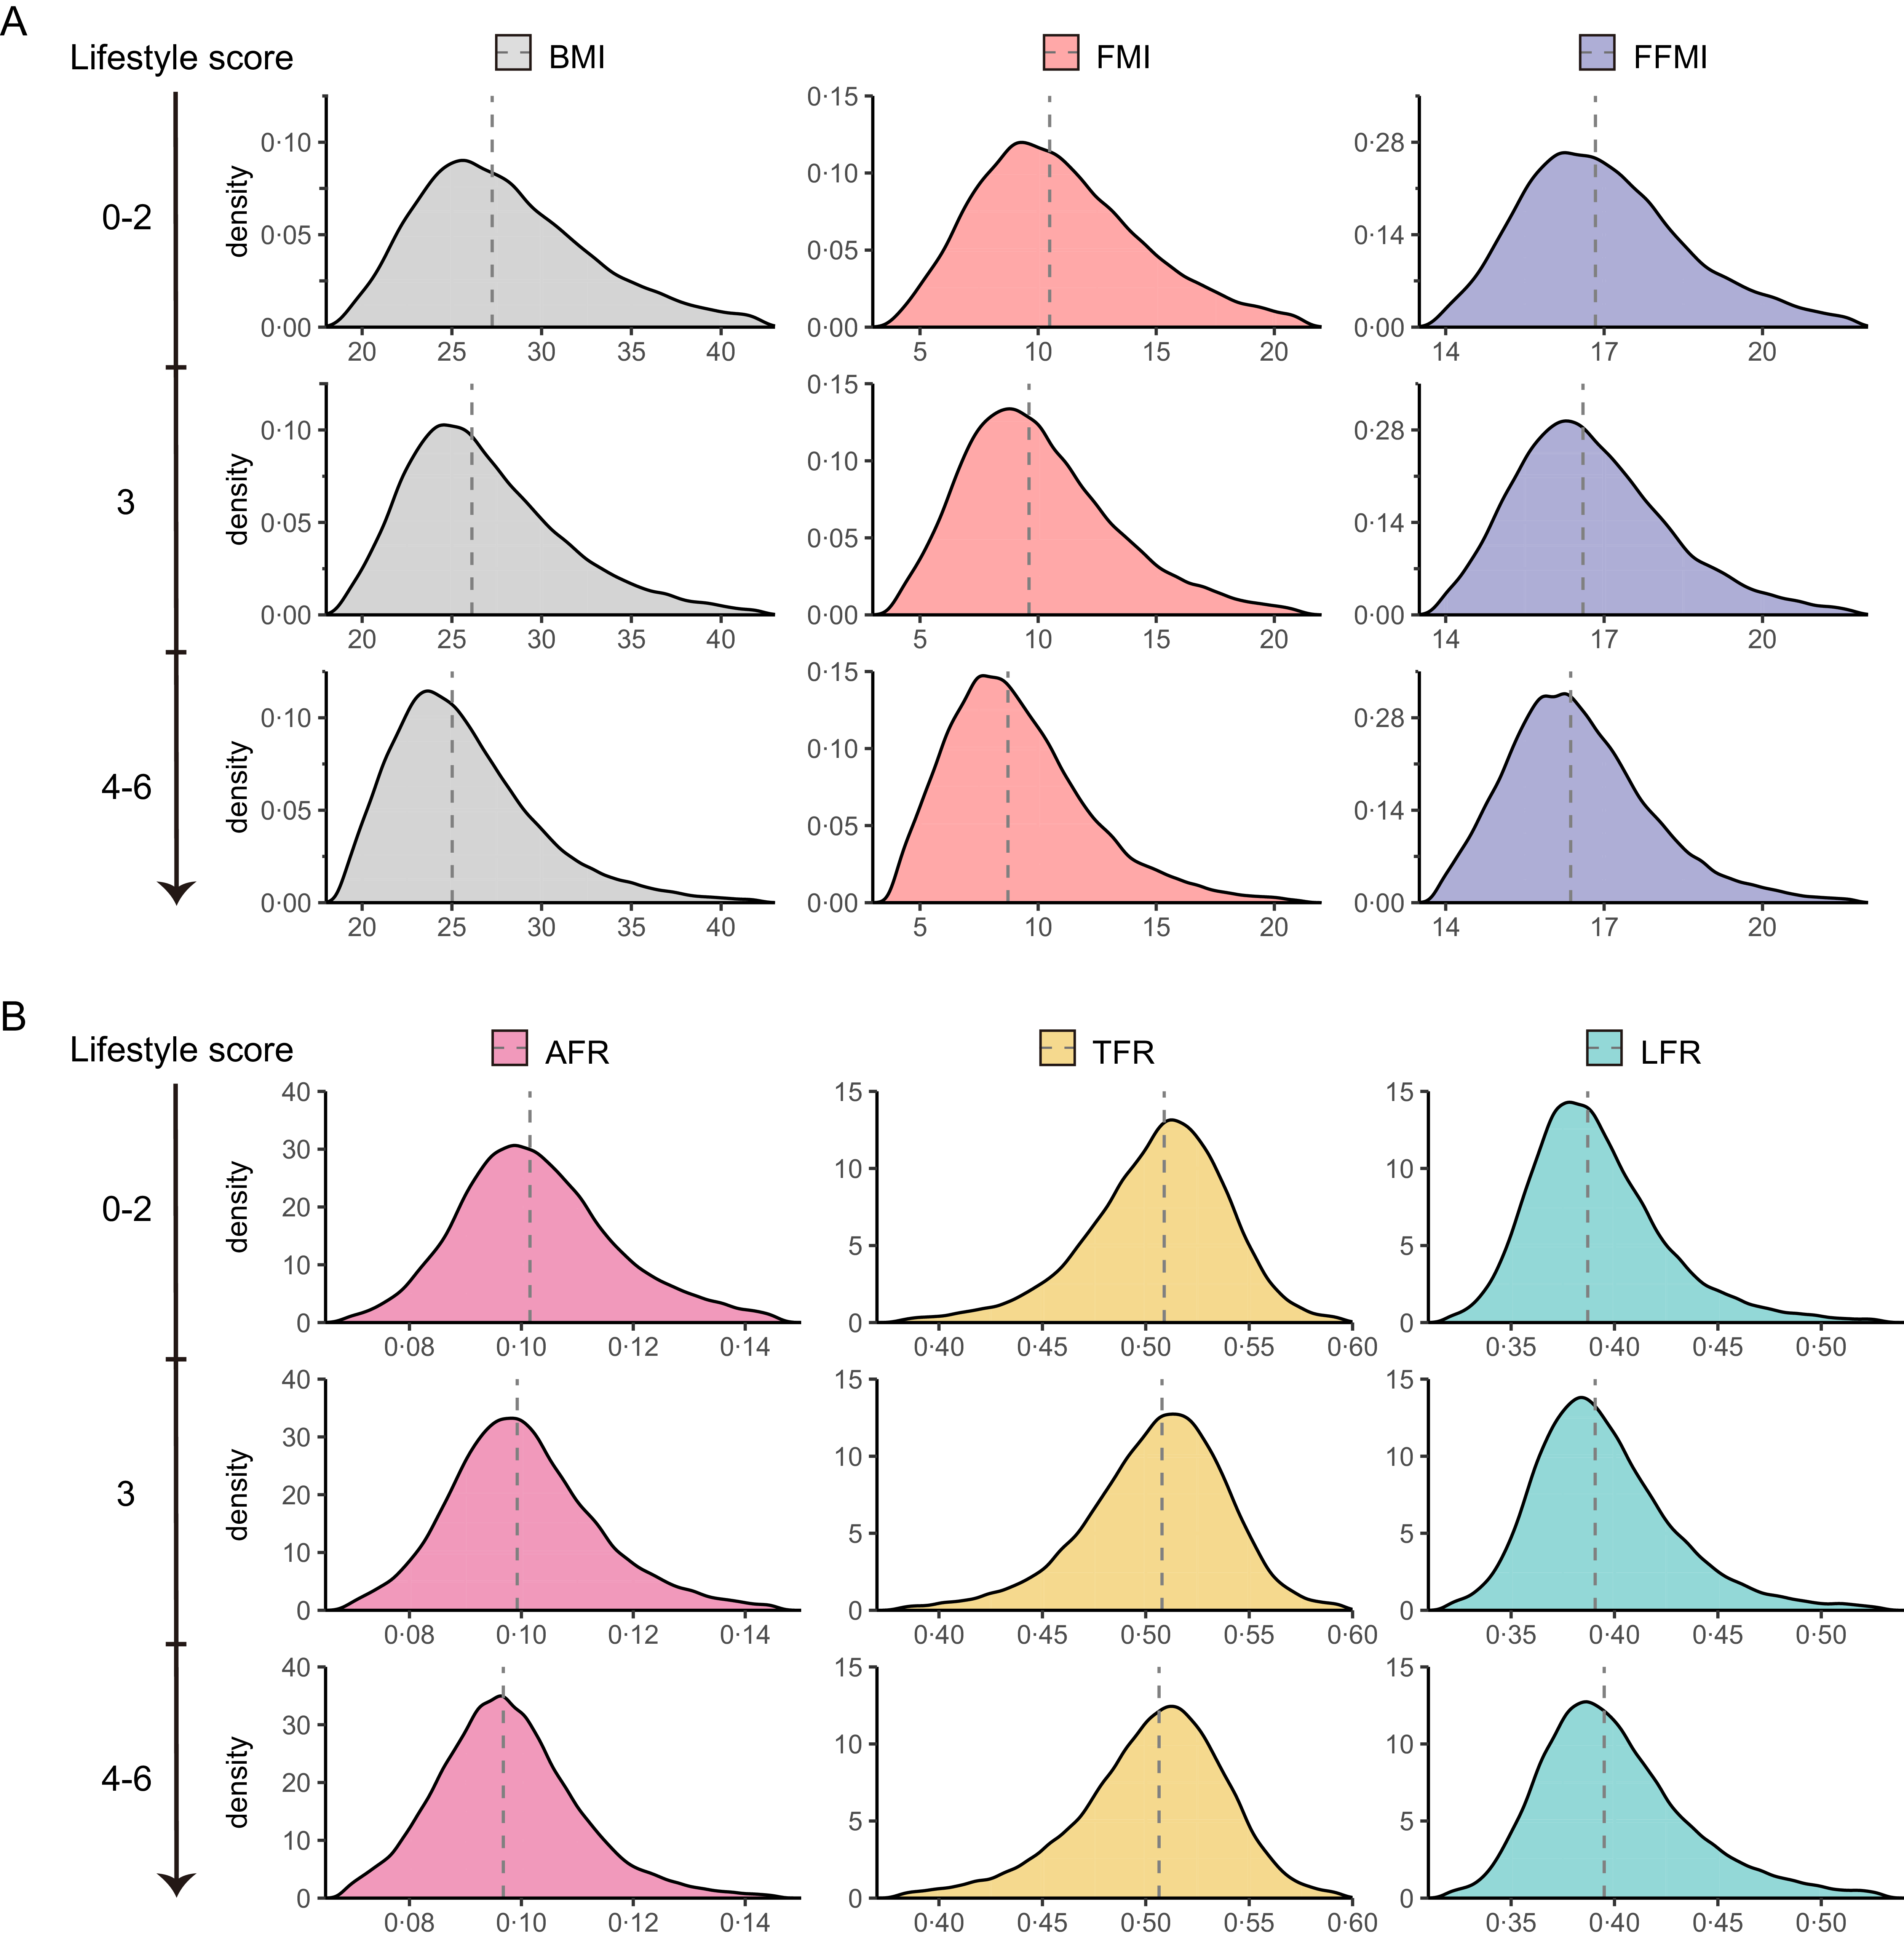
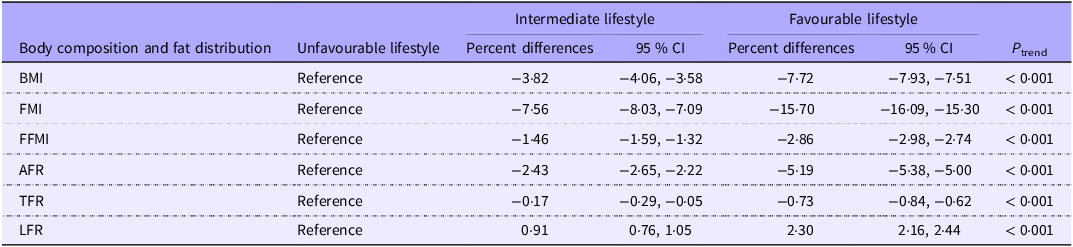
Figure 1 shows the associations of healthy lifestyle score with body composition and fat distribution. With each 1-point increment in healthy lifestyle score, the percent differences were −2·80 % (95 % CI: −2·87 %, −2·73 %) for BMI, −5·93 % (−6·07 %, −5·78 %) for FMI, −1·00 % (−1·04 %, −0·96 %) for FFMI, −1·87 % (−1·93 %, −1·80 %) for AFR, −0·29 (−0·33 %, −0·25 %) for TFR and 0·84 % (0·80 %, 0·88 %) for LFR (Figure 1(A) and (B)). Density plots show the body composition and fat distribution changes across healthy lifestyle categories (Figure 2). With an increase in healthy lifestyle categories, we observed significant decreases in BMI, FMI, FFMI, AFR and TFR (P trend < 0·001), but a remarkable increase in LFR (P trend < 0·001). Women with a favourable lifestyle had lower BMI (−7·72 %, 95 % CI: −7·93 %, −7·51 %), FMI (−15·70 %, 95 % CI: −16·09 %, −15·30 %), FFMI (−2·86 %, 95 % CI: −2·98 %, −2·74 %), AFR (−5·19 %, 95 % CI: −5·38 %, −5·00 %) and TFR (−0·73 %, 95 % CI: −0·84 %, −0·62 %), but higher LFR (2·30 %, 95 % CI: 2·16 %, 2·44 %) than those with an unfavourable lifestyle (Table 2).
Associations of healthy lifestyle score with body composition and fat distribution. (a) Percent differences for BMI, FMI and FFMI; (b) percent differences for AFR, TFR and LFR. Linear regression models were adjusted for age, race, menopausal status, education and Townsend deprivation index. Women who scored 0 or 1 point were regarded as the reference. All P trend < 0·05. FMI, fat mass index; FFMI, fat-free mass index; AFR, arm fat ratio; TFR, trunk fat ratio; LFR, leg fat ratio.

Figure 1. Long description
The line graph consists of two panels labeled A and B. Panel A shows the percent differences for BMI, FMI, and FFMI across different lifestyle scores. The x-axis represents the lifestyle score ranging from 0 to 6, and the y-axis represents the percent differences with a 95 percent confidence interval. The data lines are color-coded: gray for BMI, red for FMI, and blue for FFMI. Panel B shows the percent differences for AFR, TFR, and LFR across different lifestyle scores. The x-axis represents the lifestyle score ranging from 0 to 6, and the y-axis represents the percent differences with a 95 percent confidence interval. The data lines are color-coded: pink for AFR, yellow for TFR, and cyan for LFR. All values are approximated.
Density plots of body composition and fat distribution according to the healthy lifestyle categories. Dotted lines denote medians. FMI, fat mass index; FFMI, fat-free mass index; AFR, arm fat ratio; TFR, trunk fat ratio; LFR, leg fat ratio.

Figure 2. Long description
The image presents density plots illustrating the distribution of body composition and fat distribution across different lifestyle scores. The plots are divided into two main sections: A and B. Section A includes three columns representing BMI, FMI, and FFMI, while Section B includes three columns representing AFR, TFR, and LFR. Each row corresponds to different lifestyle scores ranging from 0-2, 3, and 4-6. The x-axis of each plot represents the respective index values, and the y-axis represents the density. Dotted lines denote the medians for each distribution. The plots show how body composition and fat distribution vary with different lifestyle scores, highlighting the differences in density distributions across the indices.
Associations of healthy lifestyle categories with body composition and fat distribution

Table 2. Long description
The table presents the associations of healthy lifestyle categories with body composition and fat distribution. It includes data for BMI, FMI, FFMI, AFR, TFR, and LFR across unfavourable, intermediate, and favourable lifestyle categories. The table has six rows for each body composition and fat distribution metric and three columns for percent differences and confidence intervals. Notable trends include significant decreases in BMI, FMI, FFMI, AFR, and TFR with increasing healthy lifestyle categories, while LFR shows a remarkable increase. Women with a favourable lifestyle have lower BMI, FMI, FFMI, AFR, and TFR but higher LFR compared to those with an unfavourable lifestyle.
FMI, fat mass index; FFMI, fat-free mass index; AFR, arm fat ratio; TFR, trunk fat ratio; LFR, leg fat ratio.
Linear regression models were adjusted for age, race, menopausal status, education and Townsend deprivation index. P trend was calculated by treating the healthy lifestyle score as a continuous variable.
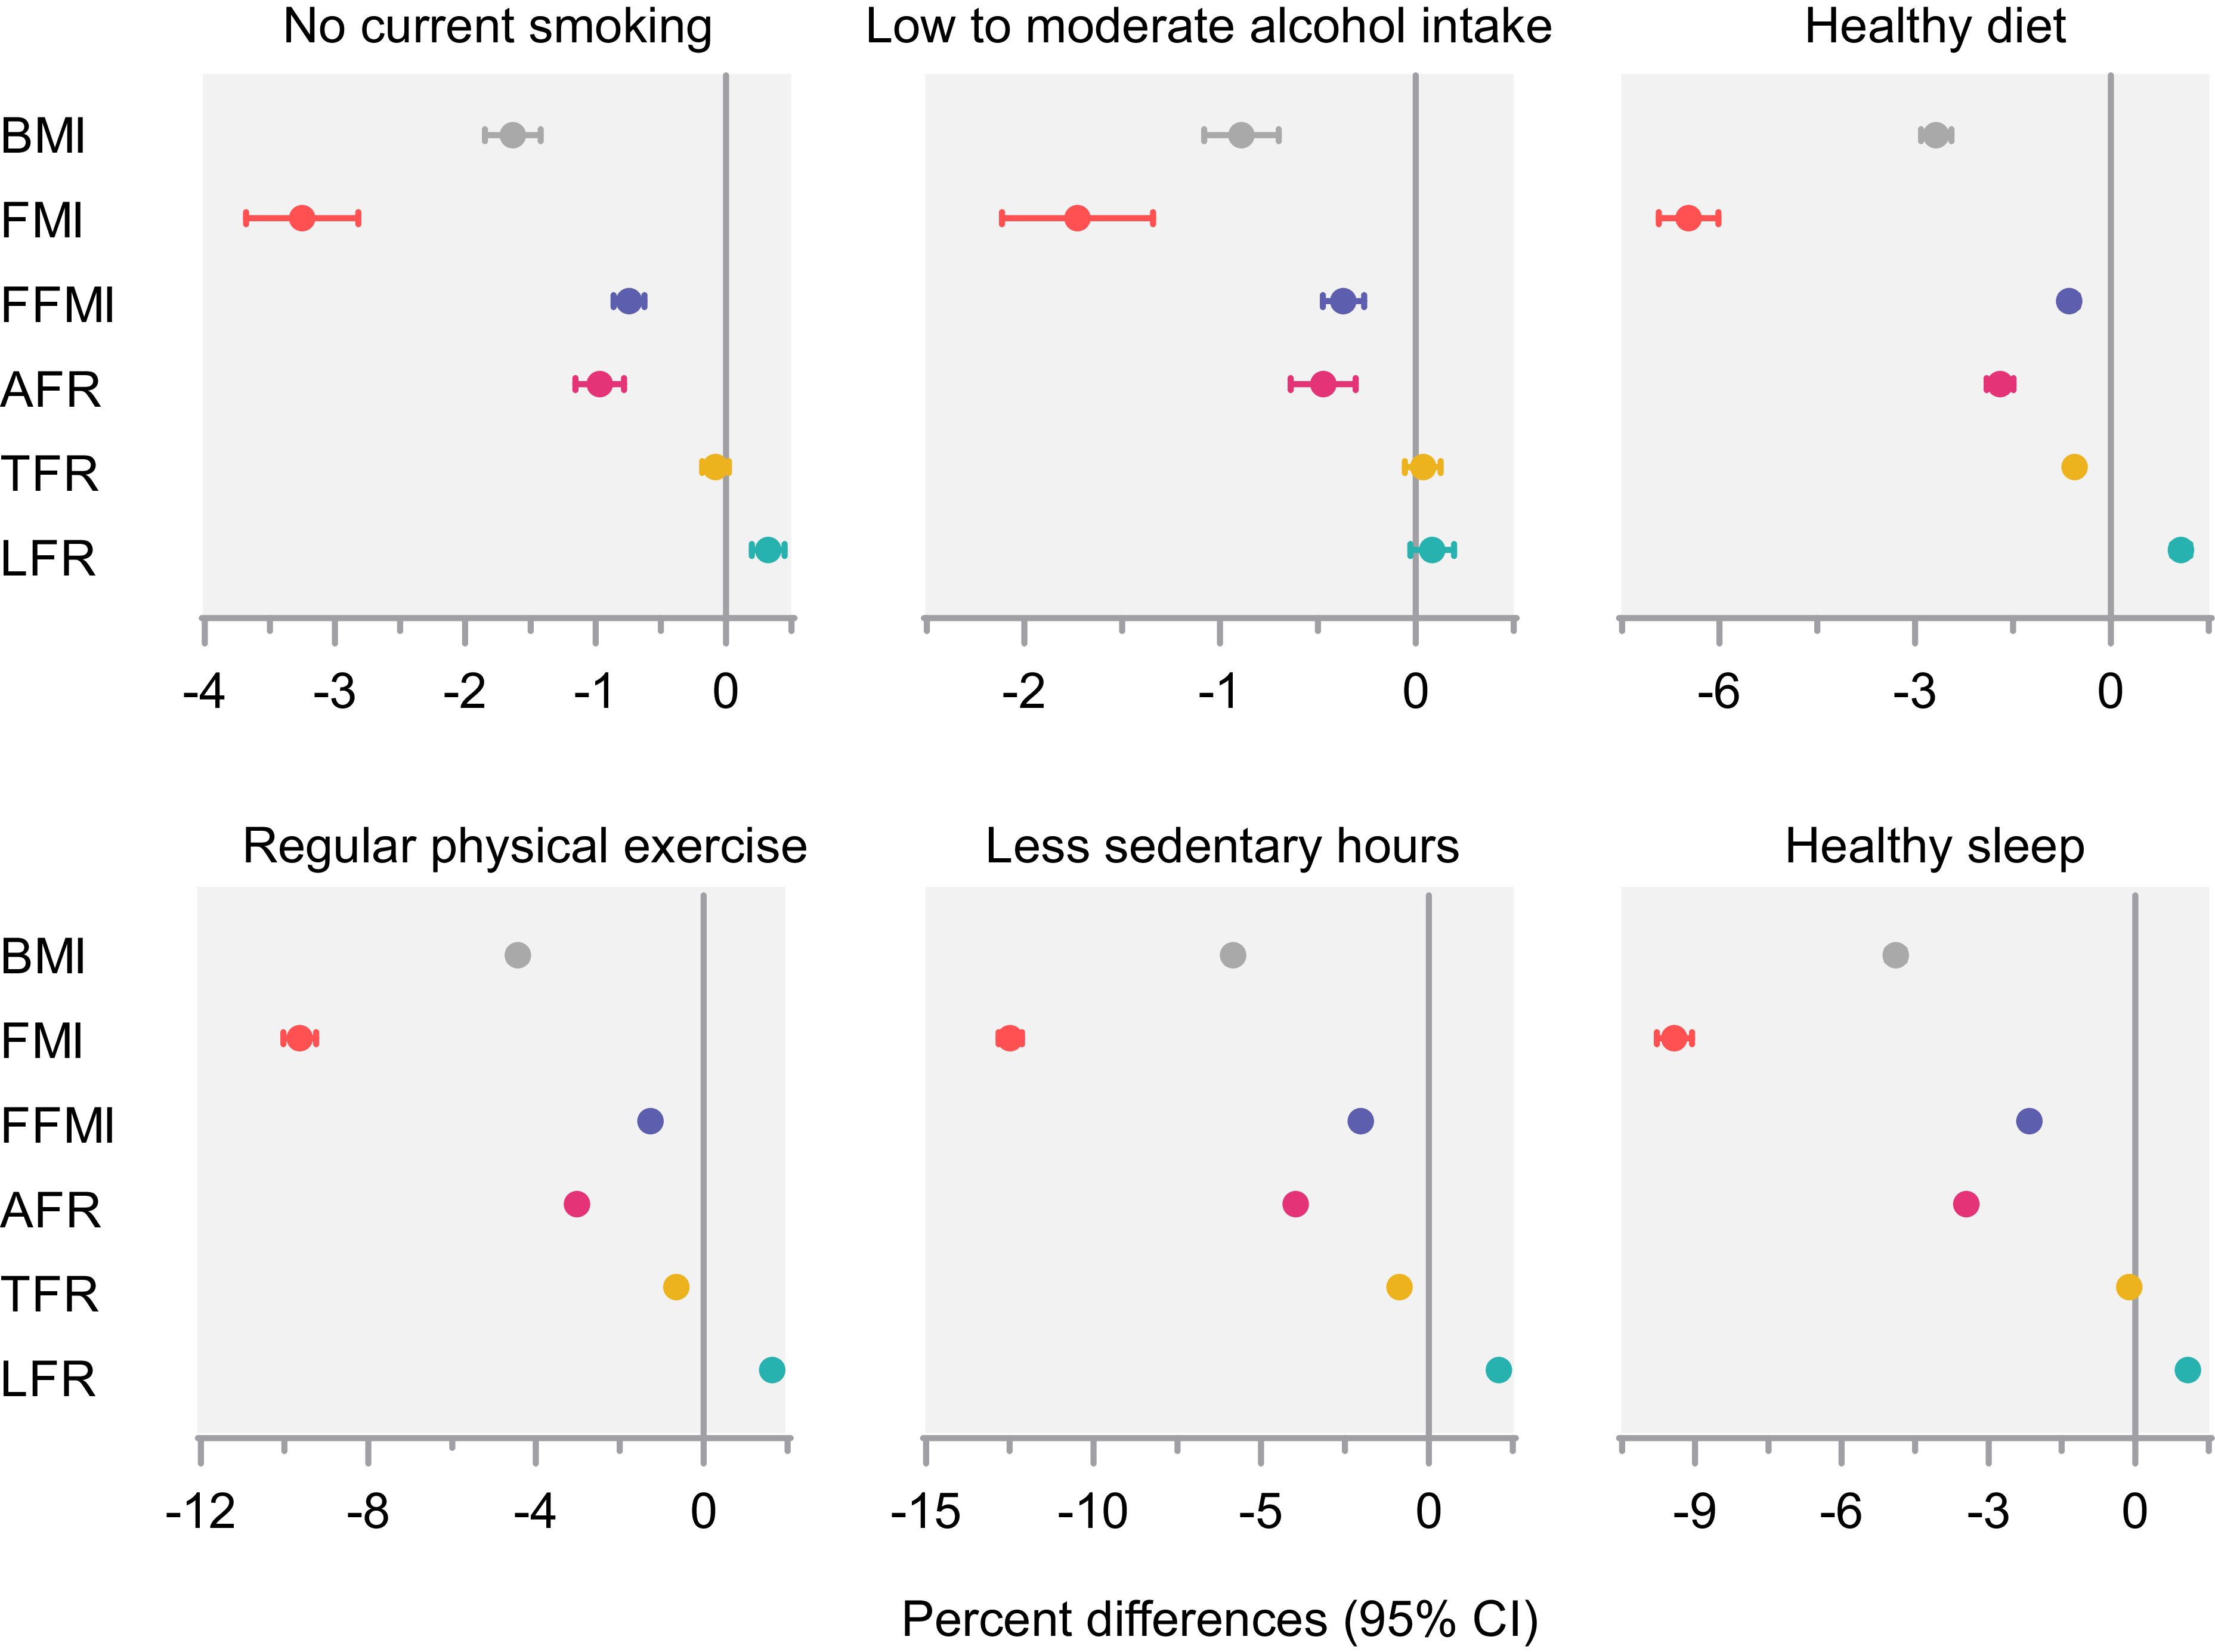
Figure 3 depicts the associations of individual healthy lifestyle factors with body composition and fat distribution. Non-current smokers had lower BMI (−1·64 %, 95 % CI: −1·85 %, −1·42 %), FMI (−3·25 %, 95 % CI: −3·68 %, −2·82 %), FFMI (−0·74 %, 95 % CI: −0·86 %, −0·63 %), AFR (−0·97 %, 95 % CI: −1·16 %, −0·78 %), TFR (−0·08 %, 95 % CI: −0·18 %, 0·02 %) and higher LFR (0·32 %, 95 % CI: 0·20 %, 0·45 %). Similarly, the other five healthy lifestyle factors were also associated with lower BMI, FMI, FFMI, AFR and higher LFR. ‘Healthy diet’, ‘regular physical exercise’, ‘less sedentary hours’ and ‘healthy sleep’ were significantly associated with lower TFR (range from −0·87 % to −0·12 %).
Forest plots for the associations between individual healthy lifestyle factors and body composition and fat distribution. Linear regression models were adjusted for age, race, menopausal status, education and Townsend deprivation index. Women with an unhealthy lifestyle factor were regarded as the reference. FMI, fat mass index; FFMI, fat-free mass index; AFR, arm fat ratio; TFR, trunk fat ratio; LFR, leg fat ratio.

Figure 3. Long description
The dot plot presents the associations between individual healthy lifestyle factors and body composition and fat distribution in women. The plot is divided into six panels, each representing a different healthy lifestyle factor: No current smoking, Low to moderate alcohol intake, Healthy diet, Regular physical exercise, Less sedentary hours, and Healthy sleep. Each panel shows the percent differences with 95% confidence intervals for various adiposity measures: BMI, FMI, FFMI, AFR, TFR, and LFR. The x-axis represents the percent differences, while the y-axis lists the adiposity measures. Each dot represents the percent difference for a specific adiposity measure, with error bars indicating the 95% confidence intervals. The plot highlights how different lifestyle factors are associated with variations in body composition and fat distribution. For instance, no current smoking and regular physical exercise show significant negative percent differences for BMI and FMI, indicating beneficial effects. The healthy diet panel shows the most substantial negative percent differences across all measures, suggesting a strong positive impact on body composition. The less sedentary hours and healthy sleep panels also demonstrate notable negative percent differences, particularly for BMI and FMI. The low to moderate alcohol intake panel shows mixed results, with some measures like AFR and TFR showing negative percent differences, while others like FMI and FFMI show less pronounced effects. Overall, the plot illustrates the varying impacts of different healthy lifestyle factors on body composition and fat distribution in women. All values are approximated.
Stratification and sensitivity analyses
When stratified by menopausal status, the relationships between a favourable lifestyle and body composition and fat distribution were still significant no matter in premenopausal or postmenopausal women (online Supplementary Table 4).
All the results were not substantially changed in the sensitivity analysis after excluding women with chronic diseases (online Supplementary Table 5).
Associations of polygenic risk scores on body composition and fat distribution
The PRS were significantly associated with corresponding traits (online Supplementary Figure 2). Women with high PRS had 7·80 % (95 % CI: 7·55 %, 8·05 %), higher BMI, 6·76 % (6·25 %, 7·27 %), higher FMI, 2·53 % (2·40 %, 2·66 %), higher FFMI, 2·64 % (2·44 %, 2·85 %), higher AFR, 2·73 % (2·62 %, 2·85 %), higher TFR and 2·64 % (2·51 %, 2·78 %) higher LFR than those with low PRSs (online Supplementary Table 6).
Associations of lifestyle and polygenic risk scoress on body composition and fat distribution
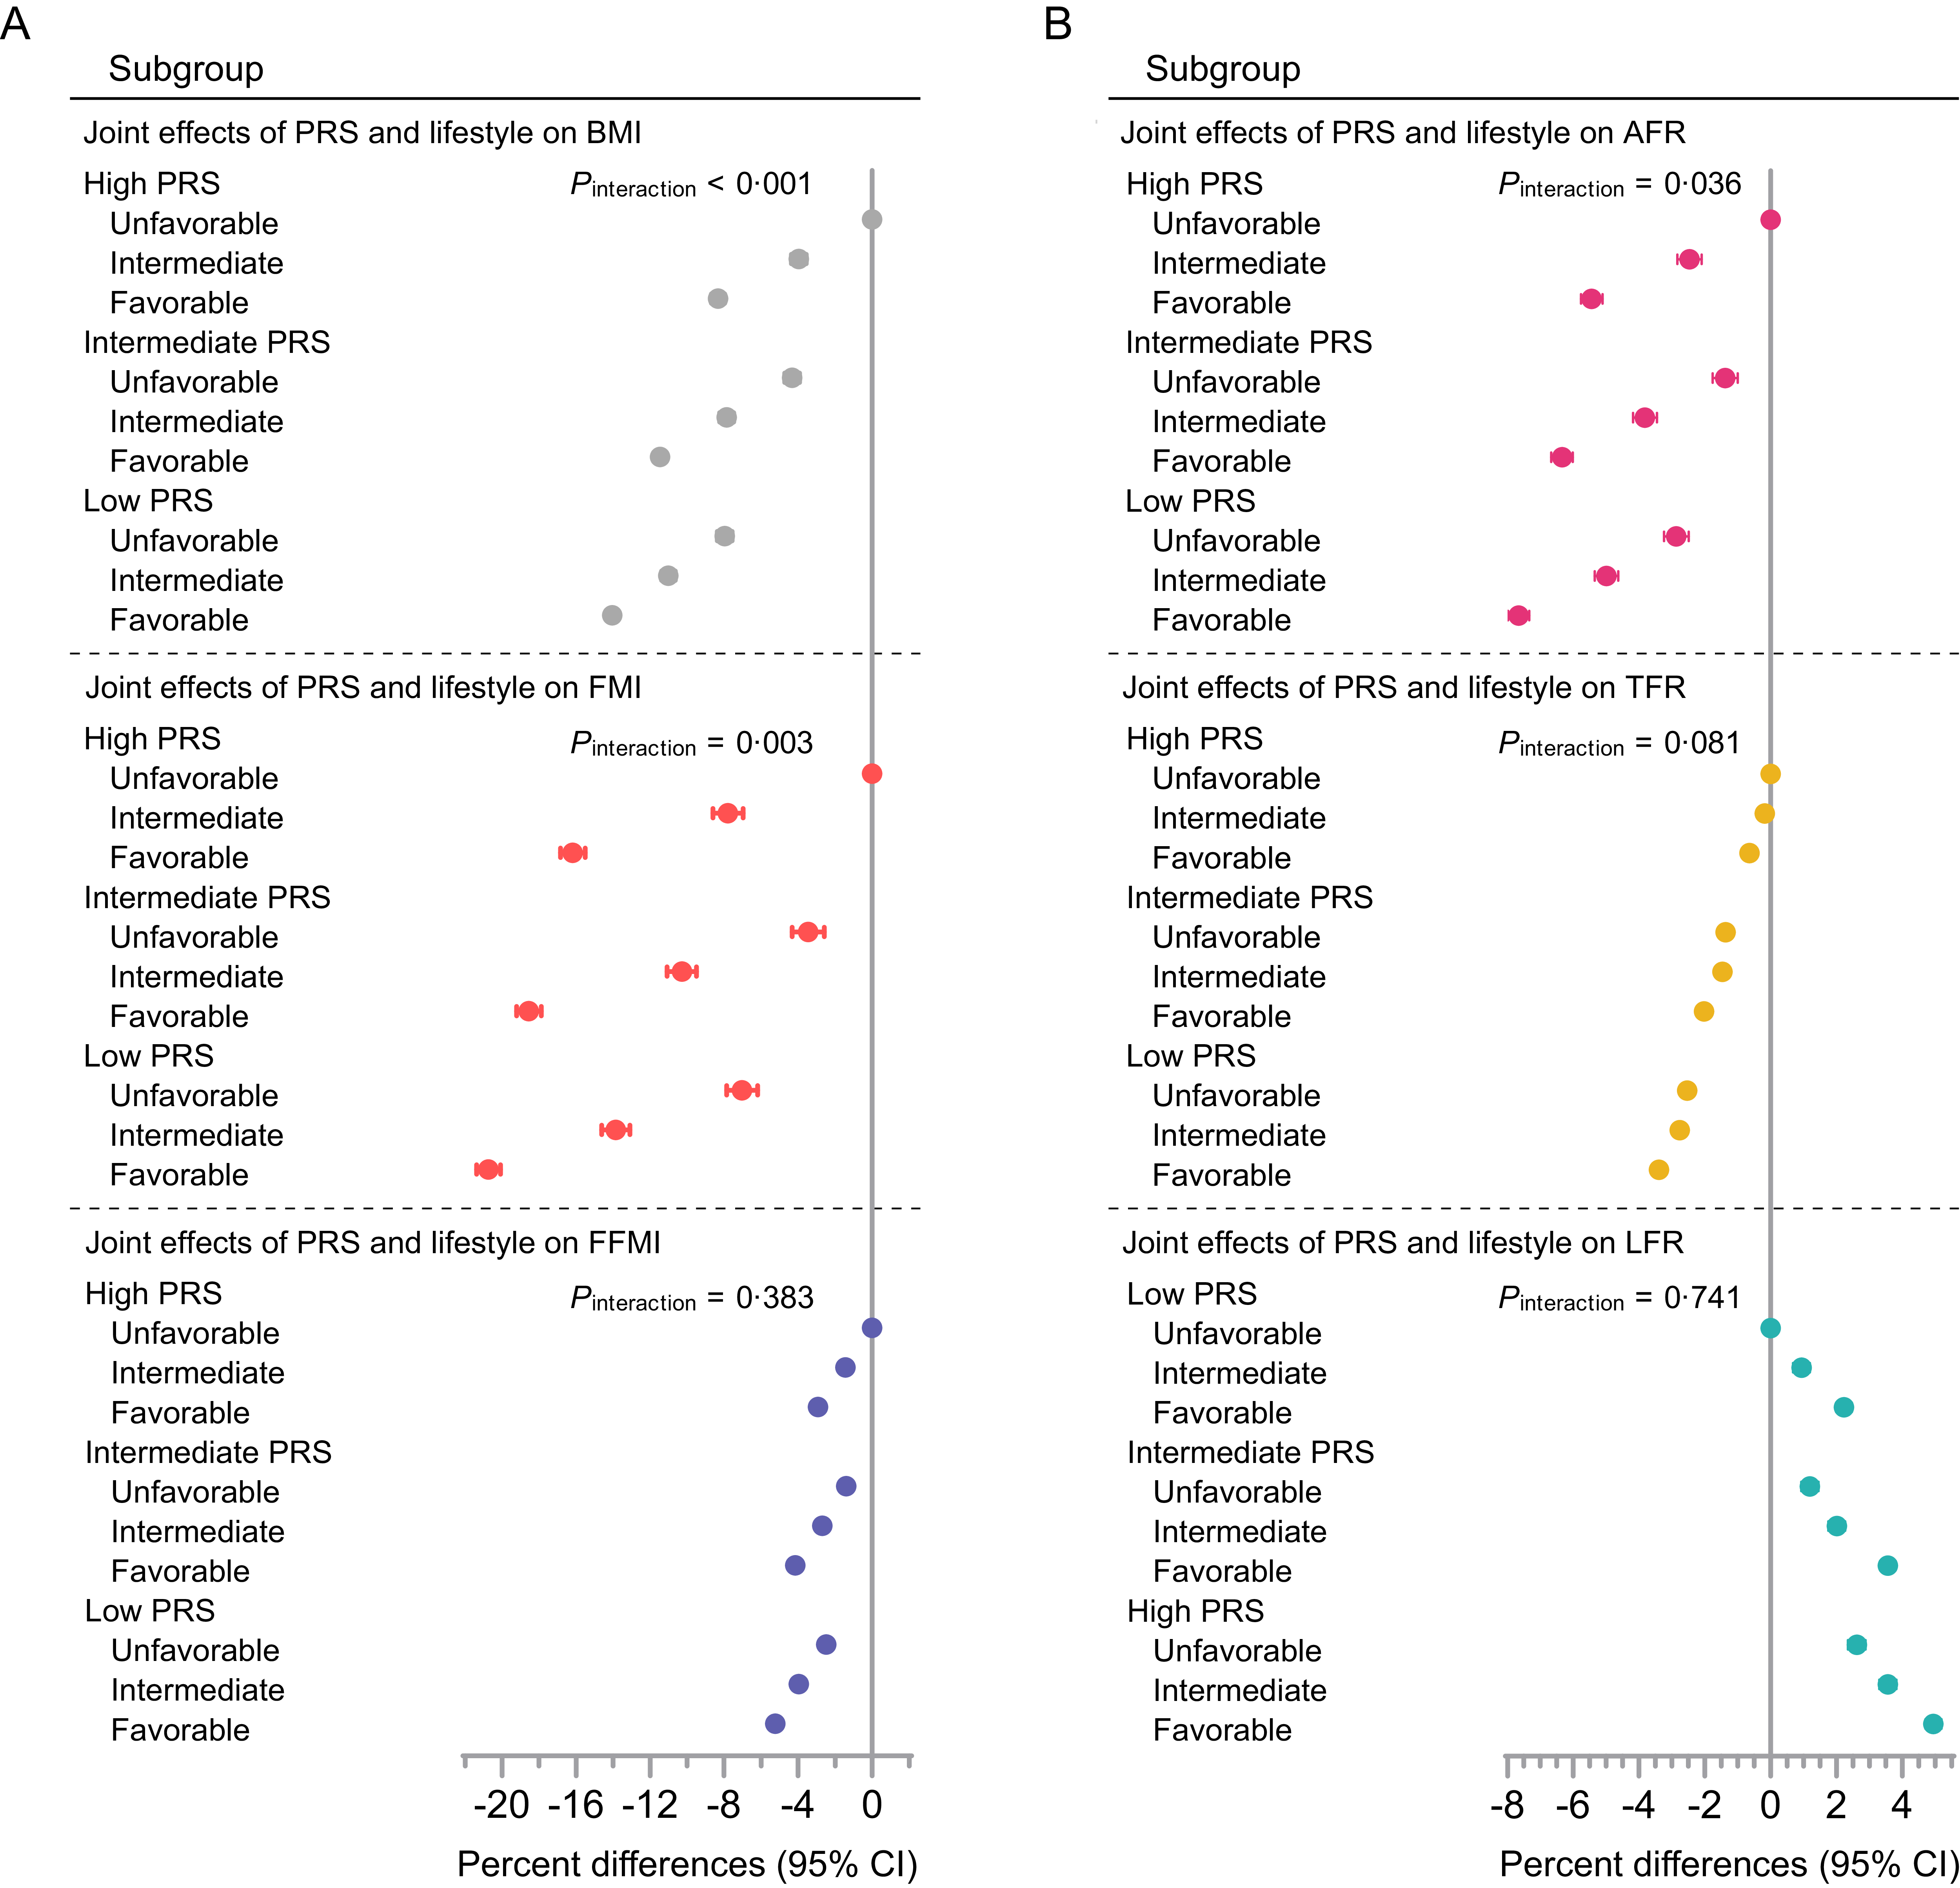
When stratified by genetic risk levels, BMI, FMI, FFMI, AFR and TFR decreased with a healthier lifestyle (all P trend < 0·001), while LFR increased (P trend < 0·001) in all three genetic risk groups (online Supplementary Table 7). Besides, we observed joint effects of healthy lifestyle and PRSs on these six traits which behaved in a dose-response manner (Figure 4). Specifically, women with low PRSs and a favourable lifestyle had lower BMI (−14·05 %, 95 % CI: −14·38 %, −13·72 %), lower FMI (−20·73 %, 95 % CI: −21·37 %, −20·09 %), lower FFMI (−5·23 %, 95 % CI: −5·44 %, −5·02 %), lower AFR (−7·66 %, 95 % CI: −7·98 %, −7·34 %) and lower TFR (−3·40 %, 95 % CI: −3·59 %, −3·21 %) than those with high PRSs and an unfavourable lifestyle. In contrast, women with high PRSs and a favourable lifestyle had 4·95 % (95 % CI: 4·71 %, 5·20 %) higher LFR than those with low PRSs and an unfavourable lifestyle. Significant interactions were found between healthy lifestyle categories and PRSs on BMI, FMI and AFR (all P interaction < 0·05). Joint effects of genetic risk and individual lifestyle factors on body composition and fat distribution were also observed (online Supplementary Figure 3–8).
Joint analyses of lifestyle and PRS with body composition and fat distribution. (a) Joint effects for BMI, FMI and FFMI; (b) joint effects for AFR, TFR and LFR. Linear regression models were adjusted for age, race, menopausal status, education, Townsend deprivation index and the first ten principal components of ancestry. Women with high PRSs and an unfavourable lifestyle were regarded as the reference for BMI, FMI, FFMI, AFR and TFR, while those with low PRS and an unfavourable lifestyle were regarded as the reference for LFR. FMI, fat mass index; FFMI, fat-free mass index; AFR, arm fat ratio; TFR, trunk fat ratio; LFR, leg fat ratio.

Figure 4. Long description
A dot plot showing joint effects of PRS and lifestyle on body composition and fat distribution. The plot is divided into two sections, A and B. Section A shows the joint effects on BMI, FMI, and FFMI, while Section B shows the joint effects on AFR, TFR, and LFR. Each section is further divided into subgroups based on PRS levels (High, Intermediate, Low) and lifestyle categories (Unfavorable, Intermediate, Favorable). The x-axis represents percentage differences with 95 percent confidence intervals, and the y-axis lists the subgroups. The dots represent the data points for each subgroup, with different colors indicating different measures. The plot highlights significant interactions with P values indicated for each measure. The data points show varying effects of PRS and lifestyle on different body composition and fat distribution measures. All values are approximated.
Discussion
In this study, we observed that women who adhered to a favourable lifestyle had lower FMI, along with less fat distributed in the arms and trunk and more fat in the legs relatively. The associations of a favourable lifestyle with body composition and fat distribution remained significant across different genetic risk levels. Participants with a favourable lifestyle and low PRS had the lowest BMI, FMI, FFMI, AFR and TFR, respectively. However, participants with a favourable lifestyle and high PRS for LFR had the highest LFR. There were significant interactions between lifestyle factors and genetic risk on BMI, FMI and AFR.
Consistent with previous studies, a healthy lifestyle was inversely associated with body fat accumulation(Reference Xu, Greene and Earp15,Reference Liao, Hu and Imm16,Reference Wadden, Tronieri and Butryn25) . Positive associations of a healthy lifestyle with FFMI among women indicated that maintaining a healthy lifestyle might increase lean mass, which is indicative of physical functionality and shows health benefits. Regarding body fat distribution, the association of a favourable lifestyle with LFR was opposite to that observed with AFR and TFR, suggesting region-specific differences. However, because AFR, TFR and LFR represent proportions of total body fat, these differences may primarily reflect proportional shifts associated with overall fat mass reduction rather than true redistribution of fat between regions. Although prior studies suggest physiological differences between upper-and lower-body adipose tissue, our data cannot distinguish proportional changes from true redistribution(Reference Karpe and Pinnick26). Future studies incorporating repeated measures of regional fat distribution are needed to clarify these mechanisms.
Given the inverse health effects of upper body fat and lower body fat(Reference Chen, Arthur and Iyengar7,Reference Snijder, Dekker and Visser9) , we supposed that adopting a healthy lifestyle might promote a healthier body fat distribution pattern, characterised by a higher fat ratio in the legs and a lower fat ratio in the trunk accordingly. Considering the observed associations between a healthy lifestyle, healthy fat distribution and health outcomes, it is plausible that the beneficial associations of a favourable lifestyle with health were partially mediated by a healthier body fat distribution pattern. However, more studies are required to unveil these associations.
Genetic factors play an important role in body composition and fat distribution. However, the investigations on the interactions and joint effects of lifestyle factors and genetic risk on body composition and fat distribution remain limited. The present study indicated that the associations of a healthy lifestyle with body composition and fat distribution persisted across each level of genetic risk. These findings supported that even participants with high genetic risk could have lower whole-body fat and healthier body fat distribution by benefiting from a healthy lifestyle. Furthermore, significant interactions between lifestyle factors and genetic risk on body composition and fat distribution were observed, suggesting that female participants with a high genetic risk for BMI, FMI, or AFR were more likely to benefit from a favourable lifestyle and achieve a bigger reduction in BMI, FMI or AFR. The underlying mechanisms for the gene–environment interaction are still unclear and remain to be further explored.
This study has several strengths. First, the large sample size based on the UK Biobank cohort enabled us to give reliable findings. Second, our study constructed a comprehensive healthy lifestyle score by integrating multiple lifestyle factors including a healthy sleep pattern and investigated the combined associations of the six healthy lifestyle behaviours with body composition and fat distribution. Besides, we assessed the interaction and joint relationships between lifestyle behaviours and genetic risk with body composition and fat distribution.
We also acknowledge several limitations. First, this was a cross-sectional study in which lifestyle behaviours, body composition and fat distribution were assessed at a single time point, precluding causal inference. Prospective cohort studies are warranted to confirm these findings. Second, lifestyle factors were self-reported, which may lead to misclassification of lifestyle risk levels. Third, the study cannot distinguish subcutaneous fat, visceral fat and intermuscular fat. Further studies need to be conducted to clarify the associations of lifestyle behaviours with visceral fat, subcutaneous fat and intermuscular fat. Fourth, the lifestyle score was constructed using equal weighting and therefore does not account for potential differences in the relative importance of individual lifestyle factors. Fifth, there was partial sample overlap between the GWAS used to derive the PRS and the UK Biobank cohort, which may have introduced bias and potentially inflated the observed associations. Finally, the majority of participants in the study were White British, and thus the generalisability of our findings in other populations needs to be assessed.
Conclusion
Women who adhere to a favourable lifestyle are more likely to have a healthy body composition and fat distribution. The associations between a healthy lifestyle and body composition and fat distribution persisted across each level of genetic risk, and there were joint effects between healthy lifestyle and genetic factors. This study supported the individual and combined associations of modifiable lifestyle behaviours and genetic risk with body composition and fat distribution. Further large-scale prospective studies are required to confirm the associations of lifestyle behaviours and genetic factors with body composition and fat distribution.
Acknowledgements
We are grateful to the participants and staff of the UK Biobank. This study was performed using data from the UK Biobank under Application 84980. The computation is completed in the HPC Platform of Huazhong University of Science and Technology.
This work was supported by the Young Top–notch Talent Cultivation Program of Hubei Province and the Natural Science Fund for Distinguished Young Scholars of Hubei Province (2020CFA067).
H. L., Investigation, Resources, Data curation, Formal Analysis, Writing – Original Draft; C. Z., Investigation, Resources, Data curation, Formal analysis, Writing – Original Draft; S. Z., Investigation, Resources, Writing – Review & Editing; Q. S., Investigation, Resources, Writing – Review & Editing; S. W., Resources, Writing – Review & Editing; P. L., Data curation, Writing – Review & Editing; C. Z., Visualisation, Writing – Review & Editing; Q. W., Visualisation, Writing – Review & Editing; X. C., Visualisation, Writing – Review & Editing; Y. Q., Visualisation, Writing – Review & Editing; R. H., Visualisation, Writing – Review & Editing; J. C., Funding acquisition, Writing – Review & Editing; L. L., Supervision, Writing – Review & Editing; X. C., Conceptualisation, Methodology, Writing – Review & Editing, Supervision, Project administration; R. Z., Conceptualisation, Methodology, Writing – Review & Editing, Supervision, Project administration, Funding acquisition.
The author(s) declare no conflicts of interest.
The UK Biobank study was ethically approved by the North West Multi-center Research Ethics Committee. Written informed consent has been obtained from all participants.
Supplementary material
For supplementary material/s referred to in this article, please visit https://doi.org/10.1017/S0007114526107429