Implications
Trans-10, cis-12 CLA isomer is known to have milk fat reducing properties. Hence, CLA may have the potential to counteract negative energy balances and further may reduce metabolic imbalances of early lactating cows. However, possible CLA impacts on metabolism and immune function have not been sufficiently investigated during the transition period. Effects on blood metabolite concentration and proliferation of PBMC of periparturient cows receiving different concentrate feed proportions a.p. were studied to evaluate possible impacts of CLA on metabolism and immune function. Compared with adapted feeding, high-concentrate diet a.p. should induce a ketogenic metabolic situation p.p. to better understand how CLA works.
Introduction
CLAs are a group of positional and geometric isomers of linoleic acid characterized by conjugated double bonds. Especially, trans-10, cis-12 CLA isomer is frequently added to dairy cow diets, because of its milk fat reducing properties (Baumgard et al., Reference Baumgard, Corl, Dwyer, Saebo and Bauman2000) and their potential to counteract a negative energy balance during early lactation (Odens et al., Reference Odens, Burgos, Innocenti, VanBaale and Baumgard2007). Consequently, dietary CLA supplementation may induce a reduction of metabolic imbalances of early lactating cows, which may be reflected in altered blood metabolite concentrations (Odens et al., Reference Odens, Burgos, Innocenti, VanBaale and Baumgard2007). Furthermore, the impact of supplemented CLA on the immune system of dairy cows has been rarely investigated. In particular, little is known about CLA effects on the function of bovine peripheral blood mononuclear cells (PBMCs) during the transition period. Dairy cows are known to have a suppressed immune system in this time (Vangroenweghe et al., Reference Vangroenweghe, Lamote and Burvenich2005), reflected in a reduced response of PBMCs to mitogen-stimulation (Nonnecke et al., Reference Nonnecke, Kimura, Goff and Kehrli2003; Loiselle et al., Reference Loiselle, Ster, Talbot, Zhao, Wagner, Boisclair and Lacasse2009). The underlying reasons are not entirely clear, but Lacetera et al. (Reference Lacetera, Scalia, Franci, Bernabucci, Ronchi and Nardone2004) assumed that increased blood non-esterified fatty acid (NEFA) concentrations, as occurring through increased body fat mobilization around parturition, have a negative influence on the function of PBMCs and thus may be responsible for the immunosuppression of transition cows.
Hence, an experiment with dairy cows during the transition period was used to study the effects of a CLA addition on metabolism and immune function. The experiment was previously described in detail by Petzold et al. (Reference Petzold, Meyer, Kersten, Spilke, Kramer, Jahreis and Dänicke2013). The objective of the trial was to investigate the influence of supplemented CLA on blood metabolite concentrations and proliferation of PBMCs of cows fed low- or high concentrate proportions in the diet antepartum (a.p.). The high-concentrate level was fed to induce a ketogenic metabolic situation of cows postpartum (p.p.) (Hayirli and Grummer, Reference Hayirli and Grummer2004) for a better examination of the supposed lipid metabolism modifying properties of added CLA. It was expected that dietary supplemented CLA reduce metabolic disturbances of early lactating cows owing to a decreased milk energy output and thus improved negative energy balance in this time. Blood NEFA concentration might be reduced via decreased adipose tissue mobilization, which in turn might ameliorate effects of immunosuppression. Furthermore, lower blood NEFA concentrations might reduce liver stress at the onset of lactation, may reflect in blood metabolites, especially activities of liver enzymes. Moreover, a group-specific termination of CLA addition in the p.p. period was performed to determine possible post-treatment effects.
Material and methods
Experimental design, animals and feeding
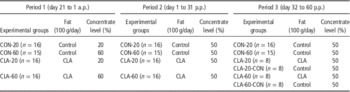
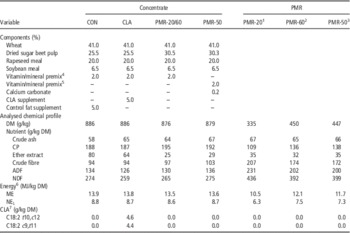
The study was performed at the Experimental Station of the Institute of Animal Nutrition, Friedrich-Loeffler-Institute in Brunswick, Germany, according to European Community regulations concerning the protection of experimental animals. The present trial was part of a comprehensive feeding study, which was previously described in detail by Petzold et al. (Reference Petzold, Meyer, Kersten, Spilke, Kramer, Jahreis and Dänicke2013). Briefly, 64 pregnant German Holstein cows (48 pluriparous, 762±14 kg and 16 primiparous, 640±11 kg) were assigned to one of four dietary treatments according to mean number of lactation (1.7±0.2) and fat-corrected milk yield of previous lactation (5938±160 kg, 200 day milk yield). It was ensured that the number of primiparous cows was randomly assigned to treatments. The trial was divided into three periods and started on day 21 a.p. and was terminated on day 60 p.p. The experimental design is shown in Table 1. Three weeks before calving (Period 1), group CON-20 (n=16) and CLA-20 (n=16) received 100 g/day control fat (CON) or CLA supplement in a low (20%) concentrate diet, whereas group CON-60 (n=16) and CLA-60 (n=16) were fed 100 g/day CON or CLA supplement in a high (60%) concentrate diet. Cows had ad libitum access to partial mixed rations (PMRs) consisting of 20% or 60% concentrate and 80% or 40% roughage (60% corn silage and 40% grass silage on dry matter (DM) basis), respectively. PMRs were offered in self-feeding stations (type RIC; Insentec, B.V., Marknesse, The Netherlands). The fat supplements were included into 2 kg concentrate supplied via computerized concentrate feeding stations (Insentec, B.V.). A commercial rumen-protected CLA preparation (Lutrell® Pure; BASF SE, Ludwigshafen, Germany), containing 10% trans-10, cis-12 CLA and 10% cis-9, trans-11 CLA, and a rumen-protected CON preparation (Silafat®; BASF SE), containing stearic acid instead of CLAs, were used as CLA and CON supplements, respectively. Period 2 started after calving and lasted for 31 days. Cows were fed a PMR for ad libitum consumption based on 50% concentrate and 50% roughage (60% corn silage and 40% grass silage on DM basis) while fat supplementation continued. In Period 3, days 32 to 60 p.p., half of the animals of CLA-groups changed to CON supplementation (CLA-20-CON and CLA-60-CON), while in groups CLA-20 and CLA-60 the CLA supplementation continued. The feeding in groups CON-20 and CON-60 was not changed. The composition of concentrates and PMRs are presented in Table 2. All diets were formulated to meet the nutritional requirements of cows stated by the Society of Nutrition Physiology (GfE, 2001). Cows had ad libitum access to water.
Experimental design

(Petzold et al., Reference Petzold, Meyer, Kersten, Spilke, Kramer, Jahreis and Dänicke2013).
Components and chemical composition of concentrates and partial mixed rations (PMR); Means

CON=control fat; DM=dry matter; ME=metabolizable energy; NEL=negative energy.
1 Antepartum PMR containing 20% concentrate on DM basis.
2 Antepartum PMR containing 60% concentrate on DM basis.
3 Postpartum PMR containing 50% concentrate on DM basis.
4 For dairy cows. Ingredients per kg mineral feed: 60 g Ca, 105 g Na, 80 g P, 50 g Mg, 7000 mg Zn, 4800 mg Mn, 1250 mg Cu, 100 mg I, 40 mg Se, 30 mg Co, 800 000 IU vitamin A, 100 000 IU vitamin D3, 1500 mg vitamin E.
5 For lactating dairy cows. Ingredients per kg mineral feed: 140 g Ca, 120 g Na, 70 g P, 40 g Mg, 6000 mg Zn, 5400 mg Mn, 1000 mg Cu, 100 mg I, 40 mg Se, 25 mg Co, 1 000 000 IU vitamin A, 100 000 IU vitamin D3, 1500 mg vitamin E.
6 Calculation based on nutrient digestibilities measured with wethers (GfE, 1991).
7 Calculation based on analysed concentrates and silage.
Sample collection and analyses
All cows were equipped with an ear transponder, which ensured that the daily individual feed and water intake was recorded continuously during the experimental period. Blood samples were obtained from Vena jugularis externa on day −21, −14, −7, −3, 1, 3, 7, 14, 21, 28, 42 and 56 relative to calving into vacutainer tubes. Blood was centrifuged at 2000×g and 15°C for 15 min after incubating 30 min at 30°C. Concentrations of albumin, aspartate amino-tranferase (ASAT), γ-glutamyl-transferase (GGT), glutamate dehydrogenase (GLDH), glucose, triglycerides, total bilirubin (Bili), total cholesterol (Chol) and total protein (Prot) in blood serum were determined photometrically by an automatic clinical chemistry analyser (Eurolyser; Qinlab Diagnostic GbR, Martinsried, Germany). IGF-1 concentration in blood serum was analysed at the Department of Obstetrics and Reproduction, Faculty of Veterinary Science of the Szent Istvan University in Budapest, Hungary. Briefly, IGF-1 blood serum concentration was measured with a 125I-labelled IGF-1-RIA CT kit developed for human samples, including a preceding extraction of IGF-1 with an ethanolic HCl solution and a before-assay neutralization of extracts (Cisbio Bioassays, Codolet, France; sensitivity: 0.85 ng/ml; intra- and inter-assay CV: from 3.4 to 6.6 and ⩽7.0%, respectively). The assay was adapted and validated for bovine plasma samples, described by Balogh et al. (Reference Balogh, Febel, Huszenicza, Kulcsar, Abonyi-Toth, Endrodi and Gabor2012).
On day −21, 7, 28 and 56 relative to calving, blood was taken by jugular venipuncture into heparinized vacutainer tubes for isolation and proliferation of bovine PBMC. Both procedures were carried out according to Renner et al. (Reference Renner, Schwabe, Doll, Holtershinken and Danicke2011). Briefly, PBMC were separated from heparinized, diluted blood by density-gradient centrifugation. After resuspension in a freezing medium based on foetal bovine serum (FBS, S 0615) and 10% dimethyl sulfoxide, PBMC were frozen and stored at −80°C until beginning of proliferation assay.
Thawed PBMC were suspended in Roswell Park Memorial Institute 1640 medium (F1275), supplemented with 5% FBS, 1 M HEPES buffer (L 1603), 2 mM l-glutamin (K 0282), 5 mM β-mercaptoethanol (M7522; Sigma-Aldrich, Steinheim, Germany), penicillin (100 U/ml) and streptomycin (A 2212, 0.1 mg/ml). Cell viability was evaluated by trypan blue exclusion technique and number of cells was adjusted to 1×10⁶ viable cells/ml. A total of 10 replications of thawed and washed PBMC (100 µl) were seeded into 96-well plates; five of them were stimulated with ConcanavalinA (ConA, 2.5 µg/ml final, C5275; Sigma-Aldrich) for proliferation test and medium were added to each of the 10 wells up to a total volume of 200 µl. The plates were incubated for 72 h at 37°C and 5% CO2. After incubation, plates were centrifuged (200 g, 6 min, room temperature) and 100 µl supernatant of each well was removed. An MTT assay (3-(4,5-dimethylthiazol-2-yl)-2,5-diphenyltetrazolium bromide) was used to test the metabolic activity of proliferating cells and MTT was added at 2.5 µg/ml to each well and incubated for another 4 h. The optical density (OD) of incubated PBMC was measured at a wavelength of 570 nm and was corrected by a blank value after dissolving the crystalline formazan product with 100 µl of 0.01 N HCl/SDS solution overnight at room temperature. The stimulation index (SI) was calculated by the ratio between OD of CON A stimulated and non-stimulated PBMC. The MTT assay was conducted as described by Goyarts et al. (Reference Goyarts, Danicke, Grovel, Tiemann and Rothotter2006).
Statistical analyses
The software package SAS (Version 9.2; SAS Institute, Cary, NC, USA) was used for all statistical evaluation.
Model:
 $$\eqalign{ y_{{ijk}} (t){\rm =}\mu {\rm {\plus}}\mathop{\sum}\limits_{r=0}^2 {(\beta _{{ir}} {\rm {\plus}}a_{{kr}} )} \cdot x_{r} (t) \cr\quad{\rm {\plus}}\mathop{\sum}\limits_{s=1}^2 {(\beta _{{i,\,2{\plus}s}}^{{\asterisk}} {\rm {\plus}}a_{{k,\,2{\plus}s}}^{{\asterisk}} )} \cdot x_{{2{\plus}s}} {\rm (}t{\rm ){\plus}}TT_{j} {\rm {\plus}}e_{{ijk}} (t)$$
where y
ijk
(t) is the observation of trait y on animal k, group i, testday j and experimental day t; β
ir
,a
ijkr
the fixed/random-regressions coefficients of group i and animal k, respectively;
 $\beta _{{i,\,2{\plus}s}}^{{\asterisk}} ,a_{{k,\,2{\plus}s}}^{{\asterisk}} $
the fixed/random-regressions coefficients of the spline function with degree 2 of group i and animal k, respectively; TT
j
the fixed effect of testday j residual effect; e
ijk
(t) the residual effect.
Covariables are defined as follows:
 $$\eqalignno{ x_{0} (t)=1;x_{1} (t)=t;x_{2} (t)=t^{2} ;x_{3} (t)\cr=((t\,\gt\, p_{1} ) \cdot (t{\minus}p_{1} ))^{2} ;x_{4} (t) \cr & =((t\,\gt \,p_{2} ) \cdot (t{\minus}p_{2} ))^{2} $$
where p 1,p 2 are the spline knots.
Blood metabolites and SI of PBMCs were processed using a random-regressions model. The model contained date of measuring day and group-specific regression coefficients, respectively, as fixed factors. The regression coefficient of each animal within the respective group and the residual effects were considered in the model as random effect. The non-linear relationships between the traits under investigation and the experimental day relative to calving were modelled by splines with two or three nodal points according to the parameters development during the experimental time to generate group-specific progressive graphs. This model enabled a better description of kinetics of investigated parameters over several experimental periods.
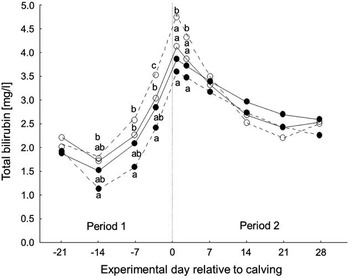
In order to generate least square means (LSMeans) for each period for the respective groups, the data were processed using the same model approach. An average estimated value of the respective period for each group was calculated and the statistical analysis was performed using the F-test and Tukey-test. The F-test between the LSMeans of each group for the respective periods was calculated by the CONTRAST-option using the PROC MIXED procedure. In the case of significances between the LSMeans of the F-test, the Tukey’s multiple range test was carried out. Differences with P<0.05 were considered to be significant and a tendency was declared when P<0.1. A P-value for the F-test between the LSMeans is provided. Results are shown as LSMeans and root mean square errors (RMSE). The generated values for each group for the respective groups are shown in Tables 3 and 4. The weekly dissolved values for each group for serum triglyceride, Bili and IGF-1 are presented as progressive graph in figures (Figures 1–3) and used to get an impression of the time-dependent course and additionally for evaluation of the development of differences between the groups.
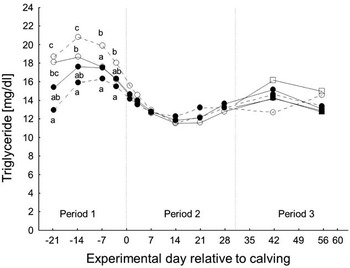
Development of triglycerides in serum. Antepartum (Period 1), group CON-20 and CLA-20 received control fat (—) or CLA (---) supplement in a low (○) and group CON-60 and CLA-60 in a high (●) concentrate diet. Postpartum, concentrate proportion was adjusted to 50% while fat supplementation continued. In Period 3 half of the animals of CLA-groups changes to control fat supplementation (CLA-20-CON (□) and CLA-60-CON (■)). a,b,cOnly significantly different least square means between the groups are marked with superscripts (P<0.05).

Development of total bilirubin in serum. Antepartum (Period 1), group CON-20 and CLA-20 received control fat (—) or CLA (---) supplement in a low (○) and group CON-60 and CLA-60 in a high (●) concentrate diet. Postpartum, concentrate proportion was adjusted to 50% while fat supplementation continued. a,bOnly significantly different least square means between the groups are marked with superscripts (P<0.05).

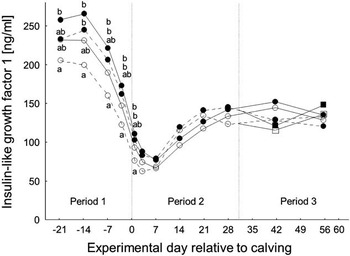
Development of IGF 1in serum. Antepartum (Period 1), group CON-20 and CLA-20 received control fat (—) or CLA (---) supplement in a low (○) and group CON-60 and CLA-60 in a high (●) concentrate diet. Postpartum, concentrate proportion was adjusted to 50% while fat supplementation continued. In Period 3 half of the animals of CLA-groups changes to control fat supplementation (CLA-20-CON (□) and CLA-60-CON (■)). a,bOnly significantly different least square means between the groups are marked with superscripts (P<0.05).

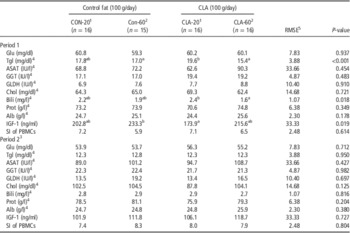
Blood metabolites and stimulation index of peripheral blood mononuclear cells of cows fed different amounts of concentrate supplemented with CLA or control fat (CON) in Period 1 (day 21 to 1 a.p.) and Period 2 (day 1 to 31 p.p.); LSMeans

RMSE=root mean square error; Gluc=glucose; Tgl=triglyceride; ASAT=aspartate amino-transferase; GGT=γ-glutamyl-transferase; GLDH=glutamate dehydrogenase; Chol=total cholesterol; Bili=total bilirubin; Prot=total protein; Alb=albumin; SI of PBMCs=stimulation index of peripheral blood mononuclear cells.
a,bValues within a row with different superscripts differ significantly at P<0.05.
Tgl: 15 to 45 mg/dl; ASAT: <80 IU/l; GGT: <50 IU/l; GLDH: <30 IU/l; Chol: >75 mg/dl; Bili: <3 mg/dl; Prot: 60 to 80 g/l; Alb: 30 to 42 g/l.
1 Antepartum, group CON-20 and CLA-20 received a low-concentrate diet.
2 Antepartum, group CON-60 and CLA-60 received a high-concentrate diet.
3 Postpartum, concentrate proportion was adjusted to 50% while fat supplementation continued.
4 Reference values according to Kraft and Dürr (Reference Kraft and Dürr2005).
5 Depending on the statistical model, only 1 RMSE/trait exist for the entire experimental period.
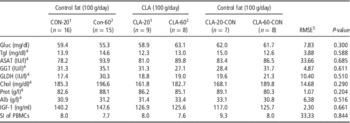
Blood metabolites and stimulation index of peripheral blood mononuclear cells of cows fed different amounts of concentrate supplemented with CLA or control fat (CON) in Period 3 (day 32 to 60 p.p)Footnote 3 ; LSMeans

RMSE=root mean square error; Gluc=glucose; Tgl=triglyceride; ASAT=aspartate amino-transferase; GGT=γ-glutamyl-transferase; GLDH=glutamate dehydrogenase; Chol=total cholesterol; Prot=total protein; Alb=albumin; SI of PBMCs=stimulation index of peripheral blood mononuclear cells.
Tgl: 15 to 45 mg/dl; ASAT: <80 IU/l; GGT: <50 IU/l; GLDH: <30 IU/l; Chol: >75 mg/dl; Prot: 60 to 80 g/l; Alb: 30 to 42 g/l.
1 Antepartum, group CON-20 and CLA-20 received a low-concentrate diet.
2 Antepartum, group CON-60 and CLA-60 received a high-concentrate diet.
3 Postpartum, concentrate proportion was adjusted to 50% while fat supplementation continued. In Period 3, half of the animals of CLA-groups changes to control fat supplementation (CLA-20-CON and CLA-60-CON).
4 Reference values according to Kraft and Dürr (Reference Kraft and Dürr2005).
5 Depending on the statistical model, only 1 RMSE/trait exist for the entire experimental period.
Results
Descriptive results
Based on analyses of concentrates and silages (Table 2), group CLA-20 and CLA-60 received in total ~8 g/day trans-10, cis-12 and cis-9, trans-11 CLA, respectively. Dry matter intake (DMI) decreased slightly with progressing pregnancy and increased consistently p.p. More data concerning the performance of cows used in the present study are reported by Petzold et al. (Reference Petzold, Meyer, Kersten, Spilke, Kramer, Jahreis and Dänicke2013). Measured serum metabolite concentrations and SI of PBMC changed in the course of the trial (Tables 3 and 4 and Figures 1–3). Serum concentrations of ASAT, GGT, GLDH, Chol, Bili and Prot increased with processing experimental time (ASAT from 74 to 98 to 85 IU/l, GGT from 18 to 22 to 31 IU/l, GLDH from 8 to 16 to 21 IU/l, Chol from 65 to 100 to 181 mg/dl, Bili from 2 to 3 mg/l and Prot from 73 to 79 to 85 g/l), whereby serum glucose showed reduced concentrations in Period 2 (from 60 to 55 to 60 mg/dl). For serum albumin similar concentrations could be observed. Serum triglyceride and IGF-1 concentrations decreased after calving, followed by a slight increase in Period 3 (triglyceride from 18 to 12 to 14, IGF-1 from 206 to 110 to 131 ng/ml). SI of PBMC was reduced around calving and increased slightly p.p. (SI of PBMCs from 7 to 8 to 8).
Model results
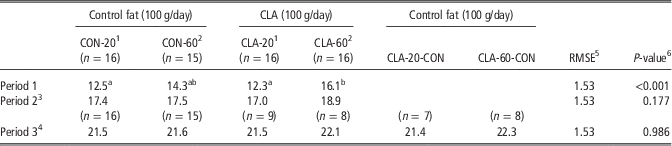
In Period 1, Group CLA-60 consumed significantly more DM compared with low-concentrate groups (Table 5). With exception of serum triglyceride, Bili and IGF-1 in Period 1, measured blood metabolites and SI of PBMC were not influenced by the treatments during experimental periods (Tables 3 and 4). Group CLA-20 showed significantly increased serum triglyceride concentrations compared with group CON-60 and CLA-60 in Period 1 (Table 3) and to group CON-20 on day 14 and 7 a.p. when comparing weekly dissolved values (Figure 1). Serum Bili concentration of group CLA-20 was significantly increased compared with group CLA-60 before calving (Table 3) and to all remaining groups on day 1 and 3 p.p. (Figure 2). Reduced IGF-1 concentrations were observed for group CLA-20 compared with CON-60 in Period 1 (Table 3). When comparing weekly dissolved values, group CLA-20 had lower IGF-1 concentrations than high-concentrate groups before and shortly after calving (Figure 3). Even if serum Prot and albumin concentration remained unaffected by treatments (Table 3), differences between the groups occurred when comparing weekly dissolved values for each group over the whole experiment. Significantly reduced Prot serum concentrations were observed for group CLA-20 compared with CLA-60 1 week before and shortly after calving. In addition, serum albumin concentration was significantly reduced compared with high-concentrate groups within the 1st week p.p. and to all groups in week 2 and 3 p.p. (data not shown). Blood metabolites were within the reference range according to Kraft and Dürr (Reference Kraft and Dürr2005), besides lower serum concentrations of Chol and albumin in Period 1, increased serum Bili concentrations around calving (Figure 2) and reduced triglyceride and higher ASAT serum concentrations in Period 2.
Dry matter intakes of cows fed different amounts of concentrate supplemented with CLA or control fat (CON) in Period 1 (day 21 to 1 a.p.), Period 2 (day 1 to 31 p.p.) and Period 3 (day 32 to 60 p.p.); LSMeans

RMSE=root mean square error.
(Petzold et al., Reference Petzold, Meyer, Kersten, Spilke, Kramer, Jahreis and Dänicke2013).
a,bValues within a row with different superscripts differ significantly at P<0.05.
1 Group CON-20 and CLA-20 received a low-concentrate diet antepartum.
2 Group CON-60 and CLA-60 received a high-concentrate diet antepartum.
3 Postpartum, concentrate proportion was adjusted to 50% while fat supplementation continued.
4 Half of the animals of CLA-groups changes to control fat supplementation (CLA-20-CON and CLA-60-CON).
5 Depending on the statistical model, only 1 RMSE/trait exist for the entire experimental period.
6 Data were processed using a random-regressions model with fixed regression coefficients for groups and random regression coefficients to take into consideration repeated measures per animal, as described in detail in statistical analysis.
Discussion
The present study was part of a more comprehensive feeding study, where CLA was dietary supplemented, in a dose able to reduce milk energy output, to clarify the question if CLA has an impact on energy and lipid metabolism of periparturient dairy cows (Petzold et al., Reference Petzold, Meyer, Kersten, Spilke, Kramer, Jahreis and Dänicke2013). In particular, this study aimed to investigate effects of CLA supplementation and various concentrate proportion in diets during late pregnancy on blood metabolites and SI of PBMC of periparturient dairy cows to evaluate possible CLA impacts on metabolism and immune function. CLA supplementation was initiated 21 days before anticipated calving and continued until day 60 p.p., whereby a group-specific termination of CLA supplementation after day 32 p.p. was conducted to determine possible post-treatment effects. Cows received diets with either a low or high-concentrate diet a.p., whereby the high-concentrate proportion was fed to induce a ketogenic metabolic situation of cows p.p. for a better examination of the supposed lipid metabolism modifying properties of added CLA. Overconditioning is negatively related to DMI a.p. and obese cows are observed to have a reduced appetite and lose more BW in early lactation. Owing to inadequate DMI p.p., overconditioned cows are subjected to increased body fat mobilization and are therefore more susceptible to metabolic diseases, like ketosis (Grummer, Reference Grummer1995; Hayirli and Grummer, Reference Hayirli and Grummer2004). However, DMI of group CLA-60 and CON-60 fed a high-concentrate proportion was not observed to be reduced during early lactation, which is contrary to the literature (Grummer, Reference Grummer1995; Hayirli and Grummer, Reference Hayirli and Grummer2004). Maybe, the time of overfeeding in the dry period was too short or the energy supply during early lactation (50% concentrate proportion in the diet) was too high to induce a reduction in DMI p.p. In addition, live weight and blood NEFA and BHB concentrations, which are generally used to assess the body fat mobilization and energy deficit in early lactating cows, remained unaffected during the p.p. period between the groups (Petzold et al., Reference Petzold, Meyer, Kersten, Spilke, Kramer, Jahreis and Dänicke2013). Consequently, a ketogenic metabolic state was not achieved and hence respective impacts of CLA could not be examined (Petzold et al., Reference Petzold, Meyer, Kersten, Spilke, Kramer, Jahreis and Dänicke2013). Perhaps, a longer overfeeding period a.p. or feed intake restriction or deprivation during early lactation, as realized in other trials (Loor et al., Reference Loor, Everts, Bionaz, Dann, Morin, Oliveira, Rodriguez-Zas, Drackley and Lewin2007; Kuhla et al., Reference Kuhla, Albrecht, Kuhla and Metges2009; Schulz et al., Reference Schulz, Frahm, Meyer, Kersten, Reiche, Rehage and Danicke2014), might have been a more successful approach to induce a ketotic state p.p.
Moreover, milk composition and milk yield of cows used in the present study also remained unaffected by the treatments, whereas CLA supplementation in a high-concentrate diet a.p. causes an improvement in estimated energy balance p.p. through increasing DMI (Petzold et al., Reference Petzold, Meyer, Kersten, Spilke, Kramer, Jahreis and Dänicke2013). Even if, CLA supplementation has clearly been established by significantly increased proportions of trans-10, cis-12 CLA in milk fat of CLA-groups compared with CON-groups on day 21 p.p., an insufficient CLA rumen protection against microbial degradation and hence relatively low amounts of available CLA in the duodenum could have led to a lack of CLA effects (Petzold et al., Reference Petzold, Meyer, Kersten, Spilke, Kramer, Jahreis and Dänicke2013).
CLA effects on blood parameters
As described in the last section, the improvement in estimated energy balance p.p. of group VLA-60 revealed that CLA supplements may be able to reduce metabolic disorders. However, blood NEFA and BHB values remained unaffected (Petzold et al., Reference Petzold, Meyer, Kersten, Spilke, Kramer, Jahreis and Dänicke2013), indicating that CLA supplements did not alter body lipid mobilization and thus metabolism of early lactating cows. Moreover, blood glucose concentration remained unchanged by CLA supplementation, which is in accordance with other long-term studies during transition period and during early or established lactation (Perfield et al., Reference Perfield, Bernal-Santos, Overton and Bauman2002; Bernal-Santos et al., Reference Bernal-Santos, Perfield, Barbano, Bauman and Overton2003; Moore et al., Reference Moore, Hafliger, Mendivil, Sanders, Bauman and Baumgard2004; Selberg et al., Reference Selberg, Lowe, Staples, Luchini and Badinga2004; Castaneda-Gutierrez et al., Reference Castaneda-Gutierrez, Overton, Butler and Bauman2005; Kay et al., Reference Kay, Roche, Moore and Baumgard2006; Sigl et al., Reference Sigl, Schlamberger, Kienberger, Wiedemann, Meyer and Kaske2010; von Soosten et al., Reference von Soosten, Dänicke, Meyer, Weber, Rehage and Flachowsky2011) and short-term experiments (Baumgard et al., Reference Baumgard, Corl, Dwyer, Saebo and Bauman2000 and Reference Baumgard, Corl, Dwyer and Bauman2002), revealing that CLA does not have an influence on glucose level. Overall, CLA supplementation did not affect investigated blood metabolites, which confirm observations from previous studies (Baumgard et al., Reference Baumgard, Corl, Dwyer and Bauman2002; Bernal-Santos et al., Reference Bernal-Santos, Perfield, Barbano, Bauman and Overton2003; Liermann, Reference Liermann2008; Sigl et al., Reference Sigl, Schlamberger, Kienberger, Wiedemann, Meyer and Kaske2010). Results demonstrate that dietary supplemented CLA does not have an impact on metabolism of periparturient dairy cows.
Concentrations of investigated blood metabolites were mainly affected by variations in feed intake. DMI was reduced around calving and coincides with higher blood NEFA values. Around and especially immediately after calving, increased blood NEFA concentrations were paralleled by low triglyceride, cholesterol and IGF-1 and high bilirubin values. Perhaps, the liver function may be reduced owing to lower DMI and consequently sustained lipid mobilization. However, group CLA-20 was affected more severe than group CLA-60, which may result from the observed differences in DMI. Cell and liver damage indicating enzymes like GGT and GLDH remained unaffected by treatments during the entire experimental period and were within their reference range according to Kraft and Dürr (Reference Kraft and Dürr2005). Only ASAT showed higher activities after calving. However, increased ASAT activities are not necessary pathological owing to the fact that liver cells need to adapt to a greater turnover rate of lipids during early lactation (Bostedt, Reference Bostedt1974). Hence, there was no indication that liver cells were damaged at this time. Compared with the other groups, cows of group CLA-20 may only have had a less optimal energy and nutrient supply and thus greater liver stress and a severely impaired metabolism around calving via reduced DMI.
CLA effects on immune function
Data regarding CLA effects on bovine immune function were rarely investigated. Renner et al. (Reference Renner, Pappritz, Kramer, Kersten, Jahreis and Dänicke2012a) examined the fatty acid profile and proliferation of PBMC after a long-term supplementation (day 1 to 189 p.p.) of either 4 or 8 g trans-10, cis-12 CLA per day to dairy cows and observed that supplemented CLA influenced the fatty acid profile in bovine PBMC. The proportion of trans-10, cis-12 CLA of total fatty acids in bovine PBMC was observed to be increased, whereas the proportion of trans-9 C18 : 1 and cis-12 C24 : 1 was reduced. However, observed alterations in the fatty acid profile did not have an impact on the function of PBMC since no differences in the mitogen-induced activation of PBMC were observed (Renner et al., Reference Renner, Pappritz, Kramer, Kersten, Jahreis and Dänicke2012a). Results indicate that the function of bovine PBMC was not influenced by CLA supplementation, which agrees with findings from other studies (Hussen et al., Reference Hussen, Dänicke and Schuberth2011; Renner et al., Reference Renner, von Soosten, Sipka, Döll, Beineke, Schuberth and Dänicke2012b) and the present observation. No differences in mitogen-stimulated proliferation of PBMC could be observed between the groups during experimental periods.
However, the mitogen-stimulated proliferation of PBMC was reduced around calving and rose with progressing lactation in each group. This is in accordance with other studies (Dänicke et al., Reference Dänicke, Kowalczyk, Renner, Pappritz, Meyer, Kramer, Weber, Döll, Rehage and Jahreis2012; Renner et al., Reference Renner, Pappritz, Kramer, Kersten, Jahreis and Dänicke2012a and Reference Renner, von Soosten, Sipka, Döll, Beineke, Schuberth and Dänicke2012b), also observing that the SI changed in the course of lactation. Dairy cows are known to be immune compromised around parturition (Mallard et al., Reference Mallard, Dekkers, Ireland, Leslie, Sharif, Vankampen, Wagter and Wilkie1998), reflected in an impaired lymphocyte function (Franklin et al., Reference Franklin, Young and Nonnecke1991; Goff, Reference Goff2006) and also in a reduced response of PBMC to mitogen-stimulation (Nonnecke et al., Reference Nonnecke, Kimura, Goff and Kehrli2003; Loiselle et al., Reference Loiselle, Ster, Talbot, Zhao, Wagner, Boisclair and Lacasse2009). Consequently, findings indicate a depressed immune function of dairy cows around parturition. Lacetera et al. (Reference Lacetera, Scalia, Franci, Bernabucci, Ronchi and Nardone2004) observed that NEFA reduce the mitogen-stimulated proliferation of PBMC in a dose-dependent manner. Hence, higher NEFA concentrations, as occurring through increased body fat mobilization, are discussed to contribute to immune modulation in dairy cows around calving. In the present study, NEFA serum concentrations increased shortly a.p. and were highest within the 1st week of lactation in each group (Petzold et al., Reference Petzold, Meyer, Kersten, Spilke, Kramer, Jahreis and Dänicke2013), which coincides with reduced SI of PBMC. In addition, Renner et al. (Reference Renner, von Soosten, Sipka, Döll, Beineke, Schuberth and Dänicke2012b) observed that the ability to stimulate PBMC was lowest (at day 1 p.p.), when NEFA blood concentration were increased and reached their peak (von Soosten et al., Reference von Soosten, Dänicke, Meyer, Weber, Rehage and Flachowsky2011). With the progress of lactation, the SI of PBMC increased while blood NEFA concentration decreased, as also reported by Renner et al. (Reference Renner, von Soosten, Sipka, Döll, Beineke, Schuberth and Dänicke2012b). This observation may confirm the inverse correlation between the function of PBMC and blood NEFA concentration (Lacetera et al., Reference Lacetera, Scalia, Franci, Bernabucci, Ronchi and Nardone2004).
Moreover, it was expected that CLA, supplemented in a dose able to induce a milk fat reduction, reduces lipid mobilization during early lactation, resulting in reduced NEFA concentrations around calving and thus may improve capability to stimulate the immune system. However, CLA supplementation neither influenced milk energy output nor blood NEFA values nor the mitogen-stimulated proliferation of PBMC in the present study, indicating that CLA did not have the potential to ameliorate the effects of a compromised immune function. This assumption can be confirmed by previous studies, observing unaffected NEFA levels and stimulation indices even if CLA supplementation led to a milk fat reduction (Pappritz et al., Reference Pappritz, Meyer, Kramer, Weber, Jahreis, Rehage, Flachowsky and Dänicke2011; von Soosten et al., Reference von Soosten, Dänicke, Meyer, Weber, Rehage and Flachowsky2011; Renner et al., Reference Renner, Pappritz, Kramer, Kersten, Jahreis and Dänicke2012a and Reference Renner, von Soosten, Sipka, Döll, Beineke, Schuberth and Dänicke2012b).
Conclusion
A ketogenic metabolic state p.p. was not achieved and respective impacts of CLA could not be examined. The evaluation of blood data and mitogen-stimulated proliferation of bovine PBMC ex vivo indicate that dietary supplemented CLA did not have positive effects on metabolism and immune function of periparturient dairy cows. No post-supplementation effects could be observed. Measured blood metabolites were mainly affected by differences in DMI, resulting from different concentrate proportions a.p. and CLA addition. All cows were subjected to metabolic challenges around calving through limited DMI potential and tended to develop liver diseases in this time, whereby cows of Group CLA-20 were affected more severely. It seems that feeding CLA in a low-concentrate diet prepartum leads to increase liver stress around calving via reduced DMI. Further studies are necessary to examine the underlying metabolic mechanism of observed effects.
Acknowledgements
The first author thanks the Gesellschaft der Freunde des Thünen-Instituts e.V. for financial support. The assistance of co-workers of the Institute of Animal Nutrition and the Experimental Station of the Friedrich-Loeffler-Institute (FLI) in Brunswick, Germany, is gratefully acknowledged in performing the experiment and analyses. Furthermore, the authors would like to thank Dr Kulcsar-Huszenicza, Department Obstetrics and Reproduction, Szent Istvan University in Budapest for the determination of IGF-1 concentration in blood serum.