Introduction
One of the best known attributes of the West African Dwarf (WAD) breed of small ruminants is trypanotolerance, a genetically determined trait, which has been defined as the ability to survive, reproduce and remain productive under trypanosomosis risk without the need for the use of chemicals to control the vectors or drugs to control the parasite (Goossens et al., Reference Goossens, Osaer, Ndao, Van Winghem and Geerts1999). Recent studies on the WAD goat of the humid zone of Nigeria have shown that this trypanotolerant goat breed is also endowed with strong innate capacity to control and to show resilience to infections with its native strain of the highly pathogenic stomach worm, Haemonchus contortus, to a degree that has not been observed to occur in any other goat breed, including WAD goats from other parts of West Africa. Under field conditions an estimated 80% of the goat population, the strong-responder phenotypes, in that part of Nigeria express this strong resistance and resilience to the nematode parasite, which has been termed haemonchotolerance (Fakae et al., Reference Fakae, Musongong, Chiejina, Behnke, Ngongeh and Wakelin2004). It was subsequently shown that haemonchotolerance was unaffected by concurrent Trypanosoma brucei infection (Chiejina et al., Reference Chiejina, Musongong, Fakae, Behnke, Ngongeh and Wakelin2005), which makes the humid-zone WAD goat in Nigeria unique among trypanotolerant breeds of ruminants in West Africa, since in other breeds concurrent trypanosome–GI nematode, especially H. contortus, infections are accompanied by greatly enhanced pathogenicity of the nematode, as is the case in N'dama cattle (Kaufmann et al., Reference Kaufmann, Dwinger, Haliebeek, van Dijk and Pfister1992), diminished antibody response to the nematode (Faye et al., Reference Faye, Osaer, Goosens, Van Winghem, Dorny, Lejon, Losson and Geerts2002) and, in some cases, almost complete loss of trypanotolerance, as was demonstrated in Djallonke sheep (Goossens et al., Reference Goossens, Osaer, Jaiter, Ndao and Geerts1997).
The other major resource population of trypanotolerant WAD goats in Nigeria is found in the savanna zone of northern Nigeria, where the likelihood of contact between this ecotype and Sahelian breeds, and therefore introgression of genes into the former population, exist. This relatively larger and faster-growing WAD goat, overtly distinct from the humid-zone WAD goat (Chiejina et al., Reference Chiejina, Behnke, Nnadi, Ngongeh and Musongong2009), but not yet genetically characterized, is gradually being introduced into the humid zone for crossing with the humid-zone ecotype, because it is regarded locally as more productive than the latter. It is therefore of interest to assess the current status of its resistance and resilience to trypanosome and GI nematode infections in order to ascertain: (1) the extent and levels of naturally occurring, concurrent GI nematode and trypanosome infections in this WAD goat ecotype; (2) the individual variability in resistance and resilience to dual infections with these parasites in nature in that geo-climatic zone; and (3) whether significant attenuation or loss of parasite resistance and resilience to trypanosomosis has occurred in the goat population. This report presents data from a survey conducted on a savanna WAD goat population in Benue State, northern Nigeria, naturally exposed to concurrent trypanosome–GI nematode infections. Following Chiejina et al. (Reference Chiejina, Behnke, Nnadi, Ngongeh and Musongong2009), we tested the hypothesis that under field conditions this WAD goat ecotype, like its humid-zone counterpart, is innately trypanotolerant and GI nematode resistant, with no significant mutual enhancement of the pathogenicity of the parasites and no attenuation of host resilience to trypanosomosis in concurrent infections.
Materials and methods
The study area
Two large goat markets located at Gboko town and Akpagher village, 20 km apart, in the savanna belt of Benue State, Nigeria, were used for the study. Both are popular markets for the sale of traditionally reared goats by small-scale goat producers from several rural communities in the area. No anthelmintic, trypanocidal treatment or other formal parasite control measures are used in this system of husbandry. The rainy season is from May to early October, with a peak in July/August and a hot dry season from November to April, when no rain falls, excepting, in some years, occasional light rain in late April and late October. The total annual and average monthly rainfalls are 1291.93 mm and 107.67 mm, respectively. In 2006, when this study was conducted, the total annual and average monthly rainfalls were 1273.6 mm and 106.13 mm, respectively. Pasture infestation with GI nematode infective larvae (L3) and transmission of infection occur exclusively during the rains in the Nigerian savanna (Ogunsusi, Reference Ogunsusi1979; Chiejina et al., Reference Chiejina, Fakae and Eze1989).
Visits and collection of samples
Visits were made to the two markets every 5 days between April and September 2006. The design of the study and methods of sample collection were similar to those described by Behnke et al. (Reference Behnke, Chiejina, Musongong, Fakae, Ezeokonkwo, Nnadi, Ngongeh, Ebene and Wakelin2006). At each visit to each of the markets fresh faecal samples were collected from 15–20 goats that had no signs of diarrhoea, pyrexia or respiratory symptoms. This precaution was in order to avoid spreading the highly infectious, enzootic viral disease of small ruminants, pest petits des ruminants (PPR) by project personnel. Male and female goats were sampled to cover four broad age classes, 9–12, 13–16, 17–18 and>18 months, representing animals with the following experience of exposure to wet-season pasture larval infestation: ≤ 1: between 1 and 2; 2; and >2 wet seasons. The approximate ages of the goats were determined from information supplied by their owners, which we confirmed from examination of their dentition (Nnadi et al., Reference Nnadi, Kamalu and Onah2007). Physical examinations were used to identify and eliminate suspected cases of pregnancy from the sampling. One millilitre of whole blood was collected from goats by jugular venepuncture into labelled, plastic bijou bottles each containing 4 μl of heparin. All samples were transported to the laboratory in an ice box, which ensured that they arrived at the laboratory in a cold, fresh condition.
Faecal egg counts
Faecal egg counts (FEC), expressed as eggs/g of faeces (epg), were carried out within 1 h of arrival at the laboratory, using a modified McMaster and the centrifugal salt flotation techniques, as appropriate, as described in MAFF (1977) and by Fakae et al. (Reference Fakae, Chiejina, Behnke, Ezeokonkwo, Nnadi, Onyenwe, Gilbert and Wakelin1999).
Differential strongyle larval counts
After each FEC, approximately 2–3 samples from each market were pooled (which gave approximately 5–10 pooled samples per visit) and cultured at 25–28°C for 7 days for the recovery and identification of infective strongyle L3, according to Hansen & Perry (Reference Hansen and Perry1994) and Soulsby (Reference Soulsby1982). The proportions of the different species of L3 were used to calculate the relative contributions of various strongyles to the total FEC.
Packed cell volume
Packed cell volume (PCV) was determined using standard procedures (Dacie & Lewis, Reference Dacie and Lewis1995).
Body condition score
The body condition score (BCS) was determined for each goat at the time of blood and faecal sample collections according to Wildman et al. (Reference Wildman, Jones, Wagner, Boman, Troutt and Lesch1982).
Trypanosome parasitaemia
Examination of blood samples for trypanosomes was carried out using three methods: inoculation of fresh goat blood into trypanosome-naïve, out-bred mice; microscopic examination of wet blood films and Giemsa-stained thin films; and by the method of Herbert & Lumsden (Reference Herbert and Lumsden1976), for the quantitative estimation of trypanosome parasitaemia. For the mouse inoculation, 0.1 ml of blood was taken from each of 2–3 samples immediately after collection from the goats at the market sites, and on each sampling occasion. These were pooled, mixed and then 0.1 ml was taken from the pooled sample and inoculated subcutaneously into one mouse. After examination of the goat blood samples at the laboratory, the same process of mouse inoculation was repeated. Goats were considered negative for trypanosomes if, by the method of Herbert & Lumsden (Reference Herbert and Lumsden1976), their parasitaemias were below 5.0 (log10 trypanosomes/ml of blood) and no trypanosomes were subsequently detectable microscopically from mice for seven consecutive days after inoculation with goat blood. Where parasitaemia was detected in a mouse that had been inoculated with blood from a microscopically positive goat, this was assumed to be due to the single positive goat. Giemsa-stained blood films were used for morphological identification of trypanosomes according to Soulsby (Reference Soulsby1982).
Statistical analysis
Where relevant, summary data are presented as mean ± standard error of the mean (SEM), or percentages with 95% confidence limits (CL95), calculated as described by Rohlf & Sokal (Reference Rohlf and Sokal1995) employing bespoke software. All analyses of data were carried out in SPSS (version 12.0.1. for Windows; SPSS Inc., Chicago, Illinois, USA). For analysis of FEC, PCV and BCS, we fitted full factorial general linear models (GLM) and simplified these stepwise, commencing with the highest-order interactions, retaining only significant interactions and main effects that were significant or featured as components of significant interactions. Initially we fitted market (two levels, Akpagher and Bboko), month (six levels, from April to September), age class (four levels: age class 1, ≤ 12 months; age class 2, 13–16 months; age class 3, 17–18 months; and age class 4, 19–20 months) and sex (two levels, males and females). In some analyses we also fitted covariates as explained in the results section. Relationships between continuous variables were initially examined by Spearman's rank correlation test, and then tested in GLM with one as the dependent variable (e.g. PCV) and the other as a covariate (e.g. log10 (FEC+1)), while controlling for the confounding effects of other factors found to influence the data. For covariates we give the F values for their contribution to models and the gradient (β) with a corresponding t value for the test of significance of the gradient. The residuals from all models were assessed for approximately normal distribution. Where relevant, data were transformed using log10(x+1).
Prevalence data (percentage of animals infected) and FEC count data in four FEC classes were analysed by maximum likelihood methods applied to log linear analysis of contingency tables using the software package SPSS (version 12.0.1.). Full factorial models were fitted first and, beginning with the most complex model involving all possible main effects and interactions, those combinations that did not contribute significantly to explaining variation in the data were eliminated in a stepwise fashion beginning with the highest-level interaction. A minimum sufficient model was then obtained, for which the likelihood ratio of χ2 was not significant, indicating that the model was sufficient in explaining the data. The importance of each term (i.e. interactions involving presence/absence of infection in the final model) was assessed by the probability that its exclusion would alter the model significantly, and these values are given in the text. In all cases we used a cut-off value for significance of P = 0.05.
Results
Sample size
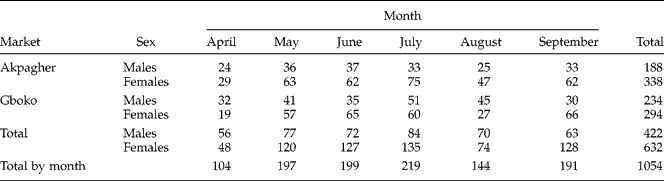
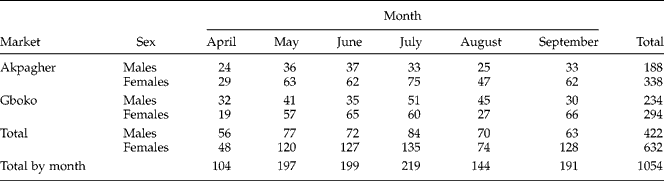
The numbers of goats sampled by month, site and sex are shown in table 1. Females (632) predominated over males (422). Thus, out of a population of 1054 goats 234 and 294 males and females, respectively, came from Akpagher and 188 and 338 males and females, respectively, from Gboko. Monthly totals varied, depending on the number of visits made per month and on the number of animals sampled per month (usually 4–5 visits and 15–20 animals per visit). The ages of the goats varied from 10 to 20 months, with the 10–12 month age class (age class 1) predominating, representing 36% of the total. Age class 2 comprised 27%; age class 3, 26% and age class 4, 11% of the total sample.
Numbers of male and female goats sampled by month at each of two markets.
Faecal egg and differential larval counts
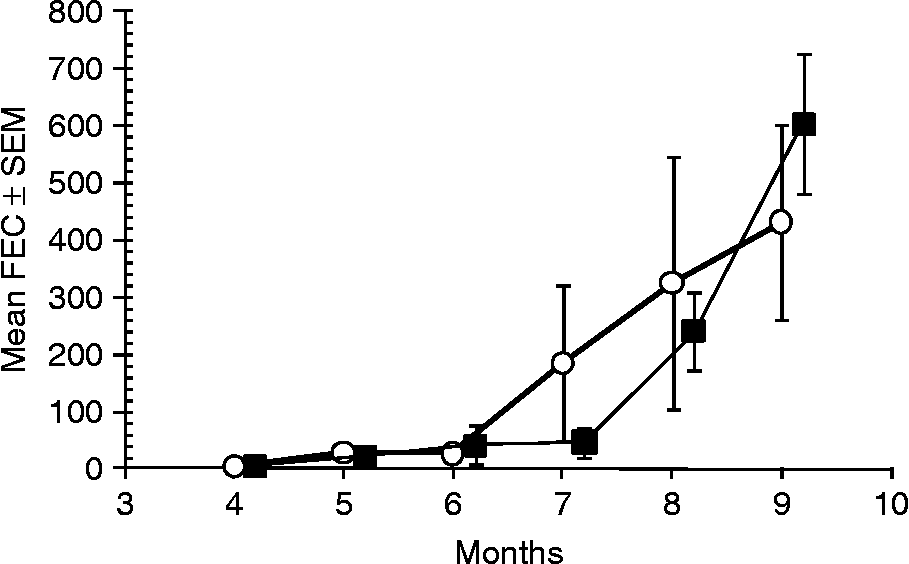
Table 2 summarizes the FEC of the goats according to market site, month and sex of goat. The levels of infection at both sites, assessed by FEC, were generally very low, particularly during the first 3 months (fig. 1). During the 6 months of study, a total of 848 goats (80.5%) were infected, as evidenced by at least 1 epg of faeces, and 206 (19.5%) did not pass eggs of GI nematodes.
Arithmetic mean FEC by month, and in both sexes, at each of the two markets.

Mean arithmetic monthly faecal egg counts, sampled from goats at two markets (Akpagher, open circles; and Gboko, solid squares). Months are numbered; samples were taken from 4 ( = April) to 9 ( = September).
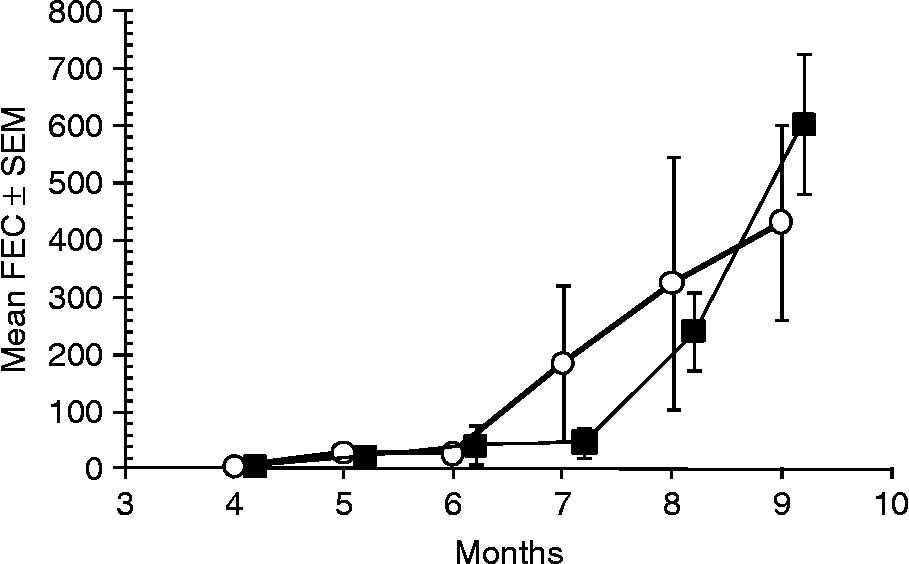
For analysis of FEC, all transformations of data failed to generate GLM models with normally distributed residuals, and the best fit model was one based on a GLM with a normal error structure fitted to ranked data (adjusted R 2 = 9.8%). This confirmed that FEC varied significantly between months (main effect of month, F 5,1042 = 22.3, P < 0.001). There was also a marginally significant difference between the two markets (main effect of market F 1,1042 = 3.9, P = 0.047), and a suggestion of an interaction between market and month (F 5,1042 = 2.09, P = 0.065). There was no difference between the sexes or age classes.
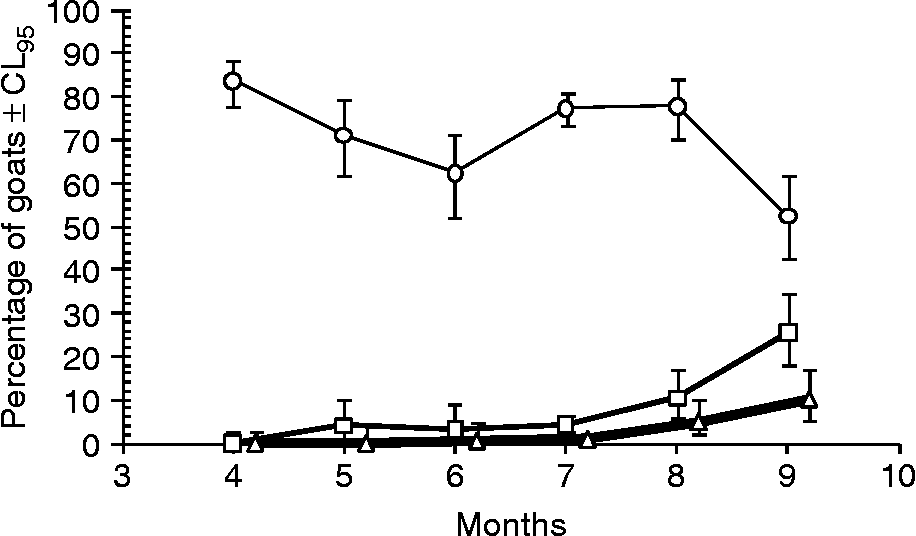
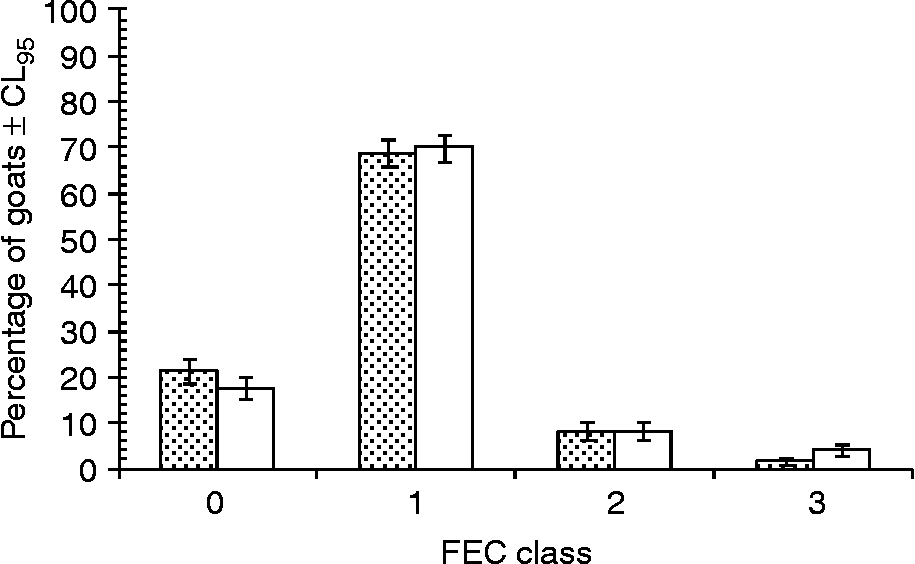
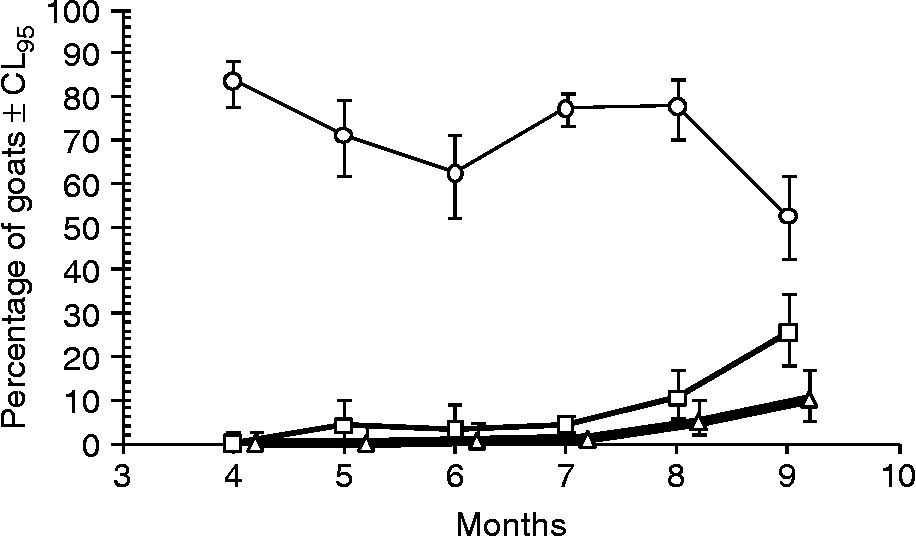
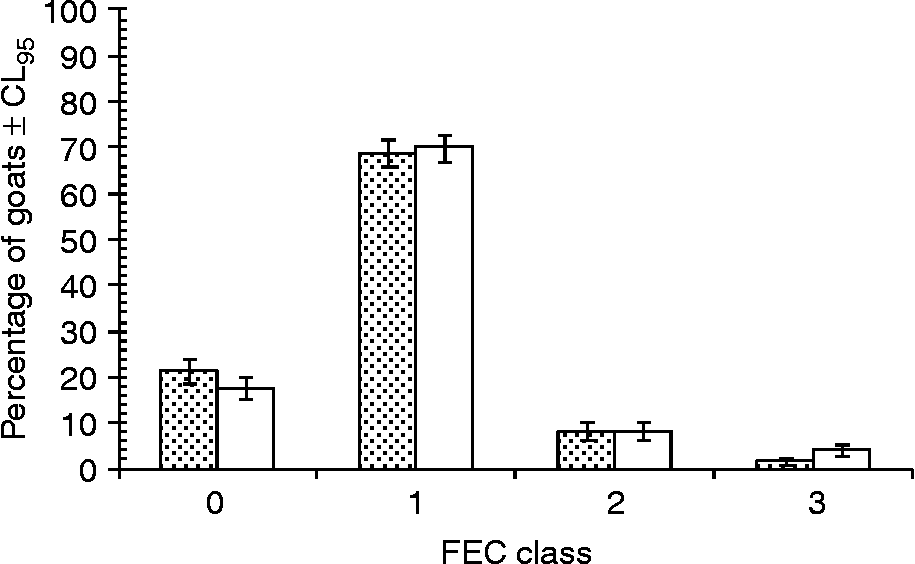
The total strongyle FEC were conveniently classified into three groups or phenotypes: class 1, low FEC (1–50 epg); class 2, intermediate FEC (51–1500 epg); and class 3, high FEC (>1500 epg). For analyses, uninfected goats were classified in FEC class 0. The low FEC phenotypes predominated throughout the season (fig. 2), and formed approximately 68.8 and 70.1% of the test population at Akpagher and Gboko, respectively (fig. 3). Analysis of FEC count data in the four FEC classes, and with month and market as additional factors, by log linear procedures confirmed that the strongest effect was that of month (χ215 = 190.8, P < 0.0001; fig. 2) and that there was a weaker but just significant difference between the markets (χ23 = 8.08, P = 0.044; fig. 3).
The percentage of goats assigned to low (FEC class 1; 1–50 epg; circles), intermediate (FEC class 2; 51–1500 epg; squares) and high (FEC class 3; >1500 epg; triangles) infection level classes, based on FEC and by month of the study, with data for goats from both markets pooled by month. The uninfected goats were excluded from this figure. Months are numbered as in fig.1.
Overall percentage of high, intermediate and low infection levels, based on FEC, as reflected in the percentage of goats at the two markets, classified in FEC class 0 (no eggs detected), FEC class 1 (1–50 epg), FEC class 2 (51–1500 epg) and FEC class 3 (>1500 epg). Alpagher is shown by stippled columns and Gboko by white columns.
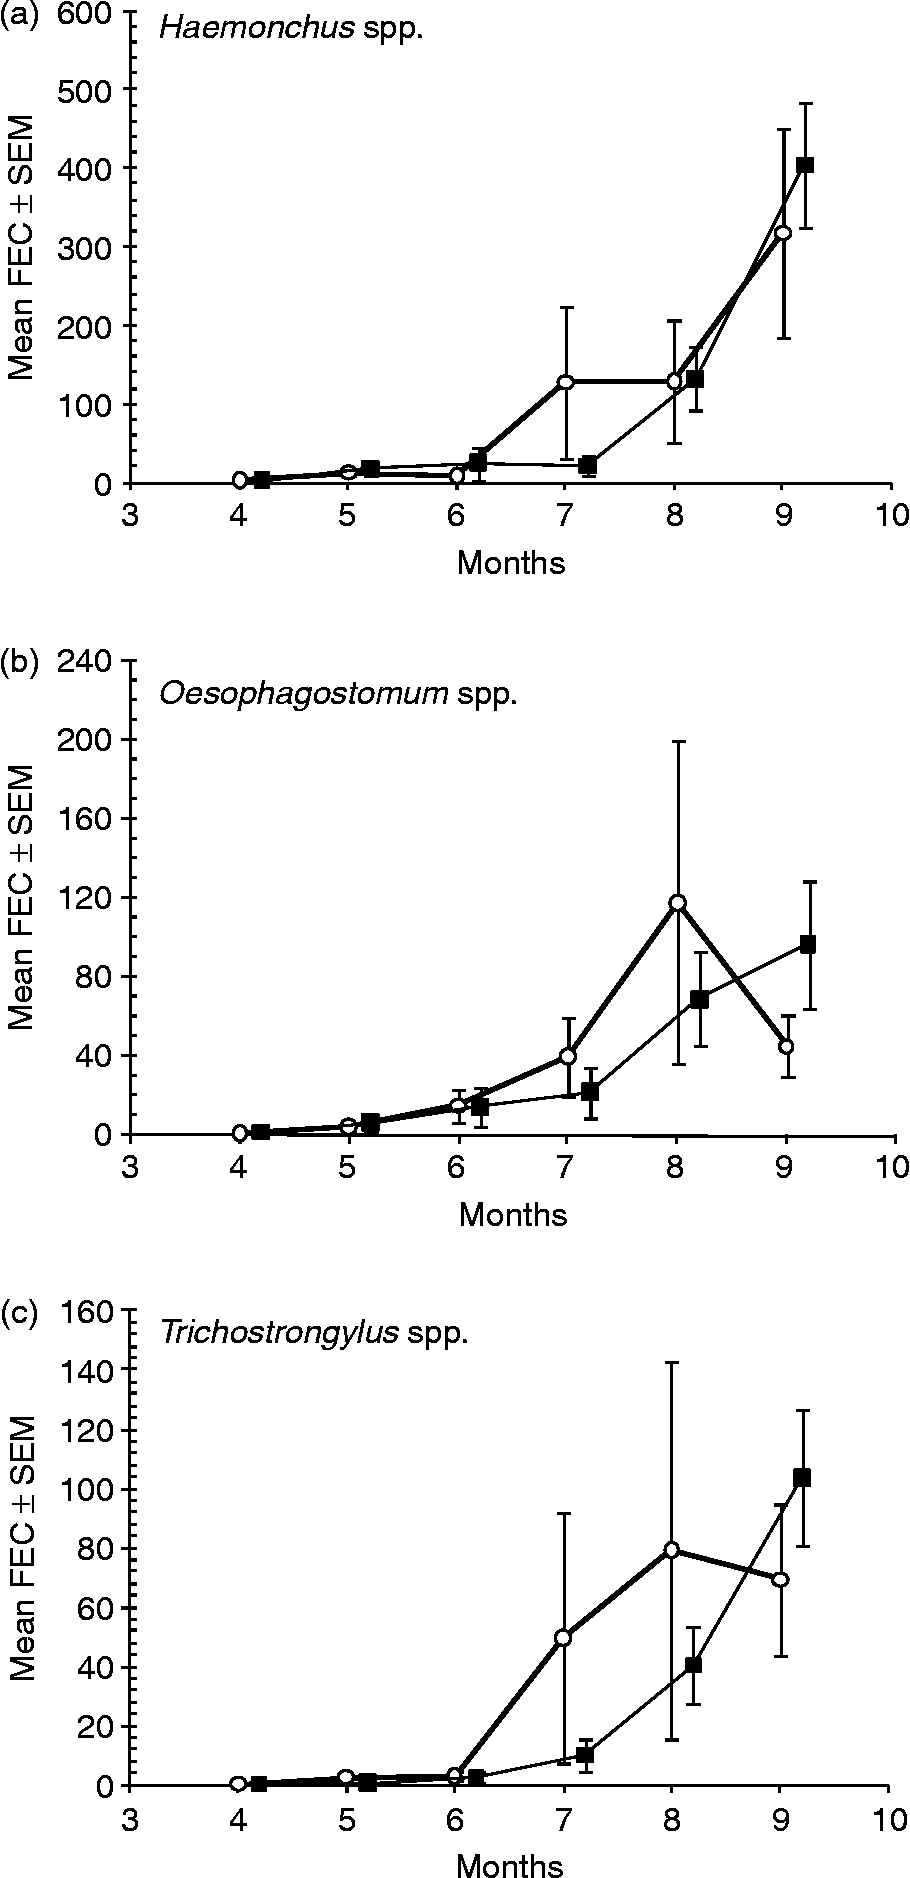
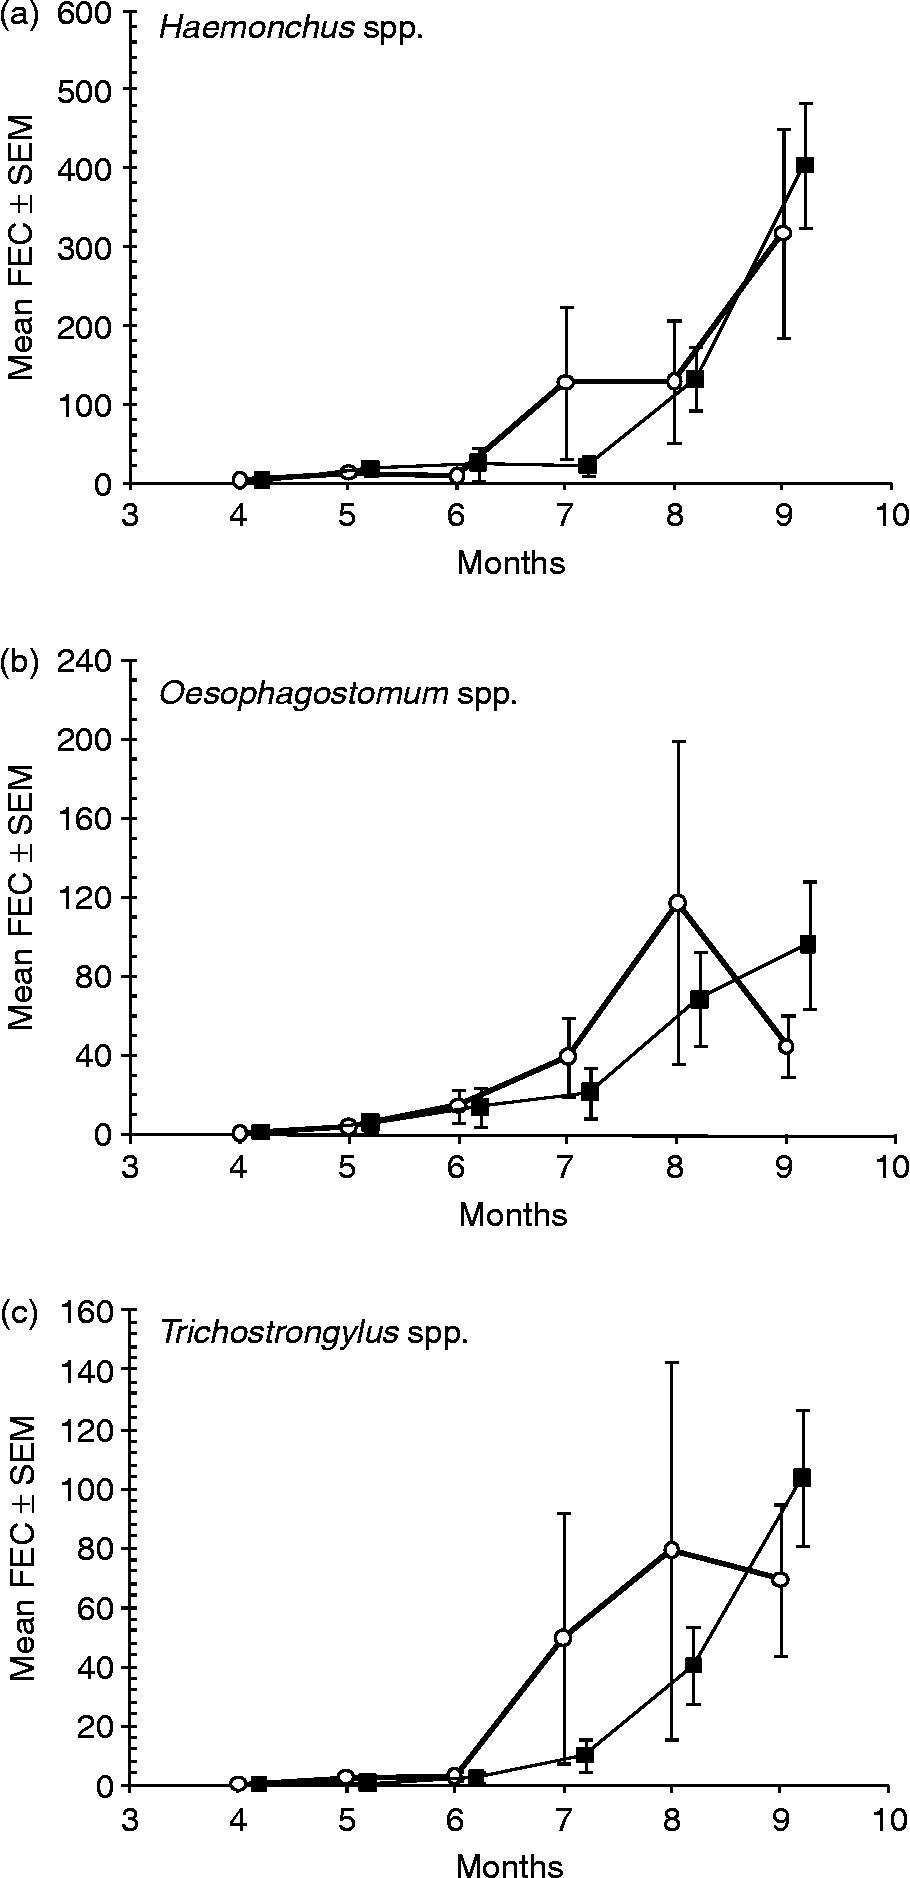
Three genera of strongyles were recovered from faecal cultures, namely Haemonchus, Oesophagostomum and Trichostrongylus. Their overall relative abundance, based on L3 recovered from faecal cultures was 61.6, 21.0 and 17.9% respectively. Haemonchus spp. predominated, particularly during the months of April (68.1%), May (64.0%) and September (73.5%) at Akpagher and May (71.1%) and September (66.8%) at Gboko. In all other months the percentage of eggs for Haemonchus spp. was below 59%. The highest percentage for Oesophagostomum spp. was in June at Akpagher (56.7%) and July at Gboko (41.2%). Trichostrongylus spp. peaked in July (22.9%) and August (24.4%) at Akpagher and in July (18.8%) and September (17.2%) in Gboko. The monthly abundance of each genus, but particularly Haemonchus spp. (fig. 4a), followed broadly that of the total strongyles (fig. 1), except for a slightly earlier peak in the abundance of Oesophagostomum spp. (fig. 4b) and Trichostrongylus spp. in Akpagher in August (fig. 4c).
Mean arithmetic FEC of goats at the two markets by month (where month 4 = April and month 9 = September). (a) Haemonchus spp.; (b) Oesophagostomum spp.; (c) Trichostrongylus spp. Akpagher, open circles; Gboko, solid squares.
Packed cell volume
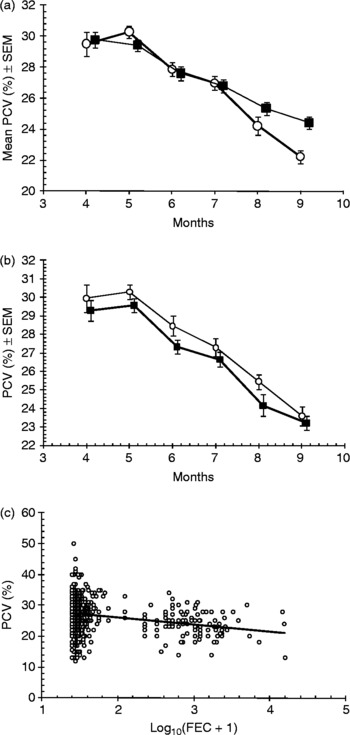
PCV declined significantly as the season progressed (fig. 5a; main effect of month F 5,958 = 14.9, P < 0.001; model included log10(FEC+1) as a covariate, and main effects of site, month, age class and sex+all significant interactions; R 2 = 28.4%); however, there was some variation between age classes and sexes which confounded the overall effect of month (two significant two-way interactions, and three significant three-way interactions involving permutations of all the factors). The strongest of these was the two-way interaction between month and sex (F 5,958 = 3.3, P = 0.006) and this is illustrated in fig. 5b, where it can be seen that generally PCV values in male goats were marginally higher but the relationship and the discrepancy between values in male and female goats varied by month. Note that the declining PCV with month of study coincided with rising nematode (fig. 1) and trypanosome (see below) infections. There was no main effect of sex (F 1,958 = 0.76, P = non-significant). The remaining interactions were weaker and are not illustrated.
The effect of market, sex and infection on the PCV of goats. (a) Declining PCV in goats from the two markets by month of the study, with sexes combined (Akpagher, open circles; Gboko, solid squares). (b) Declining PCV in male and female goats by month of the study, with markets combined (males, open circles; females, solid squares). (c) Declining PCV with increasing parasite burden as reflected in log10(FEC+1).

A small number of goats at both sites, but particularly at Akpagher, developed very low PCVs (13–20%) in August and September. At both market sites there was a significant negative correlation between PCV and raw FEC of all strongyles combined (r s = − 0.234; P < 0.01, n = 1054; fig. 5c presented as log10(FEC+1) for ease of interpretation) and between PCV and raw Haemonchus spp. FEC (r s = − 0.224, P < 0.01, n = 980). The declining PCV with increasing FEC was also evident when we controlled in a GLM model for market, month, sex and age class, and all significant interactions (main effect of log10 (FEC+1), F 1,958 = 9.67, P = 0.002, β = − 0.91 ± 0.292, t = − 3.11, P = 0.002).
Body condition score
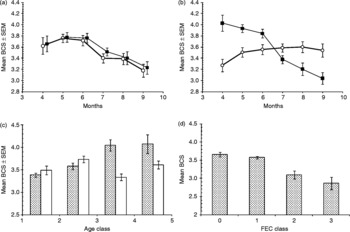
Changes in BCS followed broadly the same trend as the PCV (fig. 6a) with respect to time (main effect of month, F 5,1003 = 3.1, P = 0.009; model included log10(FEC+1) as a covariate and main effects of month, age class and sex+all significant interactions, R 2 = 12.3%; the main effect of site and interactions involving site were not significant), but the two sexes responded differently. Females generally had higher BCS scores in April, and the overall decline in body condition with month of survey was mostly evident in female, rather than in male, goats (fig. 6b; two-way interaction, month × sex F 5,1003 = 9.8, P < 0.001). The BCS also changed differently among the two sexes with increasing age. Male goats in general showed an initial increase in BCS with age and then a plateau, whereas in females BCS deteriorated in age classes 3 and 4 (fig. 6c; two-way interaction sex × age class, F 3,1003 = 5.15, P = 0.002). With these effects taken into consideration, there was a marginally significant difference in BCS between the sexes (main effect of sex, F 1,1003 = 4.0, P = 0.045), and a strong effect of age class (main effect of age class, F 3,1003 = 5.3, P = 0.001).
The effects of time, sex and GI nematode infection on body condition score (BCS). (a) Changes in BCS of goats sampled from the two markets by month of the study (Akpagher, open circles; Gboko, solid squares). (b) Changes in BCS in male and females goats by month of the study, with markets combined (males, open circles; females, solid squares). (c) Changes in BCS in male and female goats with increasing age as reflected in age classes, males are shown by stippled columns and females by white columns. (d) Declining BCS with increasing infection, as reflected in FEC classes.

There was a significant negative correlation of BCS with total strongyle FEC (r s = − 0.137, n = 1022, P < 0.001) and with Haemonchus spp. FEC (r s = − 0.139, n = 951, P < 0.01). With all the significant factors and interactions taken into consideration, there was a significant negative relationship between BCS and log10(FEC+1) (fig. 6d; main effect of log10(FEC+1), F 1,1003 = 16.5, P < 0.001, β = − 0.241 ± 0.059, t = 4.07, P < 0.0001).
Trypanosome parasitaemia
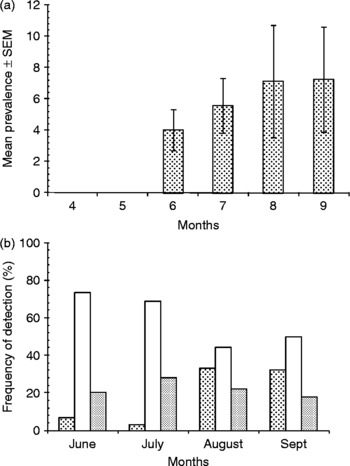
Trypanosome infection was detected only from June to September in 42 out of 1054 goats (3.98%). The mean monthly prevalence of infection varied from 4.0 ± 1.30% in June to 7.2 ± 3.36% in September (fig. 7a). Levels of parasitaemia (log10 trypanosomes/ml) varied from 5.4 to 7.8, except in late September when one goat with a very high parasitaemia of 8.1 was identified. This animal, Goat No. B450, had the lowest PCV (13%) encountered in this study.
(a) The prevalence of trypanosome infections, by month of study, as detected by microscopic examination of goat blood (4 = April and 9 = September). (b) The percentage of animals that were positive by goat blood smears and negative by sub-inoculation into mice (stippled columns), positive by both methods (darker stippled columns), and positive by sub-inoculation but negative on goat blood smears (white columns).

The use of mouse inoculation alongside examination of goat blood smears markedly improved the rate of detection of trypanosomes in goats, especially in goats with microscopically undetectable parasitaemias. If the former procedure had not been used, approximately 73, 69, 44 and 50% of trypanosome infected goats would have been missed in June, July, August and September, respectively (fig. 7b). However, as can be seen from this figure, blood from varying numbers of trypanosome-positive goats, ranging between 3.1 and 33.3% of microscopically positive animals, failed to initiate infections in mice.
All the 42 infected goats were positive for T. brucei. Thirty-nine (92.86%), two (4.76%) and one (2.38%) of them were infected with T. brucei alone, T. brucei+T. vivax and T. brucei+T. congolense, respectively.
Concurrent trypanosome–GI nematode infections
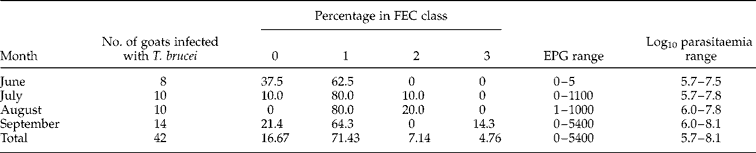
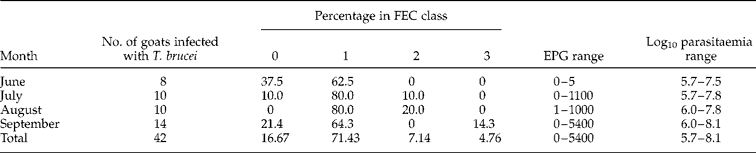
Thirty-five (83.3%) of all trypanosome-positive goats were concurrently infected with GI nematodes (based on FEC). During June to August 80.0–100.0% of concurrently infected goats were assigned to the low FEC phenotypes (table 3), with FEC range of only 0–23 epg. Similarly, during the peak trypanosome and GI nematode infections in September nearly 86% of the goats were classified in the low FEC phenotypes. High FEC of 1850–5400 epg were observed in only two goats in the study (4.8%, of trypanosome-infected goats). The seven goats with the highest levels of parasitaemia (at Akpagher, log10 trypanosomes/ml, 7.8) had FEC of 0–7 epg. Furthermore, the goat with the highest overall parasitaemia at Gboko (log10 trypanosomes/ml, 8.1) had a FEC of only 1 epg. The goat with the highest overall FEC (5400 epg) had a parasitaemia of log10 trypanosomes/ml, 7.5.
The distribution of trypanosome-infected goats among the different FEC classes (phenotypes) of savanna WAD goats during June and September.
Effect of concurrent trypanosome–GI nematode infections on PCV and BCS
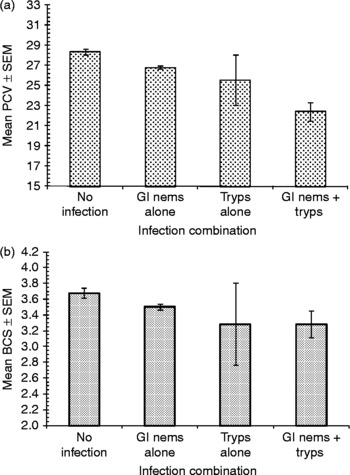
The concurrent infection data were further analysed for possible differential influences of single and concurrent infections on the PCV and BCS of the goats. The analysis showed that trypanosome and GI nematode naïve goats maintained the highest values of these parameters, followed by GI nematode infection alone, trypanosome infection alone and concurrent infection, in that order. Analysis of PCV with infection combination as a factor (see fig. 8 for explanation) by GLM gave F 3,1032 = 16.9 (P < 0.001; fig. 8a) but when we controlled for the significant effects of age class, site, month and sex, the significance was lost. Similarly, initial analysis of BCS by infection status alone indicated a significant effect (F 3,1018 = 2.8, P = 0.038, fig. 8b), but when we controlled for the factors that were shown earlier to affect BCS (month, age class and sex) there was no significant effect. Both analyses were characterized by the relatively small number (7) of trypanosome-only-infected goats. Although overall concurrent infections were associated with a progressive drop in PCV (fig. 8a), only a relatively small number of infected goats with PCV < 15% showed overt clinical signs of anaemia, such as marked palor of visible mucous membranes, on physical examination. This included four concurrently infected goats with PCV of 13%, high parasitaemia of between 7.5 and 8.1 log10 trypanosomes/ml and BCS of between 1 and 4. Overall, the majority of trypanosome alone, nematode alone and concurrently infected goats maintained generally good body conditions of between 3 and 4 points, even during peak infection months.
The effect of concurrent infections on PCV (a) and BCS (b). In (a) for the no infection category, n = 195; for GI nems alone (gastrointestinal nematode infection as detected by FEC), n = 799; for the Tryps alone category (trypanosome infection as detected using blood smears from goats and sub-inoculation of blood into mice), n = 7; for the combination of GI nematodes and trypanosomes, n = 35. In (b) the numbers of animals in each category were 187, 778, 7 and 35, respectively.

Discussion
Studies conducted mainly in the Gambia and neighbouring countries of West Africa strongly suggest that the trypanotolerant breeds of small ruminants in general, and WAD goats in particular, may no longer be purebred (Fidalis, Reference Fidalis2004; Geerts et al., Reference Geerts, Osaer, Goosens and Faye2008) as a result of introgression of genes from parasite-susceptible Sahelian breeds into the former genotypes. This is thought to be responsible for the reported spread of loss of resistance and resilience to GI nematode and trypanosome parasites among the dwarf breeds of small ruminants in the region (Geerts et al., Reference Geerts, Osaer, Goosens and Faye2008). Little is known about naturally occurring concurrent trypanosome–GI nematode interactions in trypanotolerant and other small ruminant populations in Nigeria and other parts of West Africa. However, there is evidence from a recent laboratory study (Chiejina et al., Reference Chiejina, Musongong, Fakae, Behnke, Ngongeh and Wakelin2005) that T. brucei infection has no significant influence on the pathogenicity, worm burdens or FEC of concomitant H. contortus infection, neither does the nematode infection result in attenuation or loss of resistance or resilience to this trypanosome species.
The present study was therefore an opportunity to study the responses of another major WAD goat genetic resource in the savanna belt of Nigeria to a naturally occurring trypanosome–GI nematode (predominantly Haemonchus spp.) interaction. This WAD goat ecotype lives in close proximity to Sahelian goats from the semi-arid zones of the country and therefore opportunities for cross-breeding with the latter exist. A number of epidemiological findings emerged from the study. First, the goats were infected with three GI strongyle genera, namely Haemonchus, Oesophagostomum and Trichonstrogylus. It was surprising that there were very low levels of infection in the majority of goats throughout the 6 months of observations, since the observations were made on predominantly relatively young, and therefore presumably susceptible, animals and during the most favourable time of year for maximum environmental contamination and transmission of infections. Therefore, the observed levels of infection in the animals were unlikely to be due to exposure to very low levels of pasture infestation, although the actual levels of pasture infestation were not determined. It is more likely that the dominance of low FEC phenotypes, and therefore, the extent of resistance demonstrated in this goat population, is a true reflection of the responsiveness of this WAD goat ecotype to its native strains of the nematodes. Furthermore, the goats we examined were a representative sample of goats presented each week at the two market locations during the study period, given the sample size and the fact that only a few suspected PPR and pregnancy cases were identified and excluded from the study.
Surprisingly also, concurrent trypanosome infections did not appear to increase susceptibility to GI nematodes, even at high parasitaemias. The preponderance of low FEC phenotypes (>80% of the population) and the absence of significant interaction between trypanosome infections and concomitant GI nematodes is reminiscent of the pattern of responsiveness of WAD goats of the humid zone, which are known to express strong resistance and resilience to H. contortus in particular (haemonchotolerance) and GI nematodes in general (Fakae et al., Reference Fakae, Musongong, Chiejina, Behnke, Ngongeh and Wakelin2004; Behnke et al., Reference Behnke, Chiejina, Musongong, Fakae, Ezeokonkwo, Nnadi, Ngongeh, Ebene and Wakelin2006). A recent experiment in which goats of both ecotypes were experimentally infected with either H. contortus or T. brucei confirmed that the savanna WAD ecotype exhibits comparably strong degrees of trypanotolerance and haemonchotolerance to its humid zone counterpart (Chiejina et al., Reference Chiejina, Behnke, Nnadi, Ngongeh and Musongong2009). In that study FEC and PCV were shown to be reliable phenotypic markers and correlates of resistance and resilience, respectively, to H. contortus. Therefore, the strong negative correlation between FEC and PCV in the present study supports the view that both parameters may also be good phenotypic markers of resistance to GI nematode infection in this caprine ecotype. However, this relationship is not a simple one since other factors, notably concurrent trypanosomosis, undoubtedly contributed significantly to changes in PCV, which occurred at the same time as similar changes associated with GI nematode infections. The fact that the significant relationship between infection combinations (nematode alone, nematode+trypanosomes, and trypanosomes alone) and PCV was lost when the analysis took into account other significant factors, such as age class, sex and month, emphasizes the possible multifactorial aetiology of the observed drop in PCV as the season progressed.
Second, only 42 goats (4.0%) were infected with trypanosomes. Trypanosoma brucei was the dominant species and 83% of trypanosome-infected goats were concurrently infected with GI nematodes. The dominance of T. brucei (found in all infected goats, although in 7.1% of infected goats in combination with other Trypanosoma spp.) is much greater than the figure of 50% found by Fakae & Chiejina (Reference Fakae and Chiejina1993) in trypanosome-infected WAD sheep and goats in a survey of 107 of these animals from the humid zone of Nigeria, and the even lower figure of 16.2% found by Daniel et al. (Reference Daniel, Joshua, Kalejaiye and Dada1994) among 37 infected sheep and goats in Gombe area of northern Nigeria. In the latter survey, which involved a total of 615 sheep and goats, T. vivax predominated, accounting for 59.5% of infections in the 37 animals. Several factors can influence the relative prevalence of trypanosome species in any given locality. These include availability of alternative hosts, and therefore choice of suitable sources of blood meal for the insect vector (Glossina spp.), and the techniques used for the detection of the organisms in the blood.
The true prevalence of infection in the savanna WAD goat population remains to be established in view of the relative insensitivity of the techniques used in the present study. Although mouse inoculation significantly improved the detection rate, it failed to detect an unknown number of infected goats. The use of a more sensitive technique on individual goats, such as polymerase chain reaction–restriction fragment length polymorphism, used by Simukoko et al. (Reference Simukoko, Marcotty, Phiri, Geysen, Van den Vercruysse and Bossche2007), would have further improved the detection rate. Nevertheless, the results confirm that trypanosomosis is naturally present in the goat population, although at low levels as evidenced by the relatively low to moderate parasitaemias, which generally varied between 5.4 and 6.9 except at peak trypanosomosis prevalence in August and September, when eight goats had high parasitaemias ranging from 7.8 to 8.1. Therefore, the overall picture was one of sub-clinical chronic trypanosomosis. Thus the majority of goats were able to control their infections in spite of the absence of trypanocidal treatments. Only a small number of susceptible goats, with low resilience, identified by their very high parasitaemias, low PCVs and poor BCS, would have needed such treatment, ideally combined with anthelmintic treatments, since concurrent GI nematode infections were usually present.
Third, it is significant that under field conditions in the Nigerian savanna the trypanosomosis season coincided with that of GI nematode infections, thereby making concurrent infections potentially more important than separate infections in goat production in the area. Therefore, the declining PCV and BCS as the season progressed were largely attributable to at least these two factors. The other possible contributory factor was poor nutrition (Faye et al., Reference Faye, Osaer, Goosens, Van Winghem, Dorny, Lejon, Losson and Geerts2002). Although the rainy season is a period of relative abundance of grass, it is possible that the goats did not benefit fully from the seasonal increase in availability of forage and browse as a result of the peculiarities of the traditional system of WAD goat husbandry in Nigeria. This involves restricted and limited access to, and choice of, browsing because of the need to browse close to their owner's premises during the rainy season, to avoid damage to farm crops. It also entails increased reliance on rather unpredictable and variable supply of cut-and-carry forage and kitchen wastes (Chiejina, Reference Chiejina, Chowdhury and Tada2001). The net outcome would be sub-clinical malnutrition, which could become a contributory factor to the gradual decline in these parameters as the season progressed.
It is also noteworthy that the majority of the goats were generally in good health and body condition, with BCS of between 3 and 5 points (87.7% of all goats sampled), in spite of their declining PCV as the wet season progressed, which fell to < 15% in a small number of goats at the peak of trypanosome and GI nematode infections in September. Nevertheless, only four concurrently infected and six nematode-infected goats, and coincidentally/surprisingly also one uninfected goat, showed obvious signs of anaemia. Such low levels of PCV ( < 15%) are one of the characteristic features of acute trypanosomosis (Adah et al., Reference Adah, Otesile and Joshua1993) and haemonchosis (Nwosu et al., Reference Nwosu, Ogunrinade and Fagbemi2001) in susceptible Nigerian Sahelian goat breeds. The response of the large majority of savanna WADs is therefore indicative of a high level of resilience to the dual infections. Furthermore, there was no evidence of additive or synergistic pathogenic effects of trypanosomosis and GI nematode infections in the goats. Therefore, the data are consistent with the interpretation that each of the parasites in the interaction exerted its separate pathogenic effect on the host, which the majority of the goats were able to withstand resulting in only subclinical and mild, chronic infections.
Therefore overall, data from this study, taken together with those of Chiejina et al. (Reference Chiejina, Musongong, Fakae, Behnke, Ngongeh and Wakelin2005), Behnke et al. (Reference Behnke, Chiejina, Musongong, Fakae, Ezeokonkwo, Nnadi, Ngongeh, Ebene and Wakelin2006) and Chiejina et al. (Reference Chiejina, Behnke, Nnadi, Ngongeh and Musongong2009), indicate that both of the main Nigerian WAD ecotypes have, so far, largely retained their marked resilience not only to trypanosomosis but also to GI nematodes. If the observations of Goossens et al. (Reference Goossens, Osaer, Jaiter, Ndao and Geerts1997), Faye et al. (Reference Faye, Osaer, Goosens, Van Winghem, Dorny, Lejon, Losson and Geerts2002) and Dhollander et al. (Reference Dhollander, Bos, Kora, Sanneh, Gaye, Leak, Berkvens and Geerts2005) in WAD goats and Djallonke sheep, and of Kaufmann et al. (Reference Kaufmann, Dwinger, Haliebeek, van Dijk and Pfister1992) in N'dama cattle in the Gambia were applicable also to concurrent trypanosome–GI nematode infections in Nigerian savanna WAD goats, we would have expected to see some relaxation of the resistance and resilience to GI nematodes in concurrently infected animals, but this was not evident in our observations, except in a very small number of individual goats.
The interpretation of results of field studies such as we have reported here suffers from several limitations in view of the fact that they are conducted under conditions in which some factors that can influence infections are either unknown or, if they are known, are difficult to standardize and control. Consequently, their precise, separate and interactive influences are difficult to determine. Examples include lack of accurate/precise knowledge of host genotype, age, nutritional status, variations in immune response and parasite challenge (parasite species, strain and levels of exposure of the individual members of the host population to infection). Nevertheless, such studies can give good indications of general epidemiological patterns and trends and highlight areas of the subject requiring further detailed and controlled study. Among those stemming from the present study are:
(1) the apparent absence of significant attenuation of parasite resistance and resilience in this goat resource population, suggesting an absence of significant introgression of parasite susceptibility genes into the Nigerian savanna WAD goat population;
(2) lack of interaction between trypanosome and GI nematode parasites in the Nigerian WAD goat ecotypes, evidenced by absence of the classical trypanosome-elicited immunosuppression of concomitant nematode infection; and
(3) the underlying (genetic and immunological) mechanisms, which have endowed the two Nigerian WAD goat ecotypes with their unusually strong resistance and resilience to trypanosome and GI nematode infections, in the face of growing evidence of loss of these vital traits in WAD goat populations in some other parts of West Africa.
Acknowledgements
We are grateful to the Sir Halley Stewart Trust for funding this study and to Dr E. O. Gbonko, Rector of the Benue State Agricultural College, who facilitated contacts and communication with the rural, small-scale goat keepers in his area.