Introduction
The ferrous/ferric iron ratio in spinels is an important source of information in calculating the oxidation state of the Earth's mantle and derivative melts. This is particularly important in the application of oxy-thermobarometers such as those based on olivine–orthopyroxene–spinel equilibria (Wood and Virgo, Reference Wood and Virgo1989; Wood, Reference Wood1990; Ballhaus et al., Reference Ballhaus, Berry and Green1991; Davis et al., Reference Davis, Cottrell, Birner, Warren and Lopez2017; Stagno and Fei, Reference Stagno and Fei2020). Stagno (Reference Stagno2019) used this method to show a correlation between the Fe3+/ΣFe ratio in Cr-bearing spinels from mantle spinel peridotites and the oxygen fugacity (log $f_{\rm O_2}$ ) of the upper mantle demonstrating that the Fe3+/ΣFe ratio in Cr-bearing spinels is an important proxy for mantle $f_{\rm O_2}$
 .
However, for this application to be a success it is essential to have an accurate knowledge of the relative abundances of Fe2+ and Fe3+ in spinel, and as yet estimating Fe3+ abundances in chrome spinels is not straightforward. Here we investigate the compositions of natural chrome-bearing spinels in which the bulk compositions were determined using electron probe microanalysis (EPMA) and the Fe2+/Fe3+ ratio measured directly using Mössbauer spectroscopy. Using this dataset, we explore the distribution of Fe3+ over a wide range of spinel compositions. This work is based on our earlier studies of chromite in chromitites from the mantle section of the Oman ophiolite and from layered mafic igneous intrusions. In addition, we have incorporated data from other published studies which have combined EPMA and Mössbauer data for chrome-bearing spinels. These investigations are principally of spinel-peridotites found either as xenoliths in basalt or preserved as orogenic massifs. A list of the data sources used is given in Supplementary Table S1.
Previous investigations by Wood and Virgo (Reference Wood and Virgo1989), Dare et al. (Reference Dare, Pearce, McDonald and Styles2009) and Davis et al. (Reference Davis, Cottrell, Birner, Warren and Lopez2017) measured Fe3+ in spinels by EPMA using a set of secondary microprobe standards in which Fe3+ had been determined by Mössbauer spectroscopy. They found a correlation between the offset between (Fe3+/ΣFe)Möss and (Fe3+/ΣFe)EPMA [represented by (ΔFe3+/ΣFe)Möss-EPMA] and cr#. They used this correlation to correct the Fe3+/ΣFe values calculated from EPMA/stoichiometric constraints. Davis et al. (Reference Davis, Cottrell, Birner, Warren and Lopez2017) noted that although this correction works well for aluminous spinels in lherzolites, the subject of the Wood and Virgo (Reference Wood and Virgo1989) study, and that it might not work so well for compositions beyond this range. Here we use an expanded database which includes Cr-rich and Fe-rich compositions and from which we confirm the concerns of Davis et al. (Reference Davis, Cottrell, Birner, Warren and Lopez2017) regarding the EPMA correction procedure. We show that Cr- and Fe-rich spinels exhibit different crystal chemical features from the aluminous spinels providing new insights into the distribution of Fe3+ in spinels. These observations imply that the correction procedures developed for aluminous spinels are inappropriate for Cr-rich and Fe-rich compositions.
Spinel structure
Minerals of the spinel group conform to a near-ideal cubic structure of close-packed oxygen atoms. There are 32 oxygen atoms in the unit cell between which there are tetrahedrally and octahedrally coordinated cation sites. Of the 24 cation sites, 8 are tetrahedrally coordinated and designated T sites which accommodate cations of the A atom group and 16 are octahedrally coordinated and designated M sites that accommodate cations of the B atom group (Bosi et al., Reference Bosi, Biagioni and Pasero2019). Following O'Neill and Navrotsky (Reference O'Neill, St and Navrotsky1983) the spinels under consideration here are 2–3 spinels, i.e. cations of the A atom group have a 2+ charge and include Mg, Fe2+, Zn and Mn, and cations of the B atom group have a 3+ charge and include Al, Fe3+ and Cr. Using the unit cell model adopted here normal spinels have the structure (A)8[B16]O32 in which the divalent A cations occupy the tetrahedrally coordinated sites and the trivalent B cations the octahedrally coordinated sites; they include phases such as MgAl2O4 (spinel proper) and FeCr2O4 (chromite). Inverse spinels have the structure (B)8[A,B]16O32 and include minerals such as (Fe3+)[Fe2+Fe3+]O4 (magnetite).
However, the crystal chemistry of spinels, in particular their cation distribution, is not straightforward. For example, as many authors have shown (Dyar et al., Reference Dyar, McGuire and Ziegler1989; Canil et al., Reference Canil, Virgo and Scarfe1990; Davis et al., Reference Davis, Cottrell, Birner, Warren and Lopez2017) chrome-spinels are commonly non-stoichiometric and could therefore contain vacancies at cation sites, contain cations at interstitial sites, or be oxygen deficient (Fregola et al., Reference Fregola, Bosi and Skogby2011). Furthermore, spinels can display complex disordering between the two cation sites and show a full range of cation distributions between the normal and inverse spinel structures. This could be quantified by the parameter x, which is the fraction of tetrahedrally coordinated sites occupied by B cations. Because ions on the T and M sites have different sizes, a change in x results in a change in the dimensions of the unit cell (O'Neill and Navrotsky, Reference O'Neill, St and Navrotsky1983). Experimental investigations by Nell and Wood (Reference Nell and Wood1989, Reference Nell and Wood1991) and Nell et al. (Reference Nell, Wood and Mason1989) show that in the spinel system (Mg2+, Fe2+)(Fe3+, Al3+, Cr3+)2O4 under consideration here, there is Fe2+, Mg2+, Fe3+ and Al3+ disorder between tetrahedrally and octahedrally coordinated sites. In contrast, Cr3+ is present only at octahedrally coordinated sites because of its size and high crystal field stabilisation energy, and there is no observed cation disordering in the system FeCr2O4–MgCr2O4 (Nell and Wood, Reference Nell and Wood1991). These observations imply that in natural spinels it is commonly difficult to assign precisely cations to their appropriate crystallographic site. Full details of site occupancies can be obtained from single-crystal X-ray diffraction data using a fitting model in which the atomic fractions at the two sites are calculated. Some insight can also be gained from Mössbauer spectroscopy for the site occupancy of Fe2+ and Fe3+ ions (Schmidbauer, Reference Schmidbauer1987; Rollinson et al., Reference Rollinson, Adetunji, Yousif and Gismelseed2012).
Methodology
This investigation is based on a data set of samples analysed in our laboratory, augmented by an extended dataset of previously published data. All data have been processed in the same manner using EPMA data and Fe2+/Fe3+ ratios determined by Mössbauer spectroscopy. We have not assumed that our spinels are stoichiometric. For this reason our cation calculations are based upon 32 oxygens (the number of oxygen ions in the unit cell) to give an expected composition [A2+]8[B3+]16O32. This leaves the cation totals to vary around the value of 24.0. Totals that deviate significantly from this value, after allowing for small errors in the microprobe analysis, might indicate non-stoichiometry. Details of the samples used and the compositional data are given in Supplementary Tables S1–S3.
Full details of the methodological approaches that lie behind this investigation – Mössbauer analysis, EPMA, the cation calculation scheme and site-occupancy calculations are given in the Supplementary Material. This discussion includes a full consideration of the systematic errors in the different methodologies employed in our core data set. These data are then used to set limits on the systematic errors in our extended dataset. Representative Mossbauer fitting parameters are given in Supplementary Table S4.
In the text below we use the terms: ‘chrome-bearing spinel’ to include: the spinel–magnesio-chromite series and the magnesio-chromite–chromite series; and ‘uncorrected EPMA’ (electron probe microanalysis) for data where Fe3+ (if calculated) is based on the assumption of ideal stoichiometry (24 cations per 32 oxygens), although without a correction based on Mössbauer-calibrated spinels, as described, for example, by Wood and Virgo (Reference Wood and Virgo1989) and Davis et al. (Reference Davis, Cottrell, Birner, Warren and Lopez2017).
Results
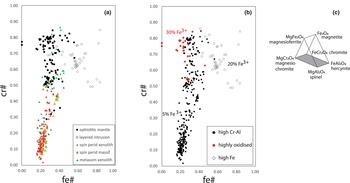
A plot of samples by provenance is shown in Fig. 1 on a cr# (Cr/(Cr+Al) vs. fe# (Fe2+/(Fe2++Mg) diagram. Spinels in the peridotite xenoliths range in cr# from 0.016–0.862 and in the spinel peridotite massifs from 0.046–0.436; spinels from the peridotite massifs are slightly more Fe-rich than those in the xenoliths. A subset of samples from metasomatised mantle xenoliths containing aluminous phases are more Cr-rich than samples which are not metasomatised. Spinels in these series show a small increase in fe# with increasing cr#. Spinels in mantle chromitites from ophiolite complexes are Cr-rich and show a wide range of compositions (cr# = 0.286–0.845, fe# = 0.0–0.563). Most spinels in this series show an increase in cr# with no associated increase in fe#. Spinels from layered mafic intrusions are more Fe-rich and vary with cr# = 0.490–0.845 and fe# = 0.278–0.838, and show a broad trend of decreasing cr# with increasing fe#. In total our data set comprises 361 Mössbauer measurements of Fe2+/Fe3+ in Cr-bearing spinels; compositions range from cr# = 0.016–0.862 and fe# = 0.0–0.838, i.e. from spinel to magnesio-chromite and chromite. We measured Fe3+/ΣFe ratios between 0.05 and 1.0 and low Ti concentrations between 0.002–0.286 apfu (atoms per formula unit), with a mean = 0.038 apfu.
(a) Plot of cr# vs. fe# by provenance for the samples used in this study; (b) plot of cr# vs. fe# showing the three main groups of samples identified in this study. The proportion of Fe3+ cations expressed as Fe3+/(Fe3++Al+Cr) is also shown; (c) the location of the cr# vs. fe# plot is shown as the grey area within the spinel prism of Haggerty (Reference Haggerty and Lindsley1991). Samples with a high magnesioferrite-magnetite content are projected onto the base of this prism. In diagrams (a) and (b) cr# and fe# are corrected using the Mössbauer Fe3+/ΣFe, as described in the text.

Cation plots
Crystal-chemical data shown as cation plots suggest that the chrome-bearing spinels examined in this investigation fall into three distinct groups. All the plots described below show cations from the corrected EPMA, that is, the cations are recalculated using Fe3+ from Mössbauer data.
Group 1 – highly oxidised spinels
A plot of (Fe3+/ΣFe)Möss vs. cr# for all spinels shows that some samples have anomalously high (Fe3+/ΣFe)Möss ratios (Fig. 2). Here we define anomalously high as (Fe3+/ΣFe)Möss > 0.4; this is consistent with samples that have ratios higher than 2σ above the data trendline on a (Fe3+/ΣFe)Möss vs. cr# plot (Fig. 2) and is consistent with the most highly oxidised Cr-bearing spinels found in the natural spinel peridotites described in the review by Stagno (Reference Stagno2019).
Plot of Fe3+/ΣFe as determined by Mössbauer spectroscopy vs. cr#. Samples with anomalously high Fe3+/ΣFe, (i.e. Fe3+/ΣFe > 0.4) are shown in red and designated ‘highly oxidised’. The geological settings of the two groups of samples are given in Fig. 1 (a and b).

These samples define a group of highly oxidised chrome-rich spinels. They are shown in red in Fig. 2. They have high Fe3+/(Fe3++Al+Cr) ratios in the range 0.16–0.46 (mean = 0.288). Their position in Fig. 1b therefore represents a projection from magnesioferrite–magnetite join onto the base of the spinel prism of Haggerty (Reference Haggerty and Lindsley1991). Samples in this group come from ophiolitic mantle chromitites and chromitites in layered intrusions.
Group 2 – Cr–Al spinels
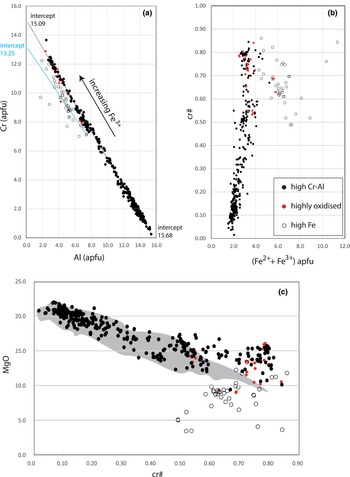
When the highly oxidised samples identified above are removed from the dataset, a plot of Cr vs. Al apfu shows two populations (Fig 3a). Samples with (Cr+Al) between 16.0 and 14.83 follow an inverse straight-line relationship (R 2 = 0.997), close to the stoichiometric 16 cation line for octahedrally coordinated cations in normal spinels and apparently indicating an almost exclusive Cr–Al substitution. These samples have low Fe3+/(Fe3+ + Al + Cr) ratios in the range 0.007–0.18 (mean = 0.055). Most samples in this group are either from spinel peridotites or ophiolitic mantle chromitites.
(a) Plot of Al vs. Cr atoms per formula unit (apfu) showing a strong correlation (black circles). A second group of samples (unfilled circles) do not follow this trend but are Cr-poor for a given Al value; the red symbols are samples from the highly oxidised group. The trend lines shown are the best-fit lines together with the relevant intercepts. (b) Plot of (Fe3+ + Fe2+) vs. cr# showing the Cr–Al group of samples (black circles), samples that do not conform to this trend (unfilled circles) and the highly oxidised samples (red circles). Samples that do not conform to the Cr–Al correlation have high Fetotal and Cr. (c) Plot of MgO vs. cr# for the three groups of spinels shown in (a) and (b). Samples from the Cr–Al group overlap the field identified by Davis et al. (Reference Davis, Cottrell, Birner, Warren and Lopez2017) for natural peridotite spinels (n = 743). Samples from the high-Fe group do not conform to this trend. The data in each of these plots are based upon EPMA data corrected with Mössbauer Fe3+/ΣFe. The geological setting of the different groups of samples is given in Fig. 1(a and b).

Group 3 – high-Fe spinels
A second group of samples on a Cr vs. Al cation plot diverges from the straight-line trend noted above at about Al = 8.0 apfu, with Cr values lower than those observed in the Cr–Al group. These samples have Cr + Al = 14.83–11.49. They are further characterised by their high total Fe content and Fe2+ + Fe3+ > 4.2 apfu (Fig 3b). This distinction is also apparent on the cr# vs. fe# plot indicating that these samples have high Fe2+/(Fe2++Mg) ratios (Fig. 1b). Previous studies have also recognised this distinction on the basis of single-crystal X-ray data (Lenaz et al., Reference Lenaz, O'Driscoll and Princivalle2011; Velicogna and Lenaz, Reference Velicogna and Lenaz2017; Menagazzo et al., Reference Menagazzo, Carbonin and Della Giusta1997) and using a combination of single-crystal X-ray data and Mössbauer data (Bosi et al., Reference Bosi, Andreozzi, Ferrini and Lucchesi2004; Figueiras and Waerenborgh, Reference Figueiras and Waerenborgh1997). A comparison between Figs 1a, 1b and 3b shows that these high-Fe samples are from layered igneous intrusions. These samples have Fe3+/(Fe3++Al+Cr) ratios in the range 0.011–0.53 (mean = 0.20). A further distinction between the two groups is seen in the MgO vs. cr# plot (Fig. 3c) where the Cr–Al spinels plot with a negative trend whereas the high-Fe spinels plot with a positive trend and with lower MgO values (cf. Davis et al. (Reference Davis, Cottrell, Birner, Warren and Lopez2017).
Stoichiometry
Mössbauer spectroscopy is the only direct means of accurately measuring Fe3+ in spinels, therefore our data can be used to evaluate the reliability of Fe3+ calculated assuming mineral stoichiometry and thereby assess the degree to which spinels are stoichiometric. Previous Mössbauer studies of Fe3+ in spinel peridotites have shown that there is a discrepancy between Fe3+ calculated from uncorrected EPMA assuming perfect stoichiometry and that measured by Mössbauer spectroscopy (Dyar et al., Reference Dyar, McGuire and Ziegler1989; Canil et al., Reference Canil, Virgo and Scarfe1990; Davis et al., Reference Davis, Cottrell, Birner, Warren and Lopez2017). Here we extend this conclusion to the Cr-rich and Fe-rich spinels described in this work.
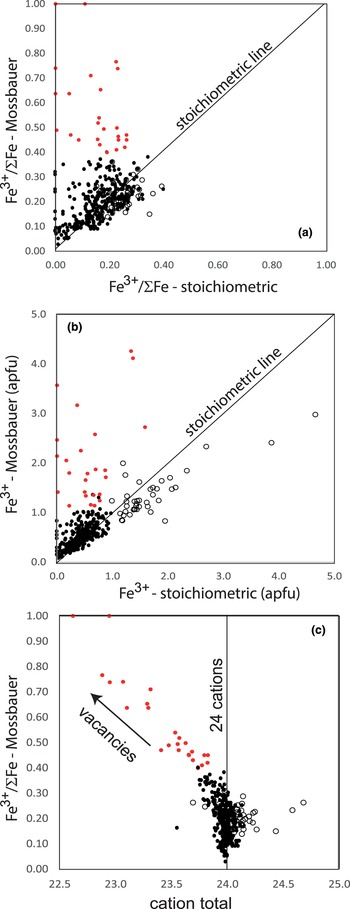
A comparison of (Fe3+/ΣFe)Möss as measured by Mössbauer and (Fe3+/ΣFe)stoich calculated from uncorrected EPMA using the stoichiometric/charge-balance equation of Droop (Reference Droop1987) is shown in Fig. 4a. Many samples are not stoichiometric and there are differences between the different groups of spinels. The Fe3+/ΣFe ratio of the highly oxidised spinels is significantly underestimated by stoichiometric calculations. This is also true for the Cr–Al group of spinels found in spinel peridotites and ophiolitic chromitites, which form a cloud of data points scattered around the 1:1 stoichiometric line, though with quite a high proportion of samples showing that stoichiometry underestimates the Fe3+/ΣFe ratio. In contrast, many high-Fe samples plot below the 1:1 line indicating that stoichiometry overestimates the true Fe3+/ΣFe ratio. A plot of the absolute values of Fe3+ in apfu is given in Fig. 4b, where Fe3+Möss is plotted versus Fe3+stoich and shows the same pattern as in the Fe3+/ΣFe ratio diagrams except that the groups are more clearly separated. A plot of Fe3+ versus the cation sum, from the cation calculation to 32 oxygens, shows the same three groups (Fig. 4c). Most of the Cr–Al samples have values close to 24.0 indicating that they approach stoichiometry. In contrast the Fe-rich and highly oxidised samples deviate from a cation total of 24.0. The highly oxidised samples have increasingly low cation totals as Fe3+ increases.
(a) Fe3+/ΣFeMössbauer vs. Fe3+/ΣFestoichiometric for the three groups of spinels relative to the stoichiometric line; (b) Fe3+Mössbauer vs. Fe3+stoichiometric as atoms per formula unit (apfu) relative to the 1:1 stoichiometric line; (c) Fe3+/ΣFe vs. cation total relative to the stoichiometric (24.0 cation) line. Symbols as in Figs 1b and 3b. Fe3+/ΣFeMössbauer means Fe3+/ΣFe as determined by Mössbauer spectroscopy and Fe3+/ΣFestoichiometric means Fe3+/ΣFe as determined by the Droop (Reference Droop1987) stoichiometric equation. The geological setting of the different sample groups is given in Fig. 1 (a and b).

Discussion
Here we seek to interpret our observations of cation distributions in a subset of our Cr-bearing spinels with regard to site-occupancy calculations obtained from previous X-ray diffraction investigations. First, however, it is important to examine two processes that can alter the Fe3+/ΣFe ratio in spinels in their post-magmatic state and thus have the potential to distort our observations.
Iron enrichment due to subsolidus Fe–Mg exchange occurs in rocks that have cooled slowly and where the chromite is disseminated in a silicate matrix. This is particularly true in dunitic rocks (see for example Rollinson and Adetunji, Reference Rollinson and Adetunji2013; O'Driscoll et al., Reference O'Driscoll, Leuthold, Lenaz, Skogby, Day and Adetunji2021). Such a process will enhance the fe# and reduce the Fe3+/ΣFe ratio to below the primary value, particularly in Fe-rich samples. This process could explain some of the low (Fe3+/ΣFe)Möss ratios in the Cr–Al group found in spinel peridotites and the scattered patterns in samples from ophiolitic mantle and from layered intrusions where the chromite is disseminated (Fig. 4a). However, most of the chromitites in the ophiolitic mantle and in layered intrusions occur as massive chromitites in which Fe–Mg exchange with a silicate phase is absent.
A second process, is metasomatic alteration of spinels by later melts and/or post-magmatic fluids. This was first proposed by Arai (Reference Arai1994) who showed that some spinel compositions can deviate from the olivine–spinel mantle array, either by interaction with alkaline-rich fluids or in cumulate rocks through fractionation. More recently El-Dien et al. (Reference El-Dien, Arai, Doucet, Li, Kil, Fougerouse, Reddy, Saxey and Hamdy2019) has described a form of cryptic metasomatism where aluminous alteration rims on chromite grains, in which magmatic cores with cr# ~0.7 and mg# ~0.5, grade into rims with cr# ~0.55 and mg# ~0.6. These are found in highly serpentinised Neoproterozoic chromitites in the Egyptian desert. The alteration is attributed to aluminous, subduction-related fluids. They propose that such metasomatic processes mask primary spinel compositions leading to an incorrect assessment of their former tectonic setting. In this present investigation the samples closest in composition to those described by El-Dien et al. (Reference El-Dien, Arai, Doucet, Li, Kil, Fougerouse, Reddy, Saxey and Hamdy2019) are the Cr–Al spinels from the Oman ophiolite. Our samples do not show the degree of zoning reported by El-Dien, even though there is good evidence for the migration of aluminous felsic melts, related to subduction processes in the Oman ophiolite (Rollinson, Reference Rollinson2015). We examined our samples with back-scattered electron imaging (see for example Adetunji et al., Reference Adetunji, Everitt and Rollinson2013; Lenaz et al., Reference Lenaz, Adetunji and Rollinson2014) and made multiple EPMA on each grain and did not find the pattern of reverse zoning described by El-Dien et al. (Reference El-Dien, Arai, Doucet, Li, Kil, Fougerouse, Reddy, Saxey and Hamdy2019). For the most part our samples are not obviously altered and contain fresh olivine. A small number of samples show slight oxidation to ferritchromite on chromite rims and some grains contain small (20–50 mm) silicate and oxide inclusions; even so, average compositions from these samples are within the range of samples without alteration or inclusions. We conclude therefore that our samples have not experienced the metasomatic alteration described by El-Dien et al. (Reference El-Dien, Arai, Doucet, Li, Kil, Fougerouse, Reddy, Saxey and Hamdy2019) and therefore our samples are useful in reflecting the original oxidation state of the parent rocks. The metasomatism described by El-Dien et al. (Reference El-Dien, Arai, Doucet, Li, Kil, Fougerouse, Reddy, Saxey and Hamdy2019) is cryptic. A more persuasive example of metasomatism is found in some anorthositic chromitites where clear replacement textures can be observed (Rollinson et al., Reference Rollinson, Appel and Frei2002).
Highly oxidised spinels
The highly oxidised spinels have (Fe3+/ΣFe)Möss > 0.4 (Fig. 2) and high Fe3+/(Fe3++Al+Cr) ratios in the range 0.16–0.46 (mean = 0.288). However, the Fe3+/ΣFe ratio is significantly underestimated by stoichiometric calculations and these spinels have increasingly low cation totals as Fe3+ increases. (Fig. 4a,c). Examination with the scanning electron microscope shows minimal alteration and no evidence that these grains represent a microscopic mixture of phases (Lenaz et al., Reference Lenaz, Adetunji and Rollinson2014).
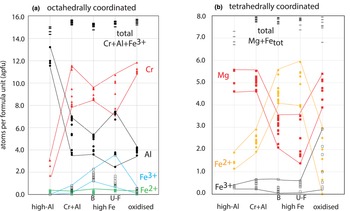
Site-occupancy calculations on a subset of these samples (n = 7) reported in Lenaz et al. (Reference Lenaz, Adetunji and Rollinson2014) and plotted in Fig. 5 indicate that the tetrahedrally coordinated site contains Mn and most of the Mg (94–100%) and the octahedrally coordinated site contains all the Cr, Ti, Ni, V and most of the Al (91–100%). Fe2+ is distributed between the two sites with 0.0–2.97 apfu on the tetrahedrally coordinated site and 0.0–0.43 on the octahedrally coordinated site; similarly, there are 0.23–2.92 apfu Fe3+ on the tetrahedrally coordinated site and 0.16–0.56 apfu on the octahedrally coordinated site. Estimates of vacancies are up to 1.14 apfu on the tetrahedrally coordinated site and up to 0.40 on the octahedrally coordinated site. Though these values are model dependent (see Lenaz et al., Reference Lenaz, Adetunji and Rollinson2014 for the details) site-occupancy calculations show that the highly oxidised spinels are characterised by (a) high Fe3+ and low Fe2+ on the tetrahedrally coordinated site, and (b) low Fe3+ and low Fe2+ on the octahedrally coordinated site, in addition to higher levels of vacancies on both sites. The low concentration of octahedrally coordinated Fe3+ is not consistent with magnetite substitution, but rather implies the oxidation of Fe2+ to Fe3+ on the tetrahedrally coordinated site as originally proposed by Nell and Pollack (Reference Nell and Pollack1998).
Site occupancies in the high-Al, Cr+Al, high Fe and the highly oxidised spinel groups in atoms per formula unit (apfu). (a) Octahedrally coordinated site occupancies; (b) tetrahedrally coordinated site occupancies. U-F = data from the Ujaragssuit and Fiskenaesset intrusions, B = data from the Bushveld intrusion. Data from Lenaz et al. (Reference Lenaz, Braidotti, Princivalle, Garuti and Zaccarini2007, Reference Lenaz, Adetunji and Rollinson2014), Rollinson et al. (Reference Rollinson, Adetunji, Lenaz and Szilas2017) and Perinelli et al. (Reference Perinelli, Bosi, Andreozzi, Conte, Oberti and Armienti2012, Reference Perinelli, Andreozzi, Conte and Armienti2014).

Where the field relationships have been established for these highly oxidised chromites they are associated with post-magmatic shearing and cataclasis, some of which occurred at high temperature (Lenaz et al., Reference Lenaz, Adetunji and Rollinson2014; Adetunji et al., Reference Adetunji, Everitt and Rollinson2013; Figueiras and Waerenborgh, Reference Figueiras and Waerenborgh1997; Menagazzo et al., Reference Menagazzo, Carbonin and Della Giusta1997). The experimental observation of Davis and Cottrell (Reference Davis and Cottrell2018) showed that in a given experiment as $f_{\rm O_2}$ increases, the total abundance of Fe3+ increases in the rock-system and Fe3+ is preferentially partitioned into spinel at the expense of Cr and Al. This implies a highly oxidising environment for the shearing/ cataclasis indicating either near-surface or hydrous conditions.
The Cr–Al group
The Cr–Al spinel group are characterised by a strong negative correlation on a Cr–Al cation plot (R 2 = 0.997). Relative to the other spinel groups they are low in Fetotal (Fig. 3b) and have a low (Fe3+/(Fe3++Al+Cr) ratio (0.007–0.18, mean = 0.055). Most, but not all, samples are stoichiometric (Fig. 4a).
Site occupancy data on a subset of relatively Cr-rich samples (n = 11, Lenaz et al., Reference Lenaz, Adetunji and Rollinson2014) indicate that all of the Mn and 93–99% of the Mg and 84–100% of the Fe2+ are on the tetrahedrally coordinated site and that all of the Cr and 96–100% Al are on the octahedrally coordinated site (Fig. 5). These compositions therefore approximate to normal spinels consistent with the experimental work of Nell et al. (Reference Nell, Wood and Mason1989) and Nell and Wood (Reference Nell and Wood1991) in the synthetic systems Fe3O4–FeAl2O4 and Fe3O4–MgCr2O4. The relatively low concentrations of Fe3+ are almost equally distributed between the tetrahedrally and octahedrally coordinated sites (0.23–0.66 apfu on the tetrahedrally coordinated site and 0.27–0.80 apfu on the octahedrally coordinated site). This agrees with the Mössbauer studies of Wood and Virgo (Reference Wood and Virgo1989) and Dyar et al. (Reference Dyar, McGuire and Ziegler1989) in natural spinels from spinel lherzolite xenoliths who showed that some Fe3+ is tetrahedrally coordinated. In the most aluminous spinels, designated high-Al in Fig. 5, (cr# < 0.2, n = 4) 80–89% of the Mg and 83–88% of the Fe2+ are on the tetrahedrally coordinated site and 90–95% of the Al is on the octahedrally coordinated site. Fe3+ concentrations are very low (0.3–0.4 apfu) and Fe3+ is located entirely on the tetrahedrally coordinated site (Fig. 5) (data from Perinelli et al., Reference Perinelli, Bosi, Andreozzi, Conte, Oberti and Armienti2012; Reference Perinelli, Andreozzi, Conte and Armienti2014).
The high-Fe group
The high-Fe spinels are characterised by Cr > 8.0 apfu, Cr/Cr+Al > 0.49 (Fig. 3a,b) and Fetotal > 4.2 apfu (Fig. 3b). They have higher Fe3+ than for comparable Cr-rich samples in the Al–Cr group (Fig. 4b) and Fe3+Möss values plot below the stoichiometric line on a Fe3+Möss vs. Fe3+stoich plot (Fig. 4b). In contrast to the Al–Cr spinels they define a weak positive trend on a MgO–cr# plot (Fig. 3c).
We reported site-occupancy data for high-Fe spinels from the Ujaragssuit (n = 4) and Fiskenaesset (n = 4) intrusions from Greenland in Rollinson et al. (Reference Rollinson, Adetunji, Lenaz and Szilas2017). In these samples, all the Mn, 84–100% of the Mg and 86–95% of the Fe2+ is on the tetrahedrally coordinated site and all of the Ti, Ni and Cr and 90–100% Al are on the octahedrally coordinated site (Fig. 5, column UF). A small amount of Fe3+ is present on the tetrahedrally coordinated site (0.10–0.60 apfu) with most on the octahedrally coordinated site (0.75–1.65, one sample 3.5 apfu). There are also data from the Bushveld Complex, which, though not the same samples as reported here, are from the same horizons of the intrusion (n = 12, Lenaz et al., Reference Lenaz, Braidotti, Princivalle, Garuti and Zaccarini2007). These data also show that all the Mn, Zn and 83–96% of the Mg and 94–100% of the Fe2+ are on the tetrahedrally coordinated site and that all of the Ti, Ni, V and Cr and 94–100% Al are on the octahedrally coordinated site (Fig. 5 column B). A small amount of Fe3+ is present on the tetrahedrally coordinated site (0.06–0.60 apfu) with the major portion on the octahedrally coordinated site (1.2–2.3 apfu). In both datasets the site occupancy data indicate that these spinels approximate to normal spinels with most of the Fe3+ on the octahedrally coordinated site.
Given that almost all of the Al and all of the Cr are located on the octahedrally coordinated sites in both the Cr–Al spinels and the high-Fe spinels the two trends in Fig. 3a reflect differences in the amount of Fe3+ on the octahedrally coordinated site. The Cr–Al spinels contain a small amount of octahedrally coordinated Fe3+ (0.27–0.80 apfu, mean = 0.46 apfu) decreasing to zero in the most aluminous samples; in contrast in the high-Fe spinels a greater amount of octahedrally coordinated Fe3+ is present (mean = 1.42 apfu in the Ujaragssuit and Fiskenaesset intrusions, mean = 1.62 apfu in the Bushveld).
Recent experimental and thermodynamic studies of peridotite melting by Gaetani, (Reference Gaetani2016), Sorbadere et al. (Reference Sorbadere, Laurenz, Frost, Wenz, Rosenthal, McCammon and Rivard2018) and Davis and Cottrell (Reference Davis and Cottrell2021) have investigated the partitioning of Fe2O3 between spinel and basaltic melt (${\rm D}_{{\rm F}{\rm e}_2{\rm O}_3}^{{\rm spl}/{\rm melt}}$ ). Gaetani (Reference Gaetani2016) showed that (Fe3+/ΣFe)spin decreases with increasing temperature and pressure although there is some uncertainty about the role of $f_{\rm O_2}$
 (Sorbadere et al., Reference Sorbadere, Laurenz, Frost, Wenz, Rosenthal, McCammon and Rivard2018). Of significance however, is the observation by Davis and Cottrell (Reference Davis and Cottrell2021) that the partition coefficient increases as a function of the Fe2O3 concentration in the spinel, such that Fe2O3 is more compatible in the spinels with more Fe. The observation that ${\rm D}_{{\rm F}{\rm e}_2{\rm O}_3}^{{\rm spl}/{\rm melt}}$
 increases as a function of the Fe2O3 concentration in spinel is important in this present study because it explains our finding that the high-Fe group of chromites have higher Fe3+. More recently Ajayi et al. (Reference Ajayi, Davis and Cottrell2023) have reported that the spinel-melt Fe3+ partition coefficient also increases with spinel cr#. They show that at a given $f_{\rm O_2}$
 ${\rm D}_{{\rm F}{\rm e}_2{\rm O}_3}^{{\rm spl}/{\rm melt}}$
 increases by a factor of ~2 as spinel cr# increases by a factor of ~3.
The observations of Gaetani (Reference Gaetani2016) and Davis and Cottrell (Reference Davis and Cottrell2021) show that there is an inverse correlation between the partition coefficient ${\rm D}_{{\rm F}{\rm e}_2{\rm O}_3}^{{\rm spl}/{\rm melt}}$ and temperature; this forms a further control on the partitioning of Fe3+ into chromite in cooling mafic intrusions.
Taking together our empirical observations with the experimental data reported above, it is evident that in high Fe–Cr melts available Fe3+ is preferentially partitioned into octahedrally coordinated sites in chrome spinels. Our data suggest partitioning occurs where Cr ions occupy more than 50% of the octahedrally coordinated sites so distorting the spinel lattice to accommodate the larger Fe3+ octahedrally coordinated ions.
Conclusion: Implications for microprobe correction procedures for Fe3+ in spinel
Davis et al. (Reference Davis, Cottrell, Birner, Warren and Lopez2017) showed recently, in an update of the work of Wood and Virgo (Reference Wood and Virgo1989), that Fe3+ can be accurately measured in spinels by EPMA using a set of secondary microprobe standards in which Fe3+ had been determined by Mössbauer spectroscopy. They used the correlation between the offset between (Fe3+/ΣFe)Möss and (Fe3+/ΣFe)EPMA to correct the Fe3+/ΣFe values calculated from EPMA/stoichiometric constraints. Davis et al. (Reference Davis, Cottrell, Birner, Warren and Lopez2017) recognised that although this correction works well for aluminous spinels in lherzolites it might not be appropriate for spinels outside this compositional range.
Our purpose here has been to place this inference on a sound footing by using data from Cr-rich and Fe-rich spinels in which Fe3+ has been accurately determined. Our data show that in addition to the well-known Cr–Al group of spinels there is also a Fe3+–Cr–Al group. Microprobe correction procedures developed for Cr–Al spinels will not apply to spinels from the Fe3+–Cr–Al group as they lie outside the calibration and will lead to errors in calculated Fe3+, as proposed by Davis et al. (Reference Davis, Cottrell, Birner, Warren and Lopez2017). The distinction between the two spinel groups is also clear on a MgO–cr# plot, where they define two distinct trends, further indicating that spinels of the Fe3+–Cr–Al group are not amenable to the correction procedures relevant to Cr–Al spinels.
For this reason, we urge caution in estimating Fe3+ in Cr-bearing spinels determined by EPMA using stoichiometry and in particular samples with high concentrations of Cr and Fe. We suggest a screening method for uncorrected EPMA as follows:
(1) Recalculate the data to cations to 32 oxygens without estimating Fe3+;
(2) Sort the data on the basis of (Al+Cr) apfu: samples with (Al+Cr) > ~15.2 belong to the high Cr–Al group; samples with (Al+Cr) < ~15.2 belong to the high Fe group;
(3) This classification can be checked by plotting the data on an Al vs. Cr cation plot: members of the Cr–Al group plot on a trend that intersects the Cr axis at >15.0 apfu; members of the high-Fe group plot below this line and define a trend that intersects the Cr axis at ~13.0 apfu (Fig. S3a);
(4) A further (less precise) check can be made by plotting the data on a cr# vs. fe# diagram: the Cr–Al group plot with fe# <~ 0.5; samples with fe# > 0.5 belong to the high-Fe group (Fig. S3b).
Stoichiometric estimates of Fe3+ for uncorrected EPMA data for the Cr–Al spinels are close to the true values as determined by Mössbauer, although we would recommend that if accurate Fe3+/ΣFe ratios are required for $f_{\rm O_2}$ calculations then the Wood and Virgo (Reference Wood and Virgo1989) / Davis et al. (Reference Davis, Cottrell, Birner, Warren and Lopez2017) correction must also be applied. Our data do not confirm the correction procedure proposed by Langa et al. (Reference Langa, Jugo, Leybourne, Grobler, Adetunji and Skogby2021) for Fe-rich spinels. Finally, it is important to note that samples in the highly oxidised group are very difficult to identify without Mössbauer spectroscopy. However, field evidence of high-temperature shearing and/or petrographic evidence of cataclasis should alert the user (see Adetunji et al., Reference Adetunji, Everitt and Rollinson2013). Recognising them is important, for misidentification can lead to errors in Fe3+, and resultant errors in Fe3+/ΣFe as great as 0.2–0.5 (Fig. 4a).
Acknowledgements
We thank Rohaiza bint Zachariah (Sultan Qaboos University), Ben Sutherland, Dona John, Callum Prescott and Georgia Pulford (all from the University of Derby) for their assistance in the many days of preparation and hand picking of pure chromite concentrates for Mössbauer spectroscopy and Stuart Kearnes (University of Bristol) and Graham Souch (University of Derby) for help with the analytical work. This study was supported by grant IG/SCI/ETHS/ 04/02 from the Research Committee of the College of Science, Sultan Qaboos University, Oman, RLTF 2011 and 2012 grants from the University of Derby and an award from the Nuffield Foundation Science Bursary scheme. Samples from Ujaragssuit and Seqi were collected in association with the Greenland Geological Survey; the Fiskenaesset samples were provided by Brian Windley. We thank Duncan Jarman for the Brakfontein (Bushveld) drill core. We are very grateful to Suzanne Birner, Vincenzo Stagno and several anonymous reviewers for their helpful comments on earlier versions of this manuscript that have led to substantial improvements.
Supplementary material
The supplementary material for this article can be found at https://doi.org/10.1180/mgm.2023.68.
Competing interests
The authors declare none.