I. INTRODUCTION
Pipeline steels used to transport oil and natural gas are affected by hydrogen-induced cracking (HIC). The HIC phenomenon has been recognized as one of the most important modes of failure in sour service environments. HIC cracks in pipeline steels basically nucleate and propagate through the mid-thickness of the pipe body where the center-segregation of elements occurs. Reference Mohtadi-Bonab, Szpunar, Basu and Eskandari1–Reference Depover, Pérez Escobar, Wallaert, Zermout and Verbeken4 Several techniques have been developed to reduce HIC susceptibility in pipeline steels. Since the center of the cross section suffers from HIC cracks, there are some efforts to remove or reduce the amount of segregated elements and even develop a homogeneous and resistant microstructure. To this purpose, thermo–mechanically controlled processes (TMCP) combined with accelerated cooling rates provide a key method to reduce the hard phases and produce a homogeneous microstructure that consists of fine grain irregular ferrite, small amounts of bainite, and martensite-austenite constituents. Reference Schwinn and Thieme5–Reference Collura, Staudt, Bauer, Schewinn, Clipet and Amoris7 A new approach, which has been recently developed to decrease the probability of HIC cracking in pipeline steel, is crystallographic texture and grain-boundary engineering. There are several studies claiming that the {111} dominant texture decreases the probability of cracking by providing resistant paths for HIC crack propagation. On the other hand, the {100} dominant texture may increase HIC susceptibility by providing easy intergranular paths for HIC cracking. Reference Mohtadi-Bonab, Szpunar and Razavi-Tousi8–Reference Venegas, Caleyo, Herrera, Hernández-Sánchez and Hallen12 It is also postulated that some dominant textures such as {111}, {112}, and {110} fibers may reduce the HIC susceptibility by reducing the number of both intergranular and transgranular low resistance paths. These textures are expected to decrease the probability of crack coalescence and stepwise HIC growth. Moreover, these textures may provide low-energy boundaries such as coincidence site lattice (CSL) boundaries and low-angle grain boundaries that increase the intergranular HIC resistance. Reference Venegas, Caleyo, Hallen and Baudin13 In this work, due to the importance of crystallographic texture and grain-boundary engineering on the HIC phenomenon in pipeline steel, the evolution of texture and its role on HIC was investigated through different rolling paths and annealing treatments. The effect of different parameters on the cracking process such as dominant textures, grain boundaries, Kernel Average Misorientaion (KAM), and recrystallized fraction is discussed.
II. EXPERIMENTAL PROCEDURE
A. Cold-rolling and annealing treatments
An API 5L X60 pipeline steel plate was investigated in this study. The chemical composition of this steel is shown in Table I. The rolling, transverse, and normal directions of X60 steel are simply abbreviated as RD, TD, and ND, respectively. Four specimens with the dimensions of 40 (RD) × 40 (TD) × 6 (ND) mm were cut from the as-received X60 steel plate. The first sample is named as-received (AR) specimen. The second, third, and fourth specimens were cold rolled in the rolling direction for 20, 50, and 90% reduction in thickness and then annealed at 850 °C for 90 s. We abbreviated the names of the 20, 50, and 90% cold-rolled and annealed specimens as 20% CRA, 50% CRA, and 90% CRA, respectively. After the cold-rolling and annealing processes, the RD-TD surfaces of rolled samples and the AR specimen were polished with 1 µm diamond paste at the final stage. The texture measurements were done on RD-TD surfaces of four specimens using a Bruker D8 Discover diffraction with a two dimensional x-ray diffraction system using Cr Kα radiation (Bruker Corporation, Karlsruhe, Germany). When texture measurements were completed, Multex3, Tools and Resmat-Textools software facilities were used for post-processing to calculate pole figures and orientation distribution functions (ODFs). For electron backscatter diffraction (EBSD) measurements, all RD-TD surfaces were vibrometry-polished for 12 h using a slurry silica solution. We used a SU 6600 Hitachi field emission scanning electron microscope (Hitachi Corporation, Tokyo, Japan) with an Oxford Instruments Nordlys nano EBSD detector (Abingdon, Oxfordshire) to do EBSD measurements. During the EBSD measurements, a pretilted sample holder was used to tilt the sample at 70° from the horizontal plane. Tango and Mambo facilities that are parts of HKL Channel 5 software were also used to post process and analyze of the raw EBSD data.
Chemical composition of the X60 pipeline steel (wt%).

B. Electrochemical hydrogen-charging experiments
After cold-rolling and annealing treatments, four samples from AR, 20% CRA, 50% CRA, and 90% CRA specimens with dimensions of 130 (TD) × 25 (TD) mm were prepared. The thickness of samples was not changed after cold-rolling. We used an electrochemical hydrogen-charging method to charge the specimens. Therefore, a 0.2 M sulfuric acid solution was used for charging and 3 g/L ammonium thiocyanate (NH4SCN) was added to the solution as a hydrogen recombination poison to prevent the formation of hydrogen bubbles on the surface of the specimen and increase the amount of hydrogen entering the steel. All specimens were ground with 600 grit SiC emery paper and degreased ultrasonically with acetone for half an hour. Each specimen was separately placed in a glass test vessel and the vessel was filled with two liters of charging solution. The steel specimens were electrochemically charged for 3 h using an Instek DC power supply (GW Instek Company, Taipei City, Taiwan) with a constant current of 20 mA/cm2.
III. RESULTS AND DISCUSSION
A. EBSD measurements
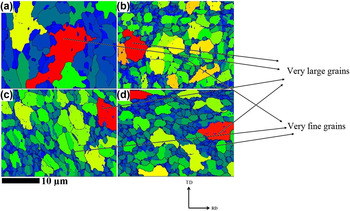
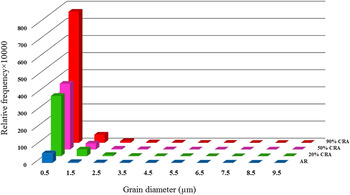
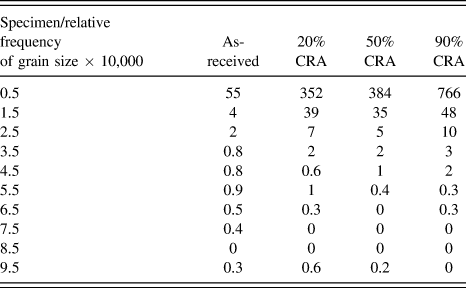
Figures 1(a)–1(d) show the grain size map at RD-TD plane in the AR, 20% CRA, 50% CRA, and 90% CRA specimens. In these figures, very fine grains were shown with dark blue color while very large grains got red color. The grain size distribution based on the relative frequency was shown in Fig. 2. To observe grain size differences, all data were presented in Table II. In AR specimen, the grains are larger than in other specimens. Also, the relative frequency of fine grains (0.5 µm in length) in AR specimen is lower than other specimens. It is observed that the highest relative frequency of fine grains belongs to the 90% CRA specimen. It is worth-mentioning that the number of equiaxed grains increases with the increase of rolling percentage. In other word, we see almost both types of elongated and equiaxed grains in AR, 20% CRA, and 50% CRA specimens. However, this nature is less observed in the case of 90% CRA specimen. Therefore, one may conclude that the grains have been properly refined via cold rolling and annealing treatments in cold rolled and annealed specimens. Several very large and very fine grains were shown by arrows in Figs. 1(a)–1(d). It should be considered that very fine grains are rarely seen in AR specimen. The effect of grain size on HIC susceptibility is controversial and there are different opinions about it in the literature. Reference Haq, Muzaka, Dunne, Calka and Pereloma15,Reference Hejazi, Haq, Yazdipour, Dunne, Calka, Barbaro and Pereloma16 For instance, the role of other parameters, such as dislocation density, Kernel Average Misorientation data, and recrystallized region, should be also accurately considered in evaluating the HIC susceptibility. Reference Mohtadi-Bonab, Eskandari and Szpunar14 The findings of Yazdipour et al. document that the highest HIC resistance is observed in the steel with an optimum grain size. Reference Yazdipour, Haq, Muzaka and Pereloma17 In our previous work, we observed that the specimen with smaller grain size had a better HIC resistance than others with larger grains. Reference Mohtadi-Bonab, Szpunar, Collins and Stankievech18 However, the grain size difference in tested samples was very low and such a conclusion may not be generalized for different samples with higher differences in grain size. The grain boundaries in pipeline steels are considered as weak or reversible traps. Reference Choo and Young Lee19 Grain boundaries consist of dislocation arrays. Cracking will start when somewhere in the microstructure will be accumulation of hydrogen and pressure build-up.
Grain size map at the surface of RD-TD plane in (a) AR X60, (b) 20% CRA X60, (c) 50% CRA X60, and (d) 90% CRA X60 pipeline steel specimens.

Distribution of grain size in AR, 20% CRA, 50% CRA, and 90% CRA X60 pipeline steel.

Distribution of grain size in AR, 20% CRA, 50% CRA, and 90% CRA X60 pipeline steel versus relative frequency.

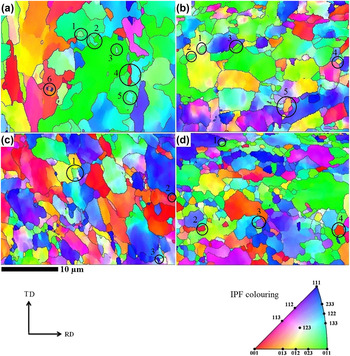
Figures 3(a)–3(d) show the inverse pole figure maps for the AR, 20% CRA, 50% CRA, and 90% CRA specimens. In this work, the system coordinates for IPF chosen was parallel to the normal direction. As shown in this figure, the local texture for AR specimen is weak. As discussed in our previous works, the random texture makes pipeline steel highly susceptible to HIC. Reference Mohtadi-Bonab, Szpunar and Razavi-Tousi8,Reference Mohtadi-Bonab, Eskandari and Szpunar14 However, in AR specimen, there are several large grains with ζ-fiber (〈110〉∥ND) and some recrystallized fine grains with γ-fiber (〈111〉∥ND) or close to it formed within these large grains. Furthermore, several recrystallized fine grains with θ-fiber (〈100〉∥ND) are observed within large grains in AR steel. Since γ-fiber texture is known as the most beneficial texture to improve the HIC resistance in pipeline steel, Reference Mohtadi-Bonab, Szpunar and Razavi-Tousi8,Reference Venegas, Caleyo, Hallen and Baudin13 the change of ζ-fiber to γ-fiber is suitable. In 20% CRA specimen, we observe that the weak texture of AR specimen was changed to ζ-fiber and γ-fiber. Also, some grains with θ-fiber are seen in this specimen. In this specimen, the recrystallized fine grains were formed along the grain boundaries of large grains and mostly have ζ-fiber and γ-fiber orientations. However, macro-texture results are required to discuss more accurately about the dominant texture in each specimen and its role of HIC related failure. In 50% CRA specimen, as shown in Fig. 3(c), we observe the accumulation of grains with θ-fiber and γ-fiber. Grains with θ-fiber increase HIC susceptibility in pipeline steel while grains with γ-fiber improve HIC resistance. Reference Venegas, Caleyo, Baudin, Espina-Hernandez and Hallen9–Reference Venegas, Caleyo, Hallen and Baudin13 With the increase of rolling percentage, in 90% CRA specimen as shown in Figs. 3(d) and 3(a) considerable change are seen compared with the 50% CRA specimen. In this specimen, the number of grains with ζ-fiber was increased while the grains with θ-fiber was decreased.
Inverse pole figure map at the surface of RD-TD plane in (a) AR X60, (b) 20% CRA X60, (c) 50% CRA X60, and (d) 90% CRA X60 pipeline steel specimens.

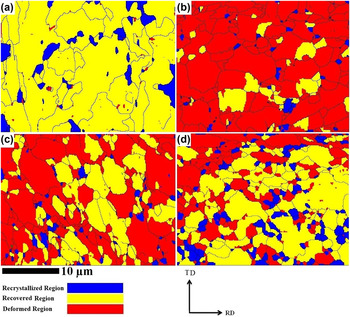
The recrystallization maps for the AR, 20% CRA, 50% CRA, and 90% CRA specimens are shown in Figs. 4(a)–4(d). In these figures, the recrystallized, recovered, and deformed regions are shown with blue, yellow, and red colors, respectively. The grain orientation spread (GOS) method is able to identify a recrystallized grain in a set of plastically deformed grains. The GOS of a recrystallized grain is usually less than 2°. However, the GOS of a recovered grain is between 2° and 4° and that of deformed grains is over 4°. This method calculates the average orientation of each grain and then compares the misorientation of each pixel in the grain from its average to determine the average orientation spread. The recrystallized grains are undeformed grains and do not store elastic energy. During the recrystallization process, the stored energy of deformation decreases by the formation and migration of HAGBs. In the recovery process, the defects are removed or rearranged in order to decrease the stored energy.
EBSD recrystallization fraction map at the surface of RD-TD plane in (a) AR X60, (b) 20% CRA X60, (c) 50% CRA X60, and (d) 90% CRA X60 pipeline steel.

Therefore, the recrystallized and recovered grains has higher HIC resistance than deformed grains.
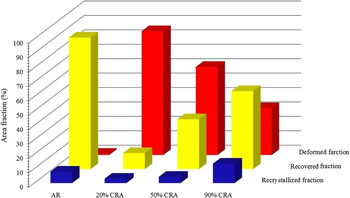
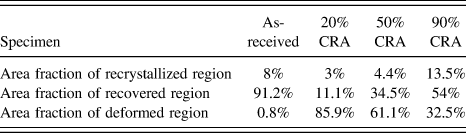
The results of the recrystallization map are shown in Fig. 5 and its data were presented in Table III. If we look at Figs. 4 and 5, we see that the area fraction of deformed grains in the AR specimen is very low. We previously showed that the AR specimen is susceptible to HIC phenomenon as HIC cracks appeared after the HIC standard test at the mid-thickness of steel plate. Reference Mohtadi-Bonab, Szpunar and Razavi-Tousi20 However, the high fraction of deformed regions in the rolled specimens is considered as a possible reason for lower resistance to HIC. As seen in this figure, the area of deformed grains in the 20, 50, and 90% CRA specimens is higher than that in the AR specimen. The deformed grains with high stored energy are potential sites for HIC crack propagation. As seen in the KAM map, the fraction of deformed grains in the 90% CRA specimen is lower than that in the 20 and 50% CRA specimens.
Area fraction of recrystallized, recovered, and deformed region at the surface of RD-TD plane in AR X60, 20% CRA X60, 50% CRA X60, and 90% CRA X60 pipeline steel.

Area fraction of recrystallized, recovered, and deformed region in AR X60, 20% CRA X60, 50% CRA X60, and 90% CRA X60 pipeline steel.

Coming back to Fig. 3(a), one can see that there are several recrystallized grains formed inside large recovered grains. The recrystallized grains are strain free and have higher resistance against hydrogen crack propagation. Most of these grains, grains 1, 3, and 5 and 6 as shown in Fig. 3(a), were formed inside the grains with ζ-fiber while others such as grains 2 and 4 were formed along the grain boundaries. The orientation of recrystallized grains, 1, 2, 3, and 5, are basically 〈111〉∥ND or close to it which is suitable to prevent HIC propagation while several grains, 4 and 6, have 〈100〉∥ND orientation or close to it. In 20% CRA specimen, the dominant orientation of recrystallized grains, grains 1, 2, and 3, are 〈110〉∥ND while grains 4 and 5 have orientations close to 〈100〉∥ND. In 50 and 90% CRA specimens, three different orientations, such as 〈100〉∥ND 〈110〉∥ND and 〈111〉∥ND, are seen among recrystallized grains. It is worth-mentioning that most of recrystallized grains inside AR specimen were formed inside grains while most of recrystallized grains inside cold rolled specimens were formed along grain boundaries. As is clear, the elongated grains have a high stored energy of deformation while the equiaxed grains have a low stored energy. Therefore, the equiaxed grains can resist against HIC cracking better than the elongated grains do. As shown in Figs. 3(a)–3(c), we see both types of elongated and equiaxed grains in AR, 20% CRA and 50% specimens but the 90% CRA specimen have mostly equiaxed grains. In other words, based on the grain shape, 90% CRA specimen may show the better HIC resistance compared with other specimens. However, as we discussed, there are other important factors affecting HIC susceptibility that should be considered. It is notable that sometimes elongated grains show a higher resistance against crack propagation. This happens when the applied load is perpendicular to the rolling direction. In other words, elongated grains have small width and when the crack is prone to propagate in transverse direction, it reaches promptly to the grain boundary and crack propagation stops. However, when the hydrostatic type of loading is applied, such as we see about HIC cracking in the oil and gas pipeline steels, the mechanical properties of equiaxed grains should be the same in all directions. Therefore, such equiaxed grains with high angle grains boundaries shows higher resistance to HIC phenomenon than the elongated grains. This is due to the isotropic mechanical properties of equiaxed grains. However, such equiaxed grains have high angle grain boundaries due to sub grain formation as the result of dynamic recovery after 90% cold rolling and annealing. Those grains are not free of dislocation which is harmful for HIC phenomenon because dislocations act as free path for hydrogen diffusion. Hence it is expected that the equiaxed grains with high angle grain boundaries (after dynamic recrystallization) which are free of dislocation show higher HIC resistance compared with elongated ones in pipeline steel.
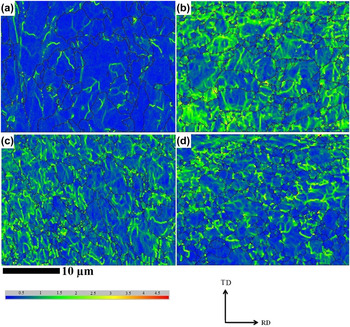
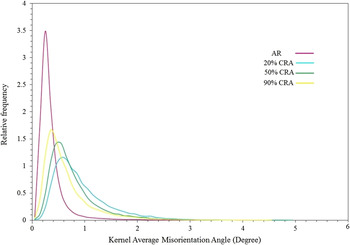
Figures 6(a)–6(d) show the KAM maps for the AR, 20% CRA, 50% CRA, and 90% CRA specimens. The KAM map is representative of a local misorientation between a given point and its nearest neighbor inside a grain. Based on the KAM maps, one can observe that the areas with a high KAM data in the AR specimen are very small compared with the other specimens. The KAM data versus relative frequency of occurrence, as illustrated in Fig. 7, clearly shows that the frequency of KAM data is lower in the AR specimen. We observed that the highest KAM data belongs to the 20% CRA specimen. We expected that the highest KAM data would be observed in the 90% CRA specimen. However, the recovery and recrystallization in the 50 and 90% CRA specimens might happen faster than that in the 20% CRA specimen. However, the key point is that the relative frequency of the high KAM data is high in the 20, 50, and 90% CRA specimens and this confirms that the dislocation density in all these samples is higher than in the AR specimen. Based on the fact that HIC susceptibility is in direct proportion with the density of hydrogen traps, one may conclude that HIC susceptibility increases with the increase of cold-rolling percentage.
Kernel average misorientation map at the surface of RD-TD plane in (a) AR X60, (b) 20% CRA X60, (c) 50% CRA X60, and (d) 90% CRA X60 pipeline steel specimens.

Kernel average misorientation (KAM) degree versus relative frequency at the surface of RD-TD plane in AR X60, 20% CRA X60, 50% CRA X60, and 90% CRA X60 pipeline steel.

B. Texture studies
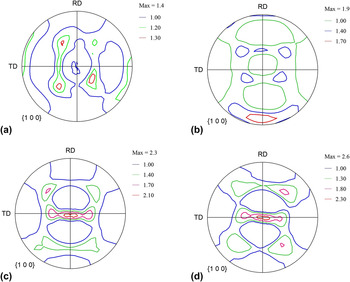
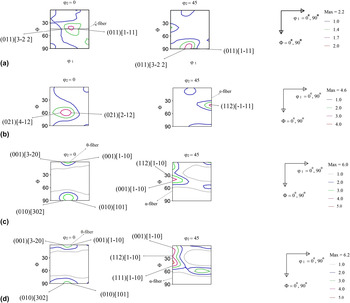
Figures 8(a)–8(d) show the {100} pole figures for the AR, 20% CRA, 50% CRA, and 90% CRA specimens. As shown in these figures, the intensity of the pole figures increases from the AR specimen to the 90% CRA specimen. In the 90% CRA specimen, we observed the highest intensity with the amount of 2.6 × R. One can also see that when the percentage of cold rolling reduction increased, the {100} dominant texture was more pronounced with a higher intensity. In relation to previous studies, the {100} dominant texture increased the number of intergranular and transgranular low resistance cleavage paths. Reference Mohtadi-Bonab, Szpunar and Razavi-Tousi8–Reference Venegas, Caleyo, Hallen and Baudin13 Therefore, one may consider that the effect of cold rolling and annealing was detrimental to the HIC phenomenon. In ferritic steels, ODFs at φ2 = 0° and φ2 = 45° play an important role in determining the main texture components. Figures 9(a)–9(d) show the ODFs at φ2 = 0° and φ2 = 45° for the AR, 20% CRA, 50% CRA, and 90% CRA specimens. We observe that the intensity of the ODFs increased from the AR specimen with an intensity of 2.2 × R to the 90% CRA with an intensity of 6.2 × R.
{100} pole figure at the surface of RD-TD plane in (a) AR X60, (b) 20% CRA X60, (c) 50% CRA X60, and (d) 90% CRA X60 pipeline steel specimens.

ODF maps at φ2 = 0° and φ2 = 45° at the surface of RD-TD plane in (a) AR X60, (b) 20% CRA X60, (c) 50% CRA X60, and (d) 90% CRA X60 pipeline steel specimens.

The main fibers in pipeline steels, including α, ε, γ, η, θ, and ζ fibers, were calculated from the ODFs and are shown in Figs. 3(a)–3(f). In α-fiber, the fiber axis 〈110〉 is parallel to the rolling direction that includes {001}〈110〉, {112}〈110〉, and {111}〈110〉 components. In ε-fiber, the fiber axis 〈011〉 is parallel to the transverse direction including {001}〈110〉, {112}〈111〉, {111}〈112〉, and {011}〈100〉 components. In γ-fiber, the fiber axis 〈111〉 is parallel to the normal direction that includes {111}〈110〉 and {111}〈112〉 components. In η-fiber, the fiber axis 〈100〉 is parallel to the rolling direction that includes {001}〈100〉 and {011}〈100〉. In θ-fiber, the fiber axis 〈001〉 is parallel to the normal direction including {001}〈100〉 and {001}〈110〉. Finally, in ζ-fiber, the fiber axis 〈011〉 is parallel to the normal direction including {011}〈100〉, {011}〈211〉, {011}〈111〉, and {011}〈011〉 components. Reference Humphreys and Hatherly21–Reference Jamaati, Toroghinejad, Mohtadi-Bonab, Edris, Szpunar and Salmani23 At this time, the role of textures described by these fibers on HIC crack propagation has not been clearly understood. However, the findings of Venegas et al. document that the main reason for HIC transgranular cracking in X46 pipeline steel is the cleavage along the {100} planes. Reference Venegas, Caleyo, Hallen, Baudin and Penelle10 Additionally, they observed that HIC cracks might propagate through the {011}, {112}, and {123} families of slip planes. In their research, the dominant {111}, {112}, and {011} textures are recognized as HIC crack-arrest textures. As shown in Fig. 9(a), (011)[3−22] and (011)[1−11] texture components have highest intensity (2 × R) in AR specimen. Based on the above-mentioned literature, these components may be beneficial in increasing HIC resistance; however, its intensity is not high and it can be considered as a weak texture. In 20% CRA specimen, as shown in Fig. 9(b), three other texture components, such as (021)[4−12], (021)[2−12], and (112)[−1−11], with the intensity of 4 × R are observed. In this specimen, we clearly see that the intensity of ODF compared with the AR specimen was increased; however, the effect of (021)[4−12] and (021)[2−12] texture components on HIC susceptibility have not been clearly understood in the literature. However, as previously discussed, (112)[−1−11] texture component may increase HIC resistant in pipeline steel. By increasing the rolling percentage, a harmful texture to HIC is appeared. As seen in Figs. 9(c) and 9(d), the (001) texture recognized as an increasing factor of HIC susceptibility was appeared. Figure 9(c) shows ODFs at φ2 = 0° and φ2 = 45° in 50% CRA specimen. As shown in ODF at φ2 = 0°, (001)[3−20], (010)[302], (001)[1−10] and (010)[101] texture components have high intensity (6 × R). Based on the ODF at φ2 = 45°, the intensity of α-fiber in mainly centered at (001)[1–10] and (112)[1–10] components. Interestingly, when the rolling percentage increases from 50% CRA specimen to 90% CRA specimen, the main texture components and the intensity of ODF as well do not change considerably. The only difference in the case of 90% CRA specimen is that (111)[1–10] texture component is observed in ODF at φ2 = 45°. As a result, we see that with the increase of rolling percentage, the intensity of (001) pole figure which is expected to increase the HIC susceptibility in pipeline steel is more pronounced.
Similar results on texture evolution of hot rolled BCC steels have been reported earlier in the literature. Reference Raabe24–Reference Eskandari, Mohtadi-Bonab and Szpunar28 Similar textures with random or weak cube texture were observed in highly alloyed ferritic stainless steel, and Si-steel. Moreover, weak recovered {001}〈110〉 (R-cube) texture component and strong shear texture (ζ-fiber) close to surface were characteristics of hot rolled steels.
Raabe and Lucke Reference Raabe24 studied the textures of cold rolled and annealed BCC Si and Cr steels. According to their results, θ-fiber (R-cube component) and γ-fiber were most important rolling textures due to plain strain deformation. The γ-fiber was also the recrystallization component especially near the {111}〈112〉.
In present work, the volume fraction of R-cube texture component is increased from 1.2 to 5.4 after cold rolling up to 20% and 90%, respectively. Therefore, θ-fiber with R-cube texture component is strengthened in present steel during cold rolling. In addition, according to Fig. 9(d), ODFs display γ-fiber with (111)[1–10] texture component is formed by increasing thickness reduction up to 90%. It is predicted that this type of texture is to be related to deformation. However, the recrystallization texture in pipeline steel may be formed with the later orientation after annealing. Reference Schwinn and Thieme5 It is expected that recrystallization alter texture components after annealing treatment. Since recovery is dominant in high SFE ferritic steels, the lack of stored deformation energy may suppress significant recrystallization. Under this condition rolling texture may be stable after annealing upon short time.
In present study, the annealed specimen at 850 °C for 90 s depicted roughly same feature as the texture of cold rolled specimen. Indeed, {001}〈110〉 rolling component is stable against annealing at 850 °C for short time. This is in agreement with our previous results on cold rolled and annealed X70 pipeline steel. Reference Schwinn and Thieme5
C. HIC cracks in as-received, cold-rolled, and annealed specimens
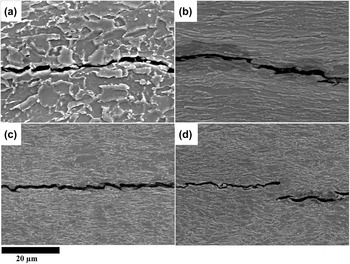
The above discussion supports the understanding that the applied cold-rolling and annealing treatments may not be considered as a suitable method to increase HIC resistance in pipeline steel. In addition, Figs. 10(a)–(d) show the HIC cracks on the cross section of (RD-ND plane) of AR, 20% CRA, 50% CRA, and 90% CRA specimens that appeared after 3 h hydrogen charging with a current density of 20 mA/cm2. These figures show that HIC cracks appeared at the center of cross sections and propagated parallel to the rolling direction. In the previous work, we showed that the as-received X60 steel is susceptible to HIC and the level of susceptibility is lower than that in the as-received X70 steel. Reference Mohtadi-Bonab, Szpunar and Razavi-Tousi20 SEM observations in electrochemically hydrogen-charged specimens showed that the HIC crack length increased from as-received X60 steel toward the 90% CRA X60 steel. We found several large cracks (more than 1 mm in length) on the cross section of 90% CRA steel. These observations confirm that the HIC resistance did not increase by cold rolling and subsequent heat treatment that we applied. It is notable that several small cracks also appeared at the cross section of rolled samples during the rolling process.
HIC cracks at cross sections (RD-ND plane) in (a) AR X60, (b) 20% CRA X60, (c) 50% CRA X60, and (d) 90% CRA X60 steel specimens that appeared after 3 h charging.

IV. CONCLUSIONS
We obtained the following results on correlation between HIC resistance and structure of the cold rolled and annealed API X60 pipeline steel:
-
(1) EBSD images showed that both elongated and equiaxed grains are observed in AR, 20 and 50% CRA specimens while most of grains are equiaxed in 90% CRA specimen. The fully recrystallized equiaxed grains show higher resistance to HIC than the elongated grains. However, full recrystallization was not achieved in cold rolled and heat treated specimens.
-
(2) In AR specimen, most of recrystallized grains were formed inside grains while in cold rolled specimens, most of recrystallized grains were formed along grain boundaries.
-
(3) It is concluded that the cold rolling and annealing treatments produced higher dislocation densities (in recovered and deformed regions), which caused increased hydrogen trap density and mitigated against any possible benefits of favorable texture, CSL boundaries and etc. It is possible that this could be overcome by annealing for longer times and/or higher temperatures.
-
(4) The strength of pole figures and ODFS was increased with the increase of cold-rolling percentage. Moreover, the {100} dominant texture was more pronounced in 50 and 90% CRA specimens.
-
(5) The hydrogen charging results confirm that the HIC resistance was not improved by applied cold rolling and heat treatment.
ACKNOWLEDGMENT
We would like to thank Natural Sciences and Engineering Research Council of Canada for the financial support of this project.