
I. INTRODUCTION
In the past decades, miscellaneous metals and alloys have been used to fabricate bone implants. Among them, it can be mentioned some classes of stainless steels, cobalt-based alloys, and the most widely used titanium and its alloys. Reference Dewidar, Khalil and Lim1–Reference Dourandish, Godlinski, Simchi and Firouzdor6 Titanium alloys have been considered due to their good combination of mechanical, corrosive, and biological properties. Reference Crosby7,Reference Long and Rack8 Nowadays, most metallic bone implants are still fabricated by traditional manufacturing techniques such as casting, forging, and machining. However, their high elastic modulus compared to that of natural bones usually produces a mismatch between the bone and the implant due to stress shielding, which is one of the three major causes of aseptic loosening. Reference Bahraminasab, Sahari, Edwards, Farahmand, Arumugam and Hong9,Reference Niinomi and Nakai10 Most of bone implantation failures are linked to bone cracking developed near the join with the implant. As the bone is a complex and dynamic tissue, in which structure and density are regulated by the applied load, it is desirable that the elastic modulus and yield stress of the implant are close to those of the natural bones to avoid bone resorption. Reference Moyen, Lahey, Weinberg and Harris11 The optimal elastic modulus and yield stress depend on the kind of bone to be replaced, e.g., cortical or trabecular. A wide set of mechanical properties of bones are listed by Wang et al. in their review. Reference Wang, Xu, Zhou, Xu, Leary, Choong and Xie12 According to them, the elastic modulus of bones ranges between 0.06 and 20 GPa and their yield stress ranges between 5 and 200 MPa. The properties of implants can be adjusted by introducing pores in the bulk material as it was proposed by Gibson and Ashby. Reference Gibson and Ashby13 Porous implants are especially promising with regard to a reduction of the stress shielding effect. In addition, the tuning of pore features may promote cell attachment, bone growth, and neovascularization, resulting in a better osseointegration. Reference Shen and Brinson14–Reference Takemoto, Fujibayashi, Neo, Suzuki, Kokubo and Nakamura16
Among the different techniques able to produce porous materials, the most commonly used for titanium alloys are conventional powder metallurgy, Reference Oh, Nomura, Masahashi and Hanada17 freeze casting, Reference Chino and Dunand18 diffusion bonding, Reference Li, Li, Huang, Kou and Zhou19 additive manufacturing (AM) also known as 3D printing, which includes electron beam melting, Reference Hrabe, Heinl, Flinn, Körner and Bordia20–Reference Liu, Li, Wang, Hou, Hao, Yang, Sercombe and Zhang23 selective laser melting, Reference Sallica-Leva, Caram, Jardini and Fogagnolo24 direct metal laser sintering, Reference Scott-Emuakpor, Holycross, George, Knapp and Beck25 and laser engineered net shaping. Reference Krishna, Bose and Bandyopadhyay26 AM is the most innovative technique to fabricate components with complicated geometries as scaffolds but equipment and fabrication costs are high. Another disadvantage of AM is the size of the smallest fabricated element size (dense strut or pore), which is routinely about 0.5 mm for melting processes. It is possible to fabricate materials with smaller pores (a few tens of micron size) by partial melting of the powder but it is difficult to control the size and the spatial distribution of these pores, which may result in discontinuous porosity, as reported by Furumoto et al. Reference Furumoto, Koizumi, Alkahari, Anayama, Hosokawa, Tanaka and Ueda27 On the other hand, combining powder metallurgy with the space holder method, which involves the use of pore formers mixed with the metal powder and eliminated before sintering at low or intermediate temperatures, Reference Reig, Amigó, Busquets and Calero28,Reference Torres, Rodríguez, Arias, Echeverry, Robledo, Amigo and Pavón29 can provide materials with controlled pores in a broad range of size at much lower cost. Generally, salts or other substances with low evaporation temperature are used. Some studies have studied the effect of the volume fraction of pores on the properties of the sintered Ti6Al4V alloy and they found elastic modulus values in the range 4–12 GPa and yield stress values in the range 69–167 MPa, Reference Torres, Rodríguez, Arias, Echeverry, Robledo, Amigo and Pavón29–Reference Aşık and Bor34 which is adequate for replacing a cortical bone. However, less attention has been paid to the effect of large pores on the sintering step and to their arrangement inside the material after the fabrication process as for example in ceramic materials. Reference Shang, Mohanram and Bordia35
The present work describes the processing of Ti6Al4V alloy scaffold-like materials by conventional powder metallurgy (pressing + sintering) involving space holders and it presents the microstructure and the mechanical properties of processed materials. Large artificial pores have been obtained by mixing the powder with ammonium bicarbonate salt particles. Materials with different relative densities were obtained by changing the amount of salt particles and the sintering temperature. Their microstructure was then observed by scanning electron microscopy (SEM), while large pore features such as size, shape, interconnectivity, etc., were assessed by X-ray computed microtomography (CMT). The mechanical behavior of the sintered materials was characterized by simple compression tests. A simple model adjusted to the experimental data is proposed to estimate the relative density after pressing and after sintering as a function of the salt volume fraction. This model is extended to the estimate of the elastic modulus and the yield stress.
II. EXPERIMENTAL
A. Sample preparation
An atomized prealloyed Ti6Al4V powder with spherical particles smaller than 20 µm, produced by Raymor, Boisbriand, Canada, was mixed with ammonium bicarbonate [(NH4) HCO3] particles with irregular shape and size distribution between 100 and 500 µm, furnished by Alfa Aesar, Monterrey, Mexico, for acting as space holders. The volume fraction of ammonium bicarbonate particles was set between 0 and 50%. Mixing was performed in a Turbula for 30 min in dry conditions. Then, 1 wt% of polyvinyl alcohol (PVA) was added as a binder. Next, the mixture was poured into an 8-mm-diameter stainless steel die and pressed at 500 MPa using an Instron 1195 tensile testing machine (Instron, Warrenville, Illinois) to obtain cylindrical compacts of 12 mm height. Next, the salt was removed at 180 °C for 6 h and after that, the PVA was thermally extracted by a slow heating at 5 °C/min up to 500 °C with a dwell time of 40 min in argon atmosphere. Afterward, each compact was sintered in a Linseis L75V vertical dilatometer (Linseis, Selb, Germany) in the range 1150–1260 °C with a dwell time of 1 h in argon atmosphere. The weight density of every sintered compact was calculated from mass and dimension measurements. The relative density is defined as the weight density of the compact divided by the weight density of the dense Ti6Al4V alloy at room temperature. Sintering kinetics was obtained from the data of time, axial displacement, and temperature during the whole thermal cycle.
B. Microstructure characterization
The sintered samples for SEM observation were cut and surface-polished with SiC abrasive papers and alumina powders (until 50 nm particle size), successively. The microstructure was observed with a Tescan MIRA 3 LMU field emission scanning electron microscope (FE-SEM; Tescan A.S., Brno, Czech Republic). Samples were directly observed without any conductive coating and the acceleration voltage used to acquire the FE-SEM images was set at 20 keV by using secondary electrons.
For more relevant analysis of the macroporosity by CMT, a Zeiss Xradia 510 Versa 3D X-ray microscope (Zeiss, Oberkochen, Germany) was used. The beam intensity was 120 kV, which was enough to pass through Ti6Al4V samples of 8 mm diameter. 1600 projections were recorded around 360° of the sample with a CCD camera of 1024 × 1024 pixels. The resulting voxel size was around 10 µm. The voxel size was restricted by the height of samples with the aim to observe the whole sample. This resolution allows us to perform an analysis of the large pores created with the ammonium bicarbonate particles.
C. 3D image analysis
The 3D image volumes (1100 × 1100 × 2300 pixels) were filtered, treated, and analyzed with the plug-ins included in the ImageJ software (National Institute of Health, Bethesda, Maryland). Both unsharp mask and median filters were used to enhance the contrast between the grains and the pores. Then, a thresholding procedure was applied to separate the solid and the porous phases based on the X-ray radiation absorption coefficient of materials. Reference Olmos, Takahashi, Bouvard, Martin, Salvo, Bellet and Di Michiel36 We use a manual thresholding constrained with the global relative density that was previously measured on the whole sample from mass and volume. In the obtained binary images, the solid phase was represented by a voxel intensity of 255 and the pore phase by a voxel intensity of 0. This was achieved straightforwardly thanks to the strong contrast between both phases. Then, to improve the quality of the binary images, successive morphological operations such as opening and closings with an octahedron as structural element were applied. The relative density was calculated by dividing the number of voxels contained in the solid phase by the total number of voxels of the image with a macro developed in the ImageJ software. The pore size distribution was evaluated using the 3D opening technique, Reference Serra37 based on the characterization of the porous volume accessible to an octahedron as a structural element with increasing size, previously used by other authors. Reference Olmos, Takahashi, Bouvard, Martin, Salvo, Bellet and Di Michiel36–Reference Olmos, Martin, Bouvard, Bellet and Di Michiel39 The porosity may be composed of several nonconnected pores that appear as individual objects in the 3D image. These objects were secondly labeled and it was obtained a new volume that identified every object in the image with a different gray value. Third, as the interconnected porosity was the largest pore inside the sample, the object with that gray level value was extracted from the image by thresholding. Finally, the total volume fraction of the remaining objects in the image was calculated and the value of interconnected porosity was obtained by the difference between this volume fraction and the total porosity. To assess the interconnectivity between large pores, a segmentation procedure was achieved by using the watershed method with Avizo software (FEI, Hillsboro, Oregon), as explained in Refs. Reference Babin, Della Valle, Chiron, Cloetens, Hoszowska, Pernot, Réguerre, Salvo and Dendievel38–Reference Vagnon, Rivière, Missiaen, Bellet, Di Michiel, Josserond and Bouvard40. This procedure identified large pores as individual items, called “pores” in the following, which allowed additional information, like pore position, interpore contact size, pore coordination number, and pore orientation to be calculated. The pore coordination number (Z) was estimated as follows: contact areas were obtained from intermediate images of the pore separation process. In those images, each object (pore or contact area) was tagged and labeled, so that the contacts associated to each pore (distance <1 voxel) were identified as well as the list of pores touching it. The mean coordination number was calculated for the whole volume. This method induces a slight overestimation of the coordination number due to the nonzero image resolution, Reference Marmottant, Salvo, Martin and Mortensen41 which can be corrected as a function of the resolution and the average pore size, as proposed by Vagnon et al. Reference Vagnon, Rivière, Missiaen, Bellet, Di Michiel, Josserond and Bouvard40 The minimum detectable contact radius x min for pores with radius R is then given by
 $${{{x_{\min }}} \over R} = \sqrt {{{2p} \over R}} \quad ,$$
where p is the voxel size resolution and the R is the average pore radius. For the samples treated in here, p ranges between 9.98 and 10.64 and the pore radius ranges between 99 and 106 µm. Thus, x min/R is about 0.44.
To investigate possible microstructural anisotropy, the pore orientation was calculated as the angle φ between the minor inertia axis of the pore and the horizontal plane. The values of φ go from 0°, for a pore with the major axis oriented in the horizontal direction, up to 90°, for a pore with the major axis oriented in the vertical axis of the sample. More than 1000 pores were evaluated to obtain a statistical representative value.
D. Compression tests
After sintering, the bottom and top surfaces of every sample were polished and simple compression tests were performed following ASTM D695-02 with an Instron 1150 universal mechanical testing machine at a strain rate of 0.5 mm/min. Reference Cheng, Li, Murr, Zhang, Hao, Yang, Medina and Wicker21 The elastic modulus (E) and the yield strength (σy) were estimated from the stress–strain curve that is obtained from the load–displacement data provided by the machine. To calculate the stress, the surface area of the sample was corrected by assuming that the volume was constant during compression. This assumption is likely false, above all for the less dense samples, but it is reasonable at low strain, in the domain where E and σy are estimated. The axial strain is calculated as the ratio of the real axial displacement (after machine stiffness correction) to the initial height of samples.
III. RESULTS
A. Dilatometry
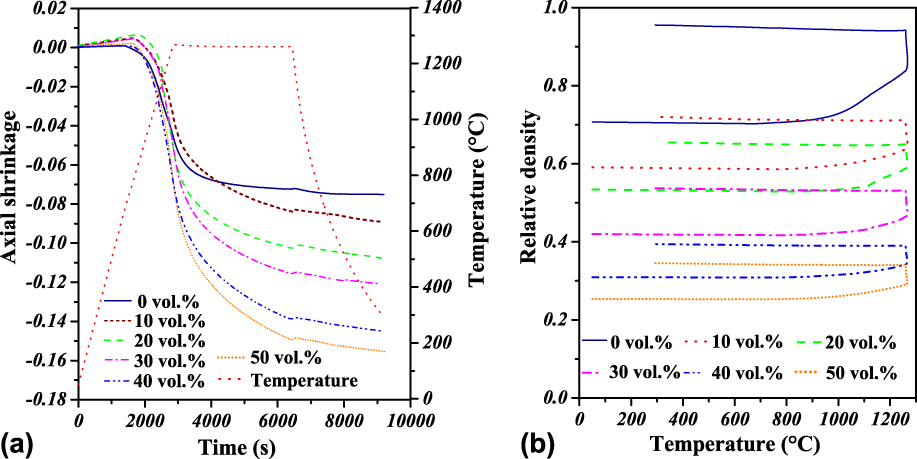
Figure 1(a) shows the axial shrinkage as a function of time during a whole sintering cycle with a maximal temperature of 1260 °C for samples containing different quantities of salt between 0 and 50 vol%. It is found that at any given time, the axial shrinkage increases with increasing volume fraction of salt. The final shrinkage of the sample with 50 vol% of salt is twice the one of the sample without salt particles. The same behavior was found for samples sintered at lower temperatures. An opposite effect could have been expected since the shrinkage results from interparticle contact sintering and the interparticle coordination number gets lower as the volume of large pores left by salt particles increases. Similar behavior was reported for a copper powder during in situ microtomography experiments, where the authors measured a lower particle indentation to reach the same macroscopical deformation in samples with large pores than that found in samples without large pores. Reference Olmos, Takahashi, Bouvard, Martin, Salvo, Bellet and Di Michiel36,Reference Olmos, Martin, Bouvard, Bellet and Di Michiel39 This phenomenon has been explained by the lowest constraint experienced by the particles located close to the large pores, which enhances the mobility of these particles.
Variation of the shrinkage (a) and relative density (b) during sintering at 1260 °C for samples with different volume fractions of salt particles. Shrinkage increases and densification decreases with increasing salt fraction.

To estimate the relative density during the whole thermal cycle, the radial displacement is assumed to follow the same variation as the measured axial one, with a corrective factor being the final axial to radial shrinkage ratio. This ratio depicts the anisotropy of sample deformation during sintering. A ratio of 0.8 for a sample without salt particles was found, which means that the radial shrinkage is higher than the axial one. When salt particles are added, this ratio gets higher than one and it increases from 1.3 to 2.7 with the amount of salt increasing from 10 to 50 vol%. It means that the radial shrinkage is reduced when the amount of salt is higher.
The relative density as a function of the temperature is depicted in Fig. 1(b). It can be seen that the initial relative density decreases with increasing volume fraction of salt, which was expected. During the thermal cycle, the relative density slowly decreases to around 850 °C due to thermal expansion. At that temperature, it starts strongly increasing, evidencing the beginning of sintering, until the sintering temperature is attained. An additional increment in relative density is observed during the temperature plateau. Finally, the densification gently continues during the cooling period as a result of thermal contraction. The increase in relative density during the sintering plateau is reduced when the amount of salt particles gets larger. Similar behavior was reported by Shang et al. in the fabrication of porous ceramics Reference Babin, Della Valle, Chiron, Cloetens, Hoszowska, Pernot, Réguerre, Salvo and Dendievel38 and it is commonly found during processing of composites from a mixture of sintering and inert particles. This behavior could also be associated to the lower coordination number between matrix particles, which is reduced by the presence of large pores, as reported by Olmos et al. Reference Olmos, Martin, Bouvard, Bellet and Di Michiel39
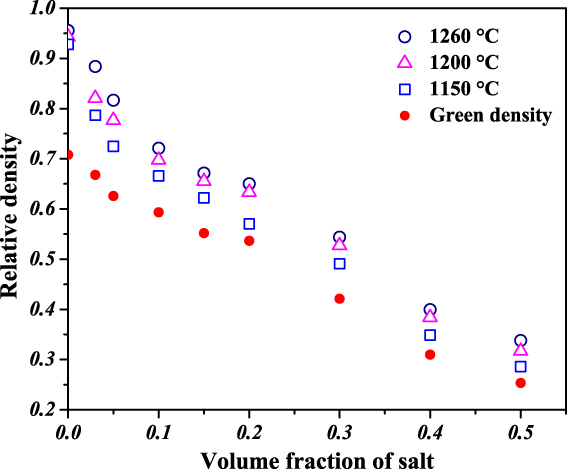
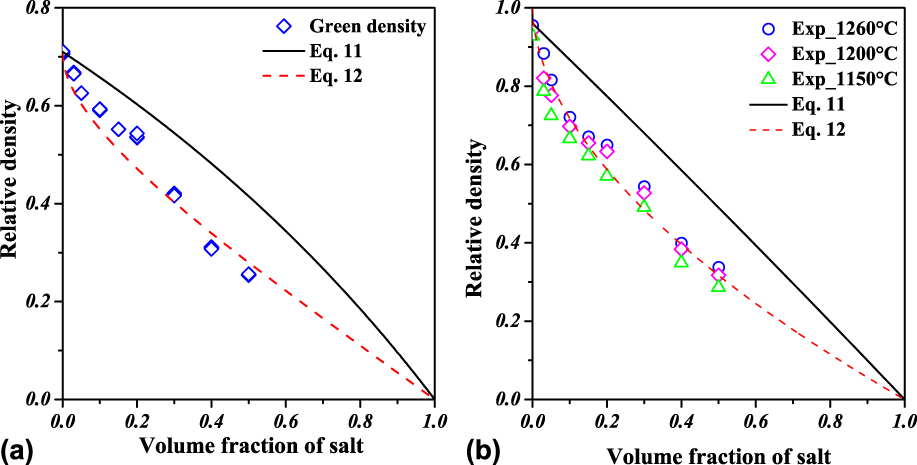
Figure 2 shows the relative density of all sintered samples (D f) as a function of the volume fraction of salt. It also includes the relative density of the green compacts (D 0). It can first be noticed that the green relative density decreases about linearly with increasing volume fraction of salt. D 0 goes from 0.26 for the samples with 50 vol% of salt to 0.7 for the samples without pore former. As expected, the final density also decreases with increasing fraction of salt and increases with increasing sintering temperature, although the effect of the temperature on the final density is relatively limited. The relative density of the sample containing 3 vol% of salt is 0.88, which is 9% lower than the one obtained without salt (0.96), whereas the lowest relative density (0.28) corresponds to the sample containing 50 vol% of salt and sintered at 1150 °C. This value is 70% lower than that obtained without salt with the same sintering conditions.
Initial (green) and final (sintered at different temperatures) relative density as a function of the volume fraction of salt for all fabricated materials. Density decreases with increasing salt fraction and it increases with increasing sintering temperature.

B. Microtomography characterization
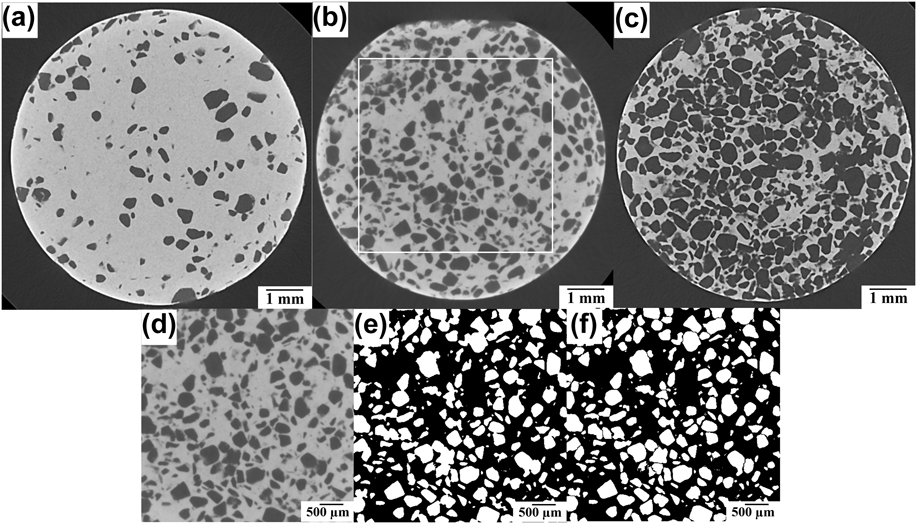
Figures 3(a)–3(c) show virtual slices of the samples containing 10, 30, and 50 vol% of salt particles. It can be observed that large pores depicted in dark gray are randomly distributed in every sample. The quantity of large pores increases with increasing fraction of salt. No crack was detected inside the samples in spite of the various steps involved in the process: compaction, elimination of salt and PVA, and sintering. However, it should be noted that the resolution of 3D images does not allow for the observation of features below 40 µm, which means 4 times the voxel size. To eliminate edge effects in the quantitative analysis of macroporosity, a rectangular parallelepiped volume of 4.5 × 4.5 × 7.5 mm (so called Region Of Interest) was cropped inside the cylinder as shown in Fig. 3(b) (red square). Next, the pores and the matrix in the ROI were separated by thresholding [see binary image in Fig. 3(e)] and finally large pores were segmented, as it was described in the experimental section, with the objective to obtain information about each individual pore [Fig. 3(f)]. From binary images, the volume fraction of pores was calculated (see Table I). All obtained values are about 10% higher than those calculated from specimen mass and dimensions. This is partly because interparticle pores cannot be detected with 3D image resolution and also due to uncertainty in image treatment operations.
2D virtual slices of the samples sintered at 1260 °C and containing (a) 10, (b) 30, and (c) 50 vol% of salt particles, and processing of ROI volume of 30 vol% sample (red square), (d) initial, (e) pore-matrix binary, and (f) pore segmented. Image resolution allows for an accurate disclosure of large pores.

Pore characteristics deduced from CMT images for samples sintered at 1260 °C.

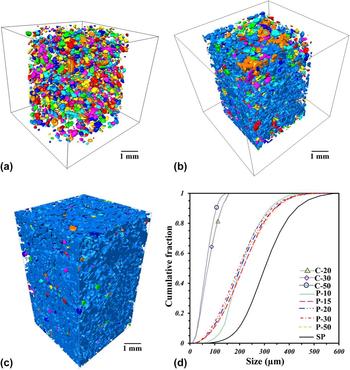
For illustrating the interconnectivity of large pores, a 3D rendering of the porosity in the analyzed volumes is presented in Figs. 4(a)–4(c). Pseudocolors indicate interconnected pores. The sample with 10 vol% of salt particles shows limited pore interconnectivity between large pores, as indicated by the different colors inside the image [Fig. 4(a)]. Also this figure proves that the large pores are homogeneously distributed in the material. The number of colored elements is much lower in the 20 vol% salt sample [Fig. 4(b)] and the 50 vol% salt sample contains almost one single element [Fig. 4(c)]. The pore connectivity is defined as the volume of the largest pore divided by the total pore volume. Table I shows that this parameter goes from 0.02 to 0.86 when the volume fraction of salt particles increases from 10 to 15%, and it is 0.99 for the 50 vol% salt sample.
3D volume rendering of pores for sintered samples with different volume fractions of salt, (a) 10%, (b) 20%, and (c) 50% (Pseudocolors indicate interconnected pores), (d) channel (C), pore (P), and initial salt particle (SP) size distributions of samples containing different volume fractions of salt particles (10–50). The material with lower fraction of salt shows isolated pores whereas the one with higher salt fraction show fully interconnected porosity.

Another important parameter is the pore size distribution, which has been calculated in 3D binary images of the cropped volumes with the previously described opening technique for the studied volume. The distribution is quite similar in all samples, confirming the random distribution of salt particles inside the samples. It is shifted by about 100 µm with regard to the size distribution of initial salt particles, which has been added as a reference [Fig. 4(d)]. This shift can be explained by the shrinkage of large pores during sintering but also by different particle size measurement methods since the reference distribution was obtained from 2D SEM images.
The interpore coordination number and the median value of pore channel size, defined as the interpore contact radius, were finally calculated (Table I). The coordination number was found to increase with increasing volume fraction of salt particles, from 2.4 to about 5 when the amount of salt increases from 15 to 50 vol%.
The pore channel size distribution for the samples with quasi-full pore connectivity is shown in Fig. 5(d). It is quite similar for all samples, ranging from 10 to 100 µm with a median size of about 70 µm.
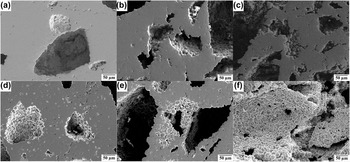
SEM micrographs of sintered samples: (a)–(c) at 1260 °C with 10, 30, and 50 wt% (NH4) HCO3, and (d)–(f) at 1150 °C with 10, 30, and 50 vol% salt, respectively. Large pores left by salt particles and small interparticle pores due to incomplete sintering are observed.

The pore orientation was estimated by quantifying the number of pores that have their larger axes oriented at 30° or lower with respect to the horizontal plane, which is perpendicular to the axis of the sample. It is found that around 70% of pores are oriented close to the horizontal plane, which is probably due to gravity and the pressing effects. This orientation might be related with the shrinkage anisotropy found during sintering and should be taken into account for other pore properties as, for example, permeability.
C. SEM observation
Figure 5 shows the pore morphology of three sintered samples observed by SEM. In every image, the pores created by the salt particles have an irregular shape and a size between 100 and 300 µm. The matrix of Ti6Al4V particles surrounding these pores is well sintered, although small interparticle pores are visible. It appears that the matrix is less dense when the volume fraction of salt is higher, which suggests that sintering is perturbed by the presence of large pores. This happens because the lower interparticle contact number of the particles located close by large pores, as evidenced by spherical shape surfaces appearing in the micrographs. As expected, the samples sintered at 1150 °C [Figs. 5(d)–5(f)] show more interparticle pores than the samples sintered at 1260 °C [Figs. 5(a)–5(c)]. It can be guessed that large pores are connected with each other in Figs. 5(c) and 5(f) while they are isolated in Figs. 5(a) and 5(d).
D. Mechanical behavior
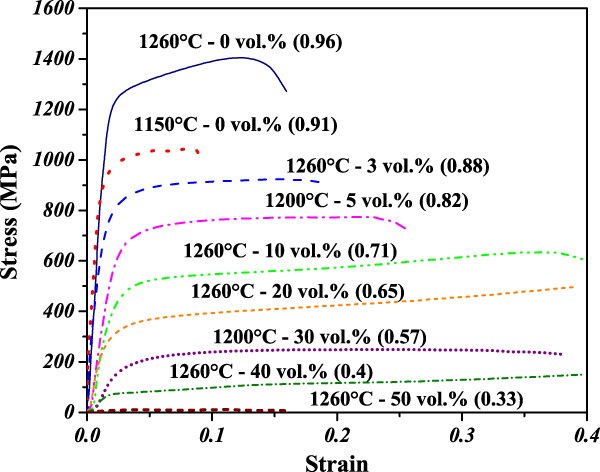
Figure 6 shows the stress–strain response of sintered samples with different relative densities under simple compression. The curve shows three stages. The first steep stress increase corresponds to linear elastic behavior. In the second stage, the stress gently grows up, evidencing plastic deformation. The final stage shows a stress drop indicating the failure of the samples. It is not apparent for less dense samples. The maximum stress increases with increasing relative density whereas the strain at failure decreases with increasing relative density, except for the densest sample. It is important to point out that residual porosity left by the sintering process strongly affects the strength of denser samples by reducing 30% the maximal compression stress obtained with an increase of only 5% of interparticle pores.
Stress–strain plot of sintered samples under simple compression. The relative density of each sample is given in brackets. Compressive strength is increasing with increasing density.

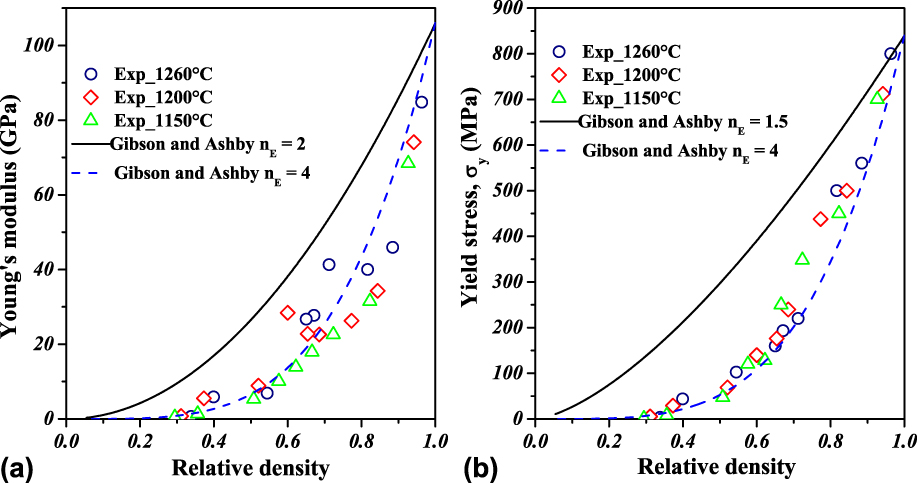
The Young’s modulus, E, was defined as the average slope of the initial linear section of the stress–strain curve. The yield stress, σy, was chosen to be the stress value at the end of this section. E and σy are plotted as functions of the relative density in Figs. 7(a) and 7(b), respectively. The values deduced from the stress–strain curves should be taken with caution because the curves are rather irregular. Also, as pointed out by Torres et al., Reference Torres, Lascano, Bris, Pavón and Rodriguez33 elastic modulus values obtained from simple compression tests are usually underestimated with respect to those measured by ultrasonic techniques. Nevertheless, the values in Fig. 7 likely give good orders of magnitude and they can be compared with each other to analyze the effect of material and process parameters on the mechanical behavior of porous samples.
Mechanical properties of sintered samples as functions of relative density. (a) Young’s modulus and (b) yield strength. Both parameters are strongly correlated with density. Gibson and Ashby model with an exponent of 4 finely describes these data.

Figure 7 shows that both E and σy increase with increasing relative density. A small effect of the sintering temperature can be noticed, as higher E and σy were found for samples sintered at higher temperatures at a given relative density. However, data dispersion and inaccuracy make this effect unclear.
Numerous models have been proposed to predict Young’s modulus of porous materials as a function of relative density D or porosity P = (1 − D). Reference Wang, Xu, Zhou, Xu, Leary, Choong and Xie12,Reference Phani and Niyogi42–Reference Nielsen44 For example, for metallic foams, Gibson and Ashby proposed Reference Gibson and Ashby13 a simple power law relating E and D:
 $$E = {E_0}{D^{{n_{\rm{E}}}}}\quad ,$$
where E is the Young’s modulus of the fully dense materials and n E is a constant depending on the structure of the foam. The value of nE most commonly used is 2.
Phani and Niyogi Reference Phani and Niyogi42 worked out a model for porous polycrystalline materials that takes into account the grain morphology and the pore geometry:
 $$E = {E_0}{\left( {1 - aP} \right)^n}\quad ,$$
where “a” lies between 1 and 3.85, and “n” depends on the pore morphology, being 2.14 for close spherical pores and 4.12 for interconnected irregular pores.
Kovacik proposed a close model based on the percolation theory Reference Kováčik43 :
 $$E = {E_0}{\left( {1 - {P \over {{P_{\rm{c}}}}}} \right)^f}\quad ,$$
where P c is the critical value of porosity for which the value of E is 0 and f depends on particle morphology and pore geometry. In the case of pores created by space holders, the used value is 4.35, close to that proposed by Phani and Niyogi.
Nielsen’s model introduces a pore shape factor (F f) Reference Nielsen44 :
 $$E = {E_0}\left[ {{{{{\left( {1 - p} \right)}^2}} \over {1 + \left( {{1 \over {{F_{\rm{f}}}}} - 1} \right)p}}} \right]\quad ,$$
where F f = 4pA/PE2, and A is the pore area and PE is the perimeter of the pore, both being measured in SEM images. This kind of measurement induces an important error since the perimeter and the area of pores clearly modify by the process of surface preparation to the SEM observation.
Since the constants appearing in the most complex models are difficult to obtain, Gibson and Ashby’s model has been chosen for the analysis of our data.
Concerning the yield stress, the same authors also proposed a power law equation that will be assessed for our materials:
 $${\sigma _{\rm{y}}} = {\sigma _{{\rm{y}}0}}{\left( D \right)^{{n_\sigma }}}\quad ,$$
where σy0 is the yield stress of the dense material and n σ is a constant that depends on pore features. The most commonly reported value of n σ is 1.5.
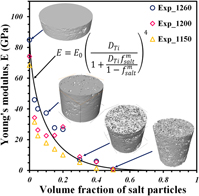
The variations of the E and σy as functions of relative density have been calculated with Eqs. (2) and (6) by using E 0 = 110 GPa, σy = 930 MPa, and the classical values of n E and n σ reported above. They are plotted in Fig. 8 (straight lines). The experimental values of E and σy are strongly overestimated. Thus optimal values of the exponents have been searched for. A good fit of both the Young’s modulus and the yield stress has been obtained with the same exponent, n E = n σ = 4 (dotted lines in Fig. 8). Note that this value is close by the ones proposed by Phani and by Niyogi and Kovacik in their models. Reference Phani and Niyogi42,Reference Kováčik43

IV. DISCUSSION
Porous Ti6Al4V materials were fabricated by successive pressing and sintering of fine powder mixed with much larger salt particles acting as pore formers. By varying the amount of salt particles between 0 and 50 vol% and the sintering temperature between 1150 and 1250 °C, samples with a relative density lying in a 0.25–0.96 range have been obtained. The effect of the sintering temperature in the selected range 1150–1260 °C has been found to be secondary.
A simple model has been developed to express the relative density as a function of the volume fraction of salt particles. The material is supposed to be composed of salt particles (after pressing) or pores left by these particles (after sintering) and a porous matrix with compacted or sintered Ti64 particles. The model is based on an assumption that salt particles are much larger than Ti64 particles and thus do not influence the densification of the matrix surrounding them. The volume fraction of salt particles is f s, and the value of relative density obtained without salt particles after pressing or sintering is D m.
Let us assume that Ti particles occupy a volume D m. The volume of matrix pores is then
 $${P_{\rm{m}}} = 1 - {D_{\rm{m}}}\quad .$$
If P s is the volume of salt particles or the pore volume left by salt particles, f s can be written as
 $${f_{\rm{s}}} = {{{P_{\rm{s}}}} \over {{D_{\rm{m}}} + {P_s}}}\quad .$$
It is deduced as
 $${P_{\rm{s}}} = {{{D_{\rm{m}}}{f_{\rm{s}}}} \over {1 - {f_{\rm{s}}}}}\quad .$$
Thus, the value of the relative density of porous samples after salt elimination can be calculated as
 $$D = {{{D_{\rm{m}}}} \over {{D_{\rm{m}}} + {P_{\rm{m}}} + {P_{\rm{s}}}}} = {{{D_{\rm{m}}}} \over {1 + {P_{\rm{s}}}}}\quad .$$
Introducing Eq. (9) in Eq. (10), it becomes
 $$D = {{{D_{\rm{m}}}} \over {1 + {{{D_{\rm{m}}}{f_{\rm{s}}}} \over {1 - {f_{\rm{s}}}}}}}\quad .$$
The values predicted by Eq. (11) with D m = 0.71 for pressing and D m = 0.97 for sintering clearly overestimate the experimental values in both cases (Fig. 8). This discrepancy may be attributed to an overestimation of the volume available for Ti64 particle packing. Various causes can explain a higher forbidden volume: irregular shape of salt particles, inaccessible volume at contacts between salt particles, and wall effect around salt particles. To globally take into account these phenomena, f s is simply replaced by f s m (m > 1) in Eq. (11), which leads to
 $$D = {{{D_{\rm{m}}}} \over {1 + {{{D_{\rm{m}}}f_{\rm{s}}^{\rm{m}}} \over {1 - f_{\rm{s}}^{\rm{m}}}}}}\quad .$$
The sintered samples have been characterized in terms of microstructure and mechanical properties. Concerning the microstructure, emphasis has been laid on the features of large pores left by salt particles, which were observed by CMT with a resolution of 10 µm. From the quantitative analysis of 3D images, it had been proved that these pores form a continuous network when the salt amount is 20 vol% or above. Pore connectivity is crucial for osseointegration as it allows more body fluids to be transported through the pores. This transport subsequently accelerates the healing process by allowing tissue to grow inside the implants and improves the biological fixation, as it was shown by Bandyopadhyay et al. Reference Bandyopadhyay, Espana, Balla, Bose, Ohgami and Davies45 It was also pointed out that pore connectivity improves the cell proliferation by providing a better path to transport nutrients and oxygen throughout the scaffolds. Reference Kalantari, Arabi, Mirdamadi and Mirsalehi32,Reference Li, Habibovic, van den Doel, Wilson, de Wijn, van Blitterswijk and de Groot46,Reference Takahashi and Tabata47
The large pores of sintered materials are between 100 and 400 µm large with a median size of 200 µm and they are connected with each other through 10–100 µm large channels with a median size of 70 µm. Although the effect of pore size in the bone ingrowth process is still controversial, it has been suggested in Ref. Reference Itälä, Ylänen, Ekholm, Karlsson and Aro48 that the optimal pore size range should be 100–400 µm, i.e., exactly the range reported above. Also the channel size is around 1/3 of the pore size obtained after sintering, which is inside the range recommended for the improvement of osseointegration. Reference Wang, Xu, Zhou, Xu, Leary, Choong and Xie12,Reference Piemme49 The permeability of the scaffold is another relevant parameter that strongly depends on porosity and pore channel size. Reference Takemoto, Fujibayashi, Neo, Suzuki, Kokubo and Nakamura16 The permeability of samples fabricated in the present study could be estimated from 3D images and compared with natural bone values provided, for example, by Grimm and Williams Reference Grimm and Williams50 and Nauman et al. Reference Nauman, Fong and Keaveny51 This work is in progress.
The Young’s modulus and the yield strength of every sample were deduced from simple compression tests. These parameters vary within a very wide range, 0–100 GPa and 0–700 MPa, respectively, and they essentially increase with increasing relative density. These experimental data have been fitted with classical Gibson and Ashby’s power laws with an exponent of 4.
For real bones, mechanical properties depend on different features as the age of bone, the anatomical site, and the bone quality. As already mentioned, according to Ref. Reference Wang, Xu, Zhou, Xu, Leary, Choong and Xie12, the Young’s modulus is in the range 0.06–20 GPa and the yield stress is in the range 5–200 MPa. Reference Wang, Xu, Zhou, Xu, Leary, Choong and Xie12 In addition to mechanical properties, flow properties are very important for bone implants, since permeability plays a major role on cytocompatibility and osseointegration. Permeability of a trabecular bone was experimentally measured by Grimm and Williams, who obtained a value of 4 × 10⁻¹⁰ m2. Reference Grimm and Williams50 Scaffolds of Ti6Al4V with 50–72% volume fraction of pores, produced by either space holder technique or AM, exhibited Young’s modulus between 1 and 7 GPa and compressive strength between 80 and 200 MPa. Reference Parthasarathy, Starly, Raman and Christensen22,Reference Torres, Rodríguez, Arias, Echeverry, Robledo, Amigo and Pavón29,Reference Wen, Yamada, Shimojima, Chino, Asahina and Mabuchi52–Reference Barui, Chatterjee, Mandal, Kumar and Basu54 For example, Torres et al. found a Young’s modulus of 3 GPa and a yield stress around 200 MPa for scaffolds with 50% pore volume fraction and pore sizes between 50 and 150 µm and they concluded that such characteristics are relevant for cell adhesion and stress-shielding. Reference Torres, Rodríguez, Arias, Echeverry, Robledo, Amigo and Pavón29 Besides, a few studies were focused on investigating the effect of pore characteristics on permeability but the authors did not measure the mechanical properties. Reference Singh, Lee, Lindley, Dashwood, Ferrie and Imwinkelried55–Reference Dias, Fernandes, Guedes and Hollister58 Singh et al. reported values of permeability between 1.17 and 1.63 × 10⁻¹⁰ m2 for Ti foams with 65% pore volume fraction and pore sizes between 50 and 800 µm. Reference Singh, Lee, Lindley, Dashwood, Ferrie and Imwinkelried55 Despois and Mortensen found that the permeability of Al foams with 80 vol% of pores increased from 4 × 10⁻¹⁰ to 7.6 × 10⁻¹⁰ m2 with increasing the pore size from 75 to 400 µm. Reference Despois and Mortensen57 Diaz et al. reported that permeability increased from 7 × 10⁻⁹ up to 30 × 10−9 m2 by increasing the pore size from 500 to 1000 µm for scaffolds with 50 vol% of pores. Reference Dias, Fernandes, Guedes and Hollister58 Nevertheless, the pore sizes suggested for facilitating cell adhesion and bone ingrowth are between 50 and 400 µm. Reference Camron, Pilliar and Macnab59,Reference Bobyn, Pilliar, Cameron and Weatherly60
The features of the porous materials processed in our study are fully consistent with the figures provided above. Furthermore, by combining the models proposed for relative density as a function of pore former amount and for the Young’s modulus and the yield stress as functions of relative density, it is possible to estimate the amount of pore formers required for obtaining a prescribed mechanical property with the Ti6Al4V powder of this study. For example, to get a Young’s modulus of 5 GPa, 31 vol% of salt are required and the yield stress is expected to be 38 MPa. The pore characteristics obtained for such a material with 200 µm average pore size suggest that permeability should be around 10−11 m2, which is adequate for osseointegration. For disconnecting E and σy, another process parameter should be introduced. That could be the sintering temperature lying in a wider range that the one used in this study.
Finally, it should be pointed out that the powder materials of this study exhibited an anisotropic behavior during sintering, which was stronger for higher salt amount, due to the deformation of salt particles during die pressing. It means that the processed materials were anisotropic, as confirmed by the preferential orientation of large pores in horizontal plane. It will be interesting in the future to investigate the anisotropy of permeability and mechanical properties of these materials.
V. CONCLUSIONS
Materials lying within a broad range of porosity were fabricated by sintering Ti6Al4V titanium alloy powder with salt particles acting as space holders. Sintering behavior and mechanical properties as well as pore features have been assessed and the following conclusions have been drawn.
As expected, relative density decreases with increasing volume fraction of salt particles and a simple analytical model has been proposed to predict the green and sintered densities, which takes into account the steric effect of introducing large and irregular particles inside the packing of small and spherical ones.
Large pores left by the salt particles were randomly distributed inside the samples without any agglomeration. 3D image analysis indicated that full interconnectivity of large pores is reached when the fraction of salt particles is above 20 vol%. Additionally, this analysis provided pore and channel size distributions, which are in the range of sizes suggested for bone implants.
Mechanical properties deduced from simple compression density cover wide ranges of values that are consistent with natural bone data. They increase with increasing density following the power laws proposed by Gibson and Ashby with an exponent fitted from experimental data.
By coupling the equation proposed to estimate the relative density and the Gibson and Ashby power law, it is possible to predict the mechanical properties as a function of fraction of salt particles by following the procedure used here, which will be very useful to produce materials with tailored properties.
ACKNOWLEDGMENTS
The authors would like to thank CIC of the UMSNH and ECOS M15P01 for the financial support and the facilities to develop this study. The Laboratory “Lumir” Geosciences of the UNAM, Juriquilla for the 3D image acquisition and processing is also acknowledged with thanks.