


The facts
The lasting benefits of the goods and services used for life cannot be measured in monetary terms like the costs and profits of producing these goods. While the latter’s notorious instabilities have so far prevented long-term forecasting in spite of perfect data, the former may be stable and predictable, but we have practically no data.
The mean (unisex) life expectancy occurred to the authors as a possible exception because it is a good and independent measure of the lasting benefits from the existential conditions supplied by goods and services. The upper part of Figure 1 shows the mean unisex life expectancy L at birth in the UK, USA, Germany, and Japan as listed in the national statistical yearbooks. Life insurers use linear fits for extrapolation. Since this can only mean a nearly linear section of a biologically acceptable function we fit, as the simplest choice, the logistic or S-function
Comparison of mean life expectancy L(t) and GDP per capita (right hand scale) with theory (plots). Circles apply to Germany, squares to Japan, points to UK, USA, and Korea. Recoveries converge with the GDP of the industrial evolution a(t)

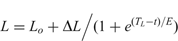
It is plotted with halftime in TL = 1981, amplitude ΔL = 88 years, and growth parameter E = 62 years. It starts with the reproduction minimum of Lo ≅ 30 years. Its extrapolated maximum  years for t→∞ specifies the genetic limit expected around 120 years for the leading nations. As indicated with the halftime rectangle, L has already passed its maximum annual gain
 years p.a. The S-function’s symmetry and small halftime growth rate of
 p.a. explain the life expectancy’s generally observed long linear growth phase.
The systematic deviation of 19th century Germany and Japan is mainly caused by these countries’ higher infant death rates due to their late entry into the industrial society. In medieval Europe, the vast majority lived near the existential minimum. Some earlier societies lived well above that level, but the long growth parameter shows that meaningful comparisons only make sense for populations having a similar existential background for at least three generations.
The second nearly coincident plot results from the next section’s assumption that life integrates over existential conditions. The best integrated measure of the latter’s level is the real (inflation corrected) gross domestic product (GDP) per capita, the annual value of goods and services as also listed in the national statistical yearbooks. The data were collected for the same nations 13 years ago.Reference Danielmeyer1 They are reproduced in the lower part of Figure 1 in 1000 US$ p.a. per capita in the value and exchange rates of 1991.Reference Deane and Cole2 It is seen how lost wars and financial disasters destroy analytic relations between L and national GDPs, but research was kept strong during the last century, providing a steady source of new knowledge.
The linear convergence of European nations was discovered but not explained in an EU project.Reference Crafts and Toniolo3 Linear growth means that growth rates decrease hyperbolically with time. We extended the data by including Japan and the USA, completed our theory of convergenceReference Danielmeyer1 in a European-Japanese projectReference Danielmeyer, Airaghi, Danielmeyer and Takeda4, and confirmed the collective envelope
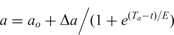
of the GDPs as the national goal of convergence. It represents the undisturbed industrial evolution above wars and financial disasters, established with the industrialization in the 18th century UK. When the ‘New Imperialism’ became more a burden than an asset, the UK’s growth levelled off and the USA became the leading world power. The first return to the industrial evolution was the recovery path of the USA from the second Wall Street Crash in 1928 and the following great depression. The next return was Europe’s and Japan’s recovery from the Second World War. Korea’s recovery from the Korean War is presently at halftime.
Equation (2) is plotted with 1.000 US$ p.a. per capita as the presently negligible pre-industrial level. The amplitude Δa = 75.000 US$ p.a. per capita, the halftime Ta = 2040 where the growth rate is 1/2E, and the growth parameter E = 62 years were reported in 1997.Reference Danielmeyer1 The long, nearly linear, growth phase within Ta ± E is even extended by preceding recoveries.
The line connecting both inflection points shows that L precedes a by ΔTLa = Ta − TL = 59 years. L(t) and a(t) have the same growth parameter and long term forecasting quality because all parameters are constants of our species or of the industrial society. They can be used as a base for extrapolation, national refinement, and possible reduction of the huge number of indicators used by forecasting institutions. Life insurers correct for direct and indirect deaths due to catastrophes and extrapolate for the life expectancies assuming that past trends of mortality and existential conditions continue. Then, equations (1) and (2) can be compared because equation (2) represents the undisturbed existential condition.
The bio-economic relation and its consequences
Figure 2 shows that L consists of three parts. The upper part between the S-functions is the genetic minimum Lo for reproduction. Following equations (1) and (2), the amplitude Δa can be normalized to the amplitude ΔL with the constant ratio N = ΔL/Δa = 1.17 years per 1.000 US$ in 1991 values. The most obvious assumption for this proportionality is that life integrates linearly and averages over the normalized existential condition. Relevant at birth is the integral taken over life’s possible range  . The result

is plotted in both figures together with its S-functional approximation
The life expectancy L, its existential minimum of 30 years (top difference), its base Na (bottom), and its individual addition during life with its associated shift (rectangles)


This bio-economic relation is very stable because all parameters are constants from the start of the industrial society to date. Assuming they remain constant, the following conclusions may be drawn:
• The maximum mean life expectancy
 is already observed with the shift because comparison of equations (1) and (4) yields .
• The reciprocal functions 1/(L − Lo) and 1/(a − ao) of equations (1) and (2) can be understood as an exponential decrease of human limitations with one and the same decay constant E to a lowest level. This cannot be zero because our species is not omnipotent. This excludes long-term linear as well as exponential growth with any positive rate. In fact, the growth rate decreases continuously because the decreasing gap to its maximum drives the S-function’s growth rate.
• The constancy of E over eight generations and two orders of magnitude for a(t) in four cultures can hardly be credited to human control. Its wide independence and length linking three generations suggest genetic stabilization of E. This is compatible with the hereditability of longevity.Reference Herskind, McGue, Holm, Sørensen, Harvald and Vaupel5 The increase of the life expectancy gained during the generation gap within individual life is then also heritable so that it can accumulate to the base Na in Figure 2. Otherwise, some invisible hand must force each consecutive generation from 1800 to 2200 to jump in life expectancy by 10 to 70 years in S-functional steps, and the great depression would have left a dent in the life expectancy.
• The existence of the bio-economic relation raises the question of causality because L(t) is quantitatively given by a(t), but the pace of a(t) is stabilized by E. The question is more general since the GDP is mainly guided by the technical knowledge required for production and L(t) by the general knowledge required for individual life. Both issues are resolved when both evolutions are guided by one coherent and collective set of knowledge.
• Since knowledge is partially competitive and therefore not additive, collective coherence requires continuous interaction for replacing obsolete with new relevant knowledge. The above decay constant is explained when this replacement proceeds with the reaction time E.
• Since leading nations have no society to copy from, new knowledge can only be obtained directly from nature with research. As long as a sufficiently large buffer is maintained, the length of E immunizes against changing support for research. This resolves the apparent contradiction between the considerable increase of G7 investment in R&D per capita after the Second World War and the S-functional long term decrease of their real per capita growth rates. So far, the industrial evolution was neither technically nor environmentally or resource limited.
• As long as E and
are the only limits to growth, the industrial evolution and the recoveries from war will remain per capita stable and predictable. Environmental and resource problems will be due more to wars and population growth than to the industrial evolution.
 is already observed with the shift
 because comparison of equations
 .
 are the only limits to growth, the industrial evolution and the recoveries from war will remain per capita stable and predictable. Environmental and resource problems will be due more to wars and population growth than to the industrial evolution.
Acknowledgements
We thank C. Gall of the University of Hohenheim and A. Neumann of Allianz AG Global Life for valuable information and discussions on, respectively, hereditability and life expectancy.
Hans G. Danielmeyer studied Physics in Stuttgart and Göttingen, and Economics at Rutgers University. From 1966 to 1971 he developed lasers at AT&T Bell Labs, continued at the Max Planck Institute for Solid State Research in Stuttgart, became a full professor of physics at the University of Hamburg in 1975, and in 1978 the founding president of the Technical University of Hamburg-Harburg. From 1987 to 1996 he was as member of the managing board of Siemens AG responsible for R&D, and he continued in R&D-related activities for national and international institutions. Since 2004 he has been guest professor in the Institute for Neuro- and Bioinformatics at the University of Lübeck.
Thomas Martinetz studied Physics and Mathematics in Munich and Cologne. From 1988 to 1991 he worked on self-organising networks in the Theoretical Biophysics Group at the Beckman Institute of the University of Illinois. In 1991 he joined Corporate Research of Siemens AG in Munich. In 1996 he became head of the Complex Systems Group at the Institute for Neuroinformatics of the University of Bochum, and CEO of the Zentrum für Neuroinformatik GmbH, a company for the commercial application of Neuroinformatics. Since 1999 he has been Director of the Institute for Neuro- and Bioinformatics at the University of Lübeck. Its main lines of research are biological information processing, analysis of biomedical data, and modelling learning processes in the brain.



