Introduction
Diabetes mellitus is a group of metabolic disorders characterized by elevated levels of glucose in the blood, caused by defects in insulin secretion, insulin action, or both (American Diabetes Association, ADA, 2013). Diabetes represents a significant global public health burden. Three hundred sixty-six million people have diabetes worldwide, a prevalence rate of 8.3%, which continues to increase rapidly (International Diabetes Federation, IDF, 2013). Type 2 diabetes, which represents the vast majority of diabetes mellitus cases globally, is now among the most prevalent of all noncommunicable diseases (ADA, 2013; IDF, 2013). Diabetes is associated with complications including retinopathy, nephropathy, peripheral vascular disease, heart disease, and stroke, and peripheral and autonomic neuropathies, as well as comorbidities including obesity, hypertension, and hypercholesterolemia (ADA, 2013). As a result, diabetes is characterized by excess disability and early mortality, which are also increasing at an alarming rate worldwide (Lozano et al., Reference Lozano, Naghavi, Foreman, Lim, Shibuya, Aboyans and Memish2012; Murray et al., Reference Murray, Vos, Lozano, Naghavi, Flaxman, Michaud and Memish2012).
While cognitive dysfunction is not yet identified as one of the hallmark complications of diabetes, the association of diabetes with cognition is well-recognized. The term “diabetic encephalopathy” was first used in 1950 to describe brain disease or dysfunction in the setting of diabetes (De Jong, Reference De Jong1950). Over the past 30 years, understanding of potential mechanisms and pathways has grown. There are several excellent reviews describing vascular, metabolic, and neuroendocrine contributors to cognitive decline and dementia (Banks, Owen, & Erickson, Reference Banks, Owen and Erickson2012; Kodl & Seaquist, Reference Kodl and Seaquist2008; Ryan, 2006; van den Berg, Kessels, Kappelle, de Haan, & Biessels, Reference van den Berg, Kessels, Kappelle, de Haan and Biessels2006; Whitmer, Reference Whitmer2007). With regard to characterizing neuropsychological functioning, there is evidence from longitudinal and cross-sectional studies that diabetes is associated with increased risk of cognitive decline, accelerated rate of cognitive decline in older adults, and increased risk of vascular and Alzheimer's dementia (ADA, 2013; Biessels, Staekenborg, Brunner, Brayne, & Scheltens, Reference Biessels, Staekenborg, Brunner, Brayne and Scheltens2006; Cukierman, Gerstein, & Williamson, Reference Cukierman, Gerstein and Williamson2005; McCrimmon, Ryan, & Frier, Reference McCrimmon, Ryan and Frier2012). Critical reviews and commentaries have identified limitations in quality and representativeness of the body of assessment research to date, as well as challenges pertaining to the breadth of neuropsychological evaluation, use of validated tests, and need for consistency in tests used to compare research populations (Jacobson, Reference Jacobson2011; Strachan, Deary, Ewing, & Frier, Reference Strachan, Deary, Ewing and Frier1997; Strachan, Frier, & Deary, Reference Strachan, Frier and Deary1997).
The National Institutes of Health (NIH) Diabetes Mellitus Interagency Coordinating Committee, in its 2010 strategic planning report, identifies cognition among the strategic priorities for diabetes research over the next decade (NIH, 2011). The report recommends inclusion of validated cognitive instruments in epidemiologic studies to further elucidate mechanisms of CNS complications in diabetes (NIH, 2011). This recommendation necessitates provision of evidence to assist with test selection and clarity with regard to effect sizes to power studies accurately to detect cognitive dysfunction in study populations. Importantly, while a typical comprehensive clinical neuropsychological assessment may include as many as 10–20 neuropsychological tests, in epidemiological and clinical research, as few as one to six tests may be used to meet limited time allotments (Gregg et al., Reference Gregg, Yaffe, Cauley, Rolka, Blackwell, Narayan and Cummings2000; Kanaya, Barrett-Connor, Gildengorin, & Yaffe, Reference Kanaya, Barrett-Connor, Gildengorin and Yaffe2004; Williamson et al., 2007). Therefore, knowledge of differential performance of individual neuropsychological tests in detecting dysfunction in individuals with diabetes is especially important.
In the clinical arena, there are also new demands for accurate quantification of cognitive dysfunction among persons with diabetes. Cognition has been added to some standards of care for diabetes, with practice recommendations to perform cognitive screening or ongoing cognitive assessment in the context of glycemic control or poor diabetes self-management (ADA, 2013). To meet this practice recommendation, the need for evidence supporting domains of import and selection of tests is highlighted.
The purpose of this study was twofold. From a systematic search of the literature on cognition and type 2 diabetes, the study aimed to: (1) determine effect sizes (Cohen's d) for cognitive dysfunction in adults with type 2 diabetes, relative to nondiabetic controls, in the domains of verbal memory, visual memory, attention/concentration, processing speed, executive function, and motor function; and (2) obtain effect sizes for the most commonly reported neuropsychological tests within domains. To our knowledge, this is the most comprehensive quantitative review with regard to breadth of cognitive domains examined in adults with type 2 diabetes and the first to present patterns of cognitive performance and magnitudes of dysfunction for different neuropsychological tests within those domains.
Methods
The meta-analysis was conducted and is reported in accordance with the Preferred Reporting Items for Systematic Reviews and Meta-Analyses (PRISMA) reporting guidelines (http://www.prisma-statement.org/) and the Strengthening the Reporting of Observational studies in Epidemiology (STROBE) criteria for quality assessment of included studies (http://www.strobe-statement.org/).
Search Strategy
PubMed (MEDLINE), EMBASE, and PsychINFO electronic databases were searched for articles published from January 1, 1980, through May 31, 2013. Controlled vocabulary (MeSH and emtree) and keywords were used in the search strategy. Primary search terms included “type 2 diabetes mellitus,” “diagnosed diabetes,” “diabetes;” “cognition,” “cognitive function,” “cognitive dysfunction,” “cognitive impairment,” and “cognitive decrement.” The full list of MeSH and emtree search terms are available in the online Supplemental Information. Reference lists of included studies and relevant review articles were reviewed to identify additional studies.
Study Selection
Two investigators (P.P., A.L.C.S.) independently reviewed titles, abstracts, and full text articles for inclusion. A third reviewer (F.H.-B.) adjudicated disagreements in abstract and full text inclusion/exclusion classification. See Flow Chart of Study Selection for Inclusion in online Supplemental Information. The database searches resulted in 36,409 studies. Initial screening yielded 3941 studies for abstract review, and 455 of these studies underwent full-text review. For this meta-analysis, a study was excluded after full-text review if the study focus was acute alterations in blood glucose (n = 35); no formal neuropsychological testing was performed (n = 33); no diabetic participants were included (n = 7); insufficient diabetes-stratified data were presented (n = 87); it presented no original data or was a review article (n = 24); data did not apply to the research question (n = 24); or study was not in English (n = 1). Articles with neuropsychological testing were excluded if they used an unknown or unrecognized cognitive instrument or an instrument that could not be classified within a cognitive domain examined in this meta-analysis (n = 41); did not include persons with type 2 diabetes or did not report diabetes type (n = 79); did not include a nondiabetic control group (n = 55); did not report numeric test score data (n = 32); or were duplicate reports of a study population already included in the meta-analysis (n = 13). Agreement between the reviewers’ decisions on inclusion/exclusion of full text articles was assessed using Cohen's Kappa statistic. The Kappa statistic for reviewer concordance regarding article selection was 0.96, indicating high inter-rater agreement.
Data Extraction and Management
Data were extracted using a standard form that underwent pilot testing before use. The following data fields were extracted: study characteristics (year, country), study design, sample characteristics for diabetic participants and nondiabetic controls (sample size, age, gender, race, education), and data from neuropsychological tests reported. The vast majority of studies reported raw neuropsychological test scores; therefore, raw test score means and standard deviations for the diabetes samples and for the nondiabetic control samples were extracted. Authors of studies that did not report raw test score means and standard deviations in the published manuscript were contacted to obtain those data. Of nine authors contacted, these additional data were received for four studies. Studies for which raw score means and standard deviations were not available were not included in the meta-analysis. After extraction of neuropsychological test scores, each cognitive test was categorized into the cognitive domains of verbal memory, visual memory, attention/concentration, processing speed, executive function, and motor function, based on widely used domain definitions developed by Spreen, Straus, and Lezak (Lezak, Howieson, & Loring, Reference Lezak, Howieson and Loring2004; Spreen & Strauss, Reference Spreen and Strauss1998).
Assessment of Methodological Quality
Using STROBE statement guidelines (von Elm et al., Reference von Elm, Altman, Egger, Pocock, Gotzsche and Vandenbroucke2007), the following items were used to assess the methodological quality of the studies included in the meta-analysis: clear description of participant eligibility; measurement of diabetes using a non–self-report measure; inclusion of diabetes mellitus as the primary exposure; and adequate control for age, sex, education, premorbid IQ and race confounding variables either by exclusion criteria or statistical adjustment.
Statistical Analyses
Cohen's d effect size (Cohen, Reference Cohen1988) was calculated to quantify differences in neuropsychological performance among persons with type 2 diabetes and nondiabetic controls in each study. This statistic was calculated by taking the difference in the mean change in raw cognitive test score between individuals with type 2 diabetes and the nondiabetic comparison group and dividing that by the pooled standard deviation. For most of the neuropsychological tests, a higher test score reflected better test performance. When a higher score indicates worse test performance, then the test score was represented as a negative number for effect size estimate calculations.
A random effects model, weighted by inverse variance, was performed to pool the standard deviation (Cohen's d) effect size estimates across studies for a given test. An overall composite meta-analysis was done for all tests within a domain to determine the magnitude of the performance difference in each domain between persons with type 2 diabetes and controls. A negative effect size estimate indicates poorer cognitive performance by individuals with type 2 diabetes relative to the nondiabetic comparison group. A positive effect size estimate indicates better cognitive performance by individuals with type 2 diabetes relative to the nondiabetic comparison group.
A test for heterogeneity (I-squared statistic) was performed to determine the presence of statistical heterogeneity or variation between the estimates of association for included studies (Higgins & Thompson, Reference Higgins and Thompson2002). This test provides an overall indication of how heterogeneous the study populations are and, if heterogeneous, provides justification for a random effects approach to the meta-analysis. This approach accounts for heterogeneity and ensures more valid estimates. All analyses were conducted using STATA 11.0 (STATA Corp, College Station, TX).
Results
Study and Sample Characteristics
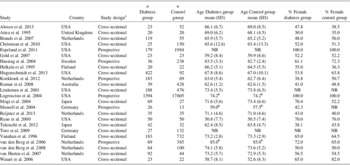
Twenty-four published studies met criteria for inclusion. The combined sample size across studies was 26,137 (n = 3351 patients with diabetes; n = 22,786 nondiabetic controls). Study and sample characteristics are presented in Table 1.
Characteristics of the studies and samples included in the meta-analyses

NR = Not reported.
aFor prospective studies, only baseline data were included in meta-analyses.
bStandard deviations were not reported.
Study samples were middle-aged to older adults, with mean sample ages ranging from 50 to 85 years. Half of the studies (n = 12) had a sample mean age greater than 65 years. The mean age was similar between individuals with diabetes and the nondiabetic controls. Eleven studies included more than 50% women. Studies were conducted in eight countries: United States (n = 9), Netherlands (n = 6), Finland (n = 2), Germany (n = 2), Japan (n = 2), Australia (n = 1), Sweden (n = 1), and the United Kingdom (n = 1). The majority (n = 18) of the studies were cross-sectional (Alosco et al., Reference Alosco, Brickman, Spitznagel, Griffith, Narkhede, Raz and Gunstad2013; Atiea, Moses, & Sinclair, Reference Atiea, Moses and Sinclair1995; Brands et al., Reference Brands, Van den Berg, Manschot, Biessels, Kappelle, De Haan and Kessels2007; Christman, Vannorsdall, Pearlson, Hill-Briggs, & Schretlen, Reference Christman, Vannorsdall, Pearlson, Hill-Briggs and Schretlen2010; Gold et al., Reference Gold, Dziobek, Sweat, Tirsi, Rogers, Bruehl and Convit2007; Helkala, Niskanen, Viinamaki, Partanen, & Uusitupa, Reference Helkala, Niskanen, Viinamaki, Partanen and Uusitupa1995; Hugenschmidt et al., Reference Hugenschmidt, Hsu, Hayasaka, Carr, Freedman, Nyenhuis and Bowden2013; Kumar, Anstey, Cherbuin, Wen, & Sachdev, Reference Kumar, Anstey, Cherbuin, Wen and Sachdev2008; Lindeman et al., Reference Lindeman, Romero, LaRue, Yau, Schade, Koehler and Garry2001; Mogi et al., Reference Mogi, Umegaki, Hattori, Maeda, Miura, Kuzuya and Iguchi2004; Reijmer et al., Reference Reijmer, Brundel, de Bresser, Kappelle, Leemans and Biessels2013; Ryan & Geckle, Reference Ryan and Geckle2000; Takeuchi et al., Reference Takeuchi, Matsushima, Kato, Konishi, Izumiyama, Murata and Hirata2012; Toro, Schonknecht, & Schroder, Reference Toro, Schonknecht and Schroder2009; van den Berg et al., Reference van den Berg, Dekker, Nijpels, Kessels, Kappelle, de Haan and Biessels2008; van Harten et al., Reference van Harten, Oosterman, Muslimovic, van Loon, Scheltens and Weinstein2007; Vanhanen et al., Reference Vanhanen, Karhu, Koivisto, Paakkonen, Partanen, Laakso and Riekkinen1996; Watari et al., Reference Watari, Letamendi, Elderkin-Thompson, Haroon, Miller, Darwin and Kumar2006). Six studies were prospective and examined the longitudinal association of type 2 diabetes with cognitive test performance (Espeland et al., Reference Espeland, Miller, Goveas, Hogan, Coker, Williamson and Resnick2011; Hassing et al., Reference Hassing, Grant, Hofer, Pedersen, Nilsson, Berg and Johansson2004; Koekkoek et al., Reference Koekkoek, Ruis, van den Donk, Biessels, Gorter, Kappelle and Rutten2012; Logroscino, Kang, & Grodstein, Reference Logroscino, Kang and Grodstein2004; Mussell, Hewer, Kulzer, Bergis, & Rist, Reference Mussell, Hewer, Kulzer, Bergis and Rist2004; van den Berg, de Craen, Biessels, Gussekloo, & Westendorp, Reference van den Berg, de Craen, Biessels, Gussekloo and Westendorp2006). For these prospective studies, only the baseline data were used to calculate effect sizes.
Quality Assessment of Studies
No study met all STROBE criteria for methodological quality; however, included studies met many criteria. See Quality Assessment of Included Studies in online Supplemental Information. The methods/sources of participant selection were clearly defined in all but one study (Lindeman et al., Reference Lindeman, Romero, LaRue, Yau, Schade, Koehler and Garry2001). Only three studies ascertained diabetes status by self-report (Brands et al., Reference Brands, Van den Berg, Manschot, Biessels, Kappelle, De Haan and Kessels2007; Espeland et al., Reference Espeland, Miller, Goveas, Hogan, Coker, Williamson and Resnick2011; Logroscino et al., Reference Logroscino, Kang and Grodstein2004); all others reported that diabetes was determined using methods including blood test (n = 16, Atiea et al., Reference Atiea, Moses and Sinclair1995; Gold et al., Reference Gold, Dziobek, Sweat, Tirsi, Rogers, Bruehl and Convit2007; Helkala et al., Reference Helkala, Niskanen, Viinamaki, Partanen and Uusitupa1995; Hugenschmidt et al., Reference Hugenschmidt, Hsu, Hayasaka, Carr, Freedman, Nyenhuis and Bowden2013; Koekkoek et al., Reference Koekkoek, Ruis, van den Donk, Biessels, Gorter, Kappelle and Rutten2012; Lindeman et al., Reference Lindeman, Romero, LaRue, Yau, Schade, Koehler and Garry2001; Mogi et al., Reference Mogi, Umegaki, Hattori, Maeda, Miura, Kuzuya and Iguchi2004; Mussell et al., Reference Mussell, Hewer, Kulzer, Bergis and Rist2004; Reijmer et al., Reference Reijmer, Brundel, de Bresser, Kappelle, Leemans and Biessels2013; Takeuchi et al., Reference Takeuchi, Matsushima, Kato, Konishi, Izumiyama, Murata and Hirata2012; Toro et al., Reference Toro, Schonknecht and Schroder2009; van den Berg, de Craen, et al., Reference van den Berg, Kessels, Kappelle, de Haan and Biessels2006; van den Berg et al., Reference van den Berg, Dekker, Nijpels, Kessels, Kappelle, de Haan and Biessels2008; van Harten et al., Reference van Harten, Oosterman, Muslimovic, van Loon, Scheltens and Weinstein2007; Vanhanen et al., Reference Vanhanen, Karhu, Koivisto, Paakkonen, Partanen, Laakso and Riekkinen1996; Watari et al., Reference Watari, Letamendi, Elderkin-Thompson, Haroon, Miller, Darwin and Kumar2006), medication use (n = 4, Kumar et al., Reference Kumar, Anstey, Cherbuin, Wen and Sachdev2008; Reijmer et al., Reference Reijmer, Brundel, de Bresser, Kappelle, Leemans and Biessels2013; van den Berg, de Craen, et al., Reference van den Berg, de Craen, Biessels, Gussekloo and Westendorp2006; van den Berg et al., Reference van den Berg, Dekker, Nijpels, Kessels, Kappelle, de Haan and Biessels2008), or medical record review (n = 7, Alosco et al., Reference Alosco, Brickman, Spitznagel, Griffith, Narkhede, Raz and Gunstad2013; Christman et al., Reference Christman, Vannorsdall, Pearlson, Hill-Briggs and Schretlen2010; Hassing et al., Reference Hassing, Grant, Hofer, Pedersen, Nilsson, Berg and Johansson2004; Kumar et al., Reference Kumar, Anstey, Cherbuin, Wen and Sachdev2008; Ryan & Geckle, Reference Ryan and Geckle2000; Toro et al., Reference Toro, Schonknecht and Schroder2009; van den Berg, de Craen, et al., Reference van den Berg, Kessels, Kappelle, de Haan and Biessels2006). In all but five studies (Gold et al., Reference Gold, Dziobek, Sweat, Tirsi, Rogers, Bruehl and Convit2007; Koekkoek et al., Reference Koekkoek, Ruis, van den Donk, Biessels, Gorter, Kappelle and Rutten2012; Lindeman et al., Reference Lindeman, Romero, LaRue, Yau, Schade, Koehler and Garry2001; Mussell et al., Reference Mussell, Hewer, Kulzer, Bergis and Rist2004; Watari et al., Reference Watari, Letamendi, Elderkin-Thompson, Haroon, Miller, Darwin and Kumar2006), diabetes mellitus was the primary exposure of interest.
The majority of studies controlled for one or more of the confounding variables of age, education, or gender. Statistical adjustment for these demographic variables was used most often (Alosco et al., Reference Alosco, Brickman, Spitznagel, Griffith, Narkhede, Raz and Gunstad2013; Brands et al., Reference Brands, Van den Berg, Manschot, Biessels, Kappelle, De Haan and Kessels2007; Christman et al., Reference Christman, Vannorsdall, Pearlson, Hill-Briggs and Schretlen2010; Espeland et al., Reference Espeland, Miller, Goveas, Hogan, Coker, Williamson and Resnick2011; Gold et al., Reference Gold, Dziobek, Sweat, Tirsi, Rogers, Bruehl and Convit2007; Hassing et al., Reference Hassing, Grant, Hofer, Pedersen, Nilsson, Berg and Johansson2004; Helkala et al., Reference Helkala, Niskanen, Viinamaki, Partanen and Uusitupa1995; Hugenschmidt et al., Reference Hugenschmidt, Hsu, Hayasaka, Carr, Freedman, Nyenhuis and Bowden2013; Koekkoek et al., Reference Koekkoek, Ruis, van den Donk, Biessels, Gorter, Kappelle and Rutten2012; Kumar et al., Reference Kumar, Anstey, Cherbuin, Wen and Sachdev2008; Lindeman et al., Reference Lindeman, Romero, LaRue, Yau, Schade, Koehler and Garry2001; Logroscino et al., Reference Logroscino, Kang and Grodstein2004; Reijmer et al., Reference Reijmer, Brundel, de Bresser, Kappelle, Leemans and Biessels2013; Ryan & Geckle, Reference Ryan and Geckle2000; Takeuchi et al., Reference Takeuchi, Matsushima, Kato, Konishi, Izumiyama, Murata and Hirata2012; van den Berg, de Craen, et al., Reference van den Berg, de Craen, Biessels, Gussekloo and Westendorp2006; van den Berg et al., Reference van den Berg, Dekker, Nijpels, Kessels, Kappelle, de Haan and Biessels2008; van Harten et al., Reference van Harten, Oosterman, Muslimovic, van Loon, Scheltens and Weinstein2007; Vanhanen et al., Reference Vanhanen, Kuusisto, Koivisto, Mykkanen, Helkala, Hanninen and Laakso1999; Watari et al., Reference Watari, Letamendi, Elderkin-Thompson, Haroon, Miller, Darwin and Kumar2006). Ten studies used controls matched on either age (van Harten et al., Reference van Harten, Oosterman, Muslimovic, van Loon, Scheltens and Weinstein2007), sex (Logroscino et al., Reference Logroscino, Kang and Grodstein2004), age and sex (Ryan & Geckle, Reference Ryan and Geckle2000; van den Berg et al., Reference van den Berg, Dekker, Nijpels, Kessels, Kappelle, de Haan and Biessels2008), age and education (Brands et al., Reference Brands, Van den Berg, Manschot, Biessels, Kappelle, De Haan and Kessels2007), or age, sex, and education (Gold et al., Reference Gold, Dziobek, Sweat, Tirsi, Rogers, Bruehl and Convit2007; Koekkoek et al., Reference Koekkoek, Ruis, van den Donk, Biessels, Gorter, Kappelle and Rutten2012; Mussell et al., Reference Mussell, Hewer, Kulzer, Bergis and Rist2004; Reijmer et al., Reference Reijmer, Brundel, de Bresser, Kappelle, Leemans and Biessels2013; Takeuchi et al., Reference Takeuchi, Matsushima, Kato, Konishi, Izumiyama, Murata and Hirata2012). In five studies, age was not accounted for using any method (Atiea et al., Reference Atiea, Moses and Sinclair1995; Helkala et al., Reference Helkala, Niskanen, Viinamaki, Partanen and Uusitupa1995; Kumar et al., Reference Kumar, Anstey, Cherbuin, Wen and Sachdev2008; Mogi et al., Reference Mogi, Umegaki, Hattori, Maeda, Miura, Kuzuya and Iguchi2004; Vanhanen et al., Reference Vanhanen, Kuusisto, Koivisto, Mykkanen, Helkala, Hanninen and Laakso1999); however, ages of the diabetes and age control samples were comparable.
Six studies reported inclusion of racial/ethnic minorities (African American: n = 5, Hispanic/Latino: n = 2). Four reported accounting for race through statistical adjustment (Christman et al., Reference Christman, Vannorsdall, Pearlson, Hill-Briggs and Schretlen2010; Espeland et al., Reference Espeland, Miller, Goveas, Hogan, Coker, Williamson and Resnick2011; Lindeman et al., Reference Lindeman, Romero, LaRue, Yau, Schade, Koehler and Garry2001; Ryan & Geckle, Reference Ryan and Geckle2000). A distribution of racial/ethnic groups was not clearly reported in four studies conducted in the United States and Australia (Alosco et al., Reference Alosco, Brickman, Spitznagel, Griffith, Narkhede, Raz and Gunstad2013; Gold et al., Reference Gold, Dziobek, Sweat, Tirsi, Rogers, Bruehl and Convit2007; Kumar et al., Reference Kumar, Anstey, Cherbuin, Wen and Sachdev2008; Logroscino et al., Reference Logroscino, Kang and Grodstein2004). Pre-morbid IQ was accounted for in eight studies (Atiea et al., Reference Atiea, Moses and Sinclair1995; Brands et al., Reference Brands, Van den Berg, Manschot, Biessels, Kappelle, De Haan and Kessels2007; Gold et al., Reference Gold, Dziobek, Sweat, Tirsi, Rogers, Bruehl and Convit2007; Koekkoek et al., Reference Koekkoek, Ruis, van den Donk, Biessels, Gorter, Kappelle and Rutten2012; Mussell et al., Reference Mussell, Hewer, Kulzer, Bergis and Rist2004; Reijmer et al., Reference Reijmer, Brundel, de Bresser, Kappelle, Leemans and Biessels2013; Ryan & Geckle, Reference Ryan and Geckle2000; van den Berg et al., Reference van den Berg, Dekker, Nijpels, Kessels, Kappelle, de Haan and Biessels2008).
Effect Sizes for Cognitive Domains and Their Respective Tests
Verbal memory
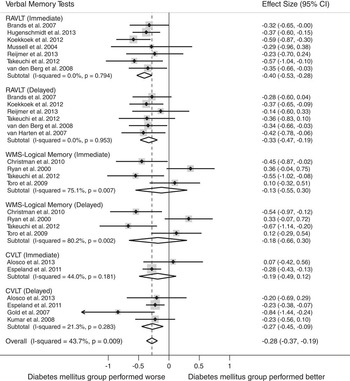
Verbal memory was assessed in 15 studies (n = 1349 persons with diabetes, and n = 3259 nondiabetic controls). At the level of the domain, individuals with diabetes performed worse than nondiabetic controls overall on tests of verbal memory, d = −0.28, 95% confidence interval (CI) [−0.37, −0.19]. The test for heterogeneity was significant, I2 = 43.7% (p = .009).
The most commonly reported tests of verbal memory were: Rey Auditory Verbal Learning Test (RAVLT) (n = 8), Wechsler Memory Scale (WMS)-Logical Memory (n = 4) and the California Verbal Learning Test (CVLT) (n = 4). Figure 1 displays the forest plots from the meta-analyses.
Forest plot depicting effect sizes for neuropsychological tests within the verbal memory domain. Shown are Cohen's d effect sizes (95% CI) for each study reporting the test and the pooled Cohen's d effect size (95% CI) for the neuropsychological test and domain. The dotted line represents the Cohen's d pooled effect size for the verbal memory domain. The overall effect size for the verbal memory domain is −0.28 (−0.37, −0.19). A negative Cohen's d effect size estimate reflects poorer cognitive performance among individuals with type 2 diabetes relative to the nondiabetic comparison group. CVLT = California Verbal Learning Test, RAVLT = Rey Auditory Verbal Learning Test, WMS = Wechsler Memory Scale.

Type 2 diabetes was associated with worse cognitive test performance on the following tests: RAVLT (immediate), d = −0.40, 95% CI [−0.53, −0.28]; RAVLT (delayed), d = −0.33, 95% CI [−0.47, −0.19]; and the CVLT (delayed), d = −0.27, 95% CI [−0.45, −0.09]. No association was found for type 2 diabetes and performance on CVLT (immediate) or on WMS-Logical Memory (immediate or delayed) subtests.
Because the WMS-Logical Memory immediate and delayed tests showed significant heterogeneity, we removed the tests and repeated the analysis. After re-analyzing the data without these tests, the test for heterogeneity became nonsignificant, I2 = 0.0% (p = .764), and the pooled effect size increased slightly, d = −0.31, 95% CI [−0.38, −0.25].
Visual memory
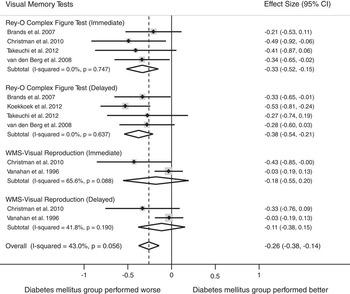
Visual memory was assessed in six studies (n = 616 persons with diabetes, n = 1138 nondiabetic controls). At the level of the domain, compared to individuals without diabetes, individuals with diabetes had worse overall performance on tests of the visual memory domain, d = −0.26, 95% CI [−0.38, −0.14]. The test for heterogeneity was not significant, I2 = 43.0% (p > .05).
The following tests were reported most frequently: Rey Osterrieth Complex Figure Test (n = 5) and WMS-Visual Reproduction (n = 2). Figure 2 displays the forest plots from the meta-analyses.
Forest plot depicting effect sizes for neuropsychological tests within the visual memory domain. Shown are Cohen's d effect sizes (95% CI) for each study reporting the test and the pooled Cohen's d effect size (95% CI) for the neuropsychological test and domain. The dotted line represents the Cohen's d pooled effect size for the visual memory domain. A positive Cohen's d effect size estimate reflects better cognitive performance among individuals with type 2 diabetes relative to the nondiabetic comparison group. The overall effect size for the visual memory domain is −0.26 (−0.38, −0.14). A negative Cohen's d effect size estimate reflects poorer cognitive performance among individuals with type 2 diabetes relative to the nondiabetic comparison group. Rey-O = Rey-Osterrieth Complex Figure Test, WMS = Wechsler Memory Scale.

Type 2 diabetes was associated with worse performance on the following visual memory tests: Rey Osterrieth Complex Figure Test (immediate), d = −0.33, 95% CI [−0.52, −0.15]; and the Rey Osterrieth Complex Figure Test (delayed), d = −0.38, 95% CI [−0.54,−0.21]. The test for heterogeneity was nonsignificant for these tests (p > .05). No significant association was found for WMS-Visual Reproduction (immediate or delayed) subtests.
Attention/concentration
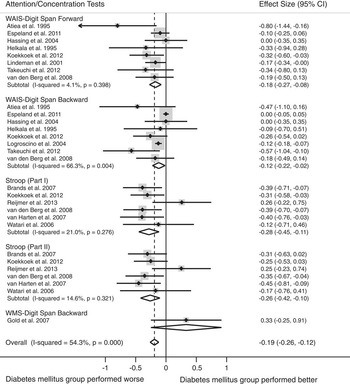
Fourteen studies included tests of attention/concentration (n = 2418 persons with diabetes, n = 20,725 nondiabetic controls). Compared to individuals without diabetes, individuals with diabetes showed worse overall performance on tests of attention/concentration, d = −0.19, 95% CI [−0.26, −0.12]. The test for heterogeneity was significant in the overall comparison, I2 = 54.3% (p < .001).
The most frequently used tests were the Wechsler Adult Intelligence Scale (WAIS)-Digit Span Forward (n = 8) and Backward (n = 8), Stroop Part I (n = 6), Stroop Part II (n = 6), and WMS-Digit Span Backward (n = 1). Figure 3 displays the forest plots from the meta-analyses.
Forest plot depicting effect sizes for neuropsychological tests within the attention/concentration domain. Shown are Cohen's d effect sizes (95% CI) for each study reporting the test and the pooled Cohen's d effect size (95% CI) for the neuropsychological test and domain. The dotted line represents the Cohen's d pooled effect size for the attention/concentration domain. The overall effect size for the attention/concentration domain is −0.19 (−0.26, −0.12). A negative Cohen's d effect size estimate reflects poorer cognitive performance among individuals with type 2 diabetes relative to the nondiabetic comparison group. WAIS = Wechsler Adult Intelligence Scale; WMS = Wechsler Memory Scale.

Type 2 diabetes was associated with significantly poorer performance on all tests of attention/concentration: WAIS-Digit Span Forward test, d = −0.18, 95% CI [−0.27, −0.08]; WAIS-Digit Span Backward test, d = −0.12, 95% CI [−0.22, −0.02]; Stroop Part I, d = −0.28, 95% CI [−0.45, −0.11]; Stroop Part II, d = −0.26, 95% CI [−0.42, −0.10]. The test for heterogeneity was nonsignificant for all tests (p > .05), except WAIS-Digit Span Backward (p < .05).
Only one study reported raw test scores for the WMS-Digit Span Backward Test (Gold et al., Reference Gold, Dziobek, Sweat, Tirsi, Rogers, Bruehl and Convit2007). In this study, individuals with diabetes performed better relative to those without diabetes, d = 0.33, 95% CI [−0.25, 0.91]; however, this was not statistically significant.
Because the WAIS-Digit Span Backward test showed significant heterogeneity, we removed the test and repeated the analysis. After re-analyzing the data without this test, the test for heterogeneity became nonsignificant, I2 = 20.7% (p = .193), and the pooled effect size estimate increased slightly, d = −0.22, 95% CI [−0.30, −0.14].
Processing speed
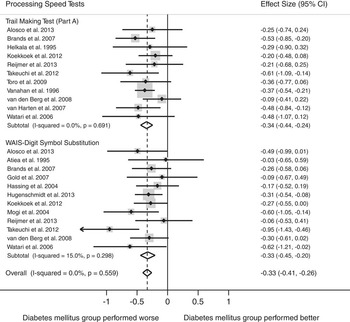
Sixteen studies included tests of processing speed (n = 1381 persons with diabetes, n = 1695 nondiabetic controls). Compared to individuals without diabetes, individuals with diabetes showed worse overall performance on tests of processing speed, d = −0.33, 95% CI [−0.41, −0.26]. The test for heterogeneity was not significant in the overall comparison (p < .05).
The most frequently reported tests were the WAIS-Digit Symbol Substitution Test (n = 12) and Trail Making Test (TMT) Part A (n = 11). Figure 4 displays the forest plots from the meta-analyses.
Forest plot depicting effect sizes for neuropsychological tests within the processing speed domain. Shown are Cohen's d effect sizes (95% CI) for each study reporting the test and the pooled Cohen's d effect size (95% CI) for the neuropsychological test and domain. The dotted line represents the Cohen's d pooled effect size for the processing speed domain. The overall effect size for the processing speed domain is −0.33 (−0.41, −0.26). A negative Cohen's d effect size estimate reflects poorer cognitive performance among individuals with type 2 diabetes relative to the nondiabetic comparison group. WAIS = Wechsler Adult Intelligence Scale.

Type 2 diabetes was associated with significantly poorer performance on both tests of processing speed: WAIS-Digit Symbol Substitution, d = −0.33, 95% CI [−0.45, −0.20 and TMT Part A, d = −0.34, 95% CI [−0.44, −0.24]. The test for heterogeneity was nonsignificant for all tests (p > .05).
Executive function
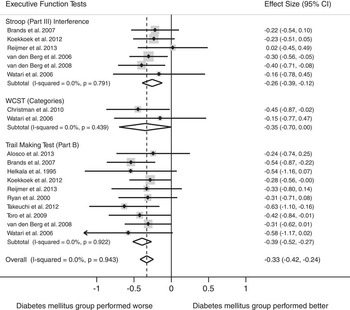
Twelve studies included tests of executive function (n = 680 persons with diabetes, n = 1104 nondiabetic controls). For the executive function domain, compared to individuals without diabetes, the performance decrement in individuals with diabetes was significant, d = −0.33, 95% CI [−0.42, −0.24]. The test for heterogeneity was nonsignificant in the overall comparison (p > .05).
The most commonly reported tests of executive function were TMT Part B (n = 10), Stroop Part III Interference (n = 6) and Wisconsin Card Sorting Test- Categories (n = 2). Figure 5 displays the forest plots from the meta-analyses.
Forest plot depicting effect sizes for neuropsychological tests within the executive function domain. Shown are Cohen's d effect sizes (95% CI) for each study reporting the test and the pooled Cohen's d effect size (95% CI) for the neuropsychological test and domain. The dotted line represents the Cohen's d pooled effect size for the executive function domain. The overall effect size for the executive function domain is −0.33 (−0.42, −0.24). A negative Cohen's d.

Type 2 diabetes was associated with worse performance on the TMT Part B, d = −0.39, 95% CI [−0.52, −0.27] and Stroop Part III Interference Test, d = −0.26, 95% CI [−0.39, −0.12]. A marginally significant association was found for type 2 diabetes and performance on the Wisconsin Card Sorting Test (WCST)-Categories tests, d = −0.35, 95% CI [−0.70, 0.00]. The tests for heterogeneity were nonsignificant for all tests (p > .05).
Motor function
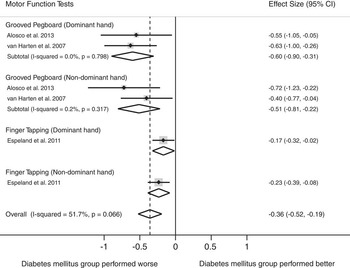
Motor function was the domain reported least frequently among studies meeting inclusion criteria (3 studies, n = 294 persons with diabetes, n = 2080 nondiabetic controls). At the level of the motor function domain, compared to individuals without diabetes, the performance decrement in individuals with diabetes was significant, d = −0.36, 95% CI [−0.52, −0.19]. The test for heterogeneity was nonsignificant in the overall comparison (p > .05). Figure 6 displays the forest plot from the meta-analyses.
Forest plot depicting effect sizes for neuropsychological tests within the motor function domain. Shown are Cohen's d effect sizes (95% CI) for each study reporting the test and the pooled Cohen's d effect size (95% CI) for the neuropsychological test and domain. The dotted line represents the Cohen's d pooled effect size for the motor function domain. The overall effect size for the motor function domain is −0.36 (−0.52, −0.19). A negative Cohen's d effect size estimate reflects poorer cognitive performance among individuals with type 2 diabetes relative to the nondiabetic comparison group.

Grooved Pegboard was reported in two studies. Analyses of the Grooved Pegboard test were stratified by the dominant and nondominant hand. Type 2 diabetes was associated with worse performance on Grooved Pegboard for both the dominant hand (d = −0.60, 95% CI [−0.90, −0.31]) and nondominant hand (d = −0.51, 95% CI [−0.81, −0.22]), respectively. One study reported raw test scores for the Finger Tapping Test. In that study, individuals with diabetes performed worse relative to those without diabetes for the dominant hand and nondominant hand, respectively, d = −0.17, 95% CI [−0.32, −0.02] and d = −0.23, 95% CI [−0.39, −0.08]. The tests for heterogeneity were nonsignificant for all tests (p > .05).
Neuropsychological test scores with largest effect sizes
Of the 23 most frequently reported test scores in the body of literature, just over half (n = 14) demonstrated differential performance between persons with type 2 diabetes and nondiabetic controls. The test scores that showed differential performance, in order of largest to smallest effect size, were: Grooved Pegboard dominant hand (motor function, d = −0.60), Grooved Pegboard nondominant hand (motor function, d = −0.51), RAVLT immediate recall (verbal memory, d = −0.40), TMT Part B (executive function, d = −0.39), Rey-O delayed recall (visual memory, d = −0.38), TMT Part A (processing speed, d = −0.34), WAIS Digit Symbol Substitution (processing speed, d = −0.33), RAVLT-delayed (verbal memory, d = −0.33), Stroop Part I (attention/concentration, d = −0.28), CVLT-delayed (verbal memory, d = −0.27), Stroop Part II (attention/concentration, d = −0.26), Stroop Part III (executive function, d = −0.26), WAIS Digit Span Forward (attention/concentration, d = −0.18), and WAIS Digit Span Backward (attention/concentration, d = −0.12). On each of these tests, persons with diabetes performed significantly worse than persons without diabetes. Neuropsychological tests that showed no differential performance included WMS Logical Memory, WMS Digit Span, and WMS- Visual Reproduction. On the WCST, categories achieved was marginally worse among persons with diabetes compared to persons without diabetes.
Discussion
This meta-analysis identified small to moderate performance decrements in persons with diabetes relative to nondiabetic controls in each domain examined. Motor function demonstrated the largest effect size, while attention/concentration exhibited the smallest effect size. Our largest Cohen's d effect size was −0.60 for the Grooved Pegboard test in the motor domain, which corresponds to a 61.8% overlap, meaning that approximately 20% of controls perform higher than any of the individuals with diabetes, and 20% of the individuals with diabetes perform worse than any of the controls (Zakzanis, Reference Zakzanis2001). These findings are similar to Larrabee and colleagues (Larrabee, Millis, & Meyers, Reference Larrabee, Millis and Meyers2008), who showed that the Grooved Pegboard test was more sensitive than any other test in the core Halstead-Reitan battery in a mixed neurologic sample; Trails B was the next most sensitive. Prior reviews have identified executive function, memory, and attention/concentration as domains that appear particularly susceptible to cognitive dysfunction in persons with diabetes (Kawamura, Umemura, & Hotta, Reference Kawamura, Umemura and Hotta2012; Kodl & Seaquist, Reference Kodl and Seaquist2008; Kumar, Looi, & Raphael, 2009; McCrimmon et al., Reference McCrimmon, Ryan and Frier2012; Reijmer, van den Berg, Ruis, Kappelle, & Biessels, Reference Reijmer, van den Berg, Ruis, Kappelle and Biessels2010). However, this meta-analysis found the domains rather comparable in magnitude of performance decrement, with motor function emerging as perhaps the most susceptible. Importantly, motor function was assessed least frequently (3 of 24 studies) in this body of literature. It is possible that the association of poor motor function with diabetes is due to peripheral neuropathy (Ryan et al., Reference Ryan, Williams, Orchard and Finegold1992). Only one study that reported data on a motor function test, however, accounted for peripheral neuropathy in the analyses (van Harten et al., Reference van Harten, Oosterman, Muslimovic, van Loon, Scheltens and Weinstein2007). Future studies should investigate motor function among person with diabetes with and without peripheral neuropathy. It is also possible that our motor function domain, and particularly the Grooved Pegboard test performance, reflects poorer psychomotor efficiency in the diabetic sample (Ryan & Geckle, Reference Ryan and Geckle2000). Overall, our meta-analysis findings have utility for current research needs (NIH, 2011); the small to moderate domain effect sizes inform sample size needs to power future cognition studies in diabetes.
Within the verbal memory, visual memory, and executive function domains, specific neuropsychological tests and scores emerged as potentially more sensitive to performance decrements in people with type 2 diabetes relative to nondiabetic controls. Examination of tests found to be more sensitive may help elucidate functional skills that may be affected in the setting of type 2 diabetes. For example, the test of verbal memory with the largest performance differential for persons with type 2 diabetes relative to controls was the RAVLT, whereas WMS-Logical Memory was not sensitive to cognitive dysfunction in diabetes samples. The RAVLT, an unstructured verbal memory list-learning task, requires greater cognitive demand for learning, encoding, and retrieval than a structured task. A structured memory test, such as WMS-Logical Memory, which provides semantic contexts, requires less cognitive demand. Our findings may suggest that persons with diabetes are aided in memory performance by structure and contextual cues. It is interesting that our data also show the RAVLT to be more sensitive than the CVLT (excluding the Gold et al., Reference Gold, Dziobek, Sweat, Tirsi, Rogers, Bruehl and Convit2007 outlier), which has been reported previously in a study discriminating left from right temporal lobe seizure focus (Loring et al., Reference Loring, Strauss, Hermann, Barr, Perrine, Trenerry and Bowden2008). For visual memory, the Rey-Osterreith Complex Figure test demonstrated differential performance between those with and without diabetes, whereas the WMS-Visual Reproduction test, which requires less cognitive demand, did not. The findings regarding differential effect sizes for neuropsychological tests also has utility for current clinical diabetes recommendations regarding assessment of cognitive function (ADA, 2013). All of the neuropsychological tests found in this study to detect cognitive dysfunction in type 2 diabetes samples are well-validated, standardized tests commonly used in neuropsychological clinical practice (Rabin, Barr, & Burton, Reference Rabin, Barr and Burton2005) and, therefore, may be effective in the clinical setting for diabetes-related cognitive assessment as well.
The study has important limitations, many of which are a consequence of characteristics of the body of literature to date. First, several studies identified in the systematic literature search could not be included in the meta-analysis for reasons including use of unknown or nonstandardized cognitive tests and noninclusion of test scores/results in the reporting. This greatly reduced the sample of studies in the meta-analysis, and the meta-analysis, therefore, represents a subsample of the literature. It is strongly recommended that future studies use available reliable and valid neuropsychological tests and that studies include the test score results for the diabetes and control samples in the published manuscript or supplementary material to aid in future meta-analyses. Second, the demographic characteristics of the samples in the studies place limits on generalizability of the findings. The samples were generally middle-aged to older adults, with a majority of studies reporting samples with a mean age >65 years. We were unable to perform analyses stratified by age (e.g., adults <65 years vs. ≥65 years), however, because the studies did not report cognitive test scores stratified by both diabetes status and age. The important question of differential effect sizes by age group warrants such sample stratification in future studies. The current findings regarding effect sizes should not be generalized to younger adult samples with type 2 diabetes nor to type 1 diabetes samples. In addition, although type 2 diabetes is a disease of health disparity (Golden et al., Reference Golden, Brown, Cauley, Chin, Gary-Webb, Kim and Anton2012), few samples included representative numbers of racial and ethnic minorities. Without these demographic groups, conclusions cannot be generalized to the larger population of persons with type 2 diabetes. There are known racial/ethnic performance differences in cognitive test performance (Lyketsos, Chen, & Anthony, Reference Lyketsos, Chen and Anthony1999; Manly et al., Reference Manly, Jacobs, Sano, Bell, Merchant, Small and Stern1998), but this has not been widely explored in the setting of diabetes and cognitive function. Gender also impacts cognitive performance (Gur et al., Reference Gur, Turetsky, Matsui, Yan, Bilker, Hughett and Gur1999) and therefore warrants attention in future cognition and diabetes research. Third, in this meta-analysis, we examined scores of persons with type 2 diabetes relative to nondiabetic controls, yielding conclusions regarding relative performance decrements but not clinical significance of the scores. The neuropsychological tests used most frequently in the literature are all standardized tests with available normative data; inclusion of such scores in future studies would provide an opportunity to understand performance differences in the context of levels of impairment or nonimpairment. Finally, the meta-analysis carries the conceptual limitation that neuropsychological tests were classified into a single cognitive domain, while neuropsychological tests often measure multiple functional aspects of cognition and multiple domains. However, we provide summary effect size estimates not only for each cognitive domain, but also for each test, which enables readers to look at the performance of each test individually.
Despite noted limitations, this meta-analysis has several strengths. First, to our knowledge this is the first study to quantify cognitive dysfunction in adults with type 2 diabetes across a comprehensive set of cognitive domains and to determine effect sizes for neuropsychological tests within domains. Second, a rigorous methodology was applied to the systematic literature search and study selection, and STROBE criteria for assessing study quality were used and reported. Third, the meta-analysis includes an international body of research, which aids in generalizability across represented countries. The use of the Cohen's d statistical measure of effect size allowed us to pool data from all available studies resulting in increased power for statistical analyses.
In conclusion, this meta-analysis provides effect sizes to quantify performance decrements in middle-aged and older adults with type 2 diabetes that can be used to inform power considerations for future research and to aid in test selection. Attention to prior limitations in the literature and resulting recommendations will facilitate attainment of scientific and clinical priorities in diabetes and cognition research in the next decade.
Acknowledgments
This work was supported by the National Institute of Diabetes and Digestive and Kidney Diseases (NIDDK) Diabetes Research and Training Center grant (F.H-B., grant number P60 DK079637) and NIDDK T32 training grant (P.P and A.L.C.S., grant number T32 DK062707). Drs. Palta and Schneider contributed equally to this work. The authors declare no conflicts of interest. Portions of this research were presented at the American Diabetes Association 72nd Scientific Sessions, Philadelphia, PA, June 2012.