Introduction
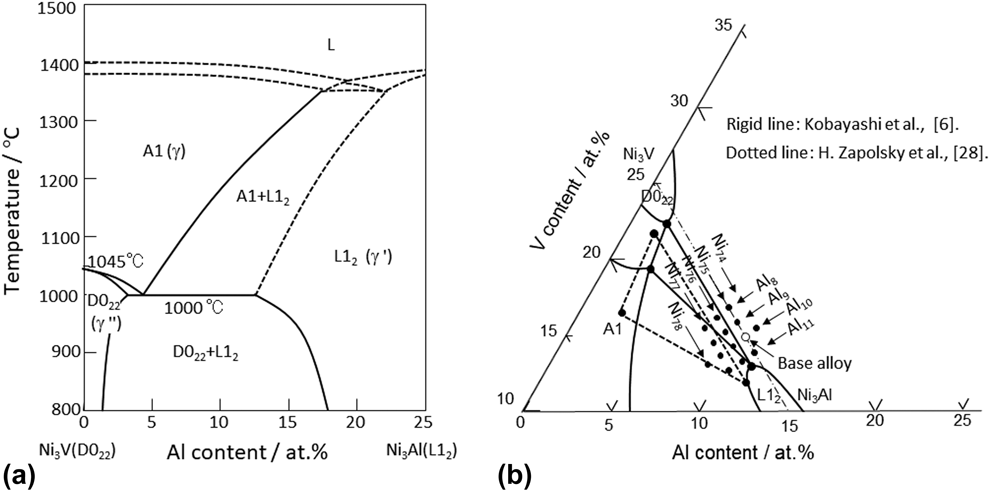
So-called Ni base dual two-phase intermetallic alloys, which follow a microstructural feature of Ni base γ–γ′ type superalloys [Reference Harada, Yamazaki and Koizumi1, Reference Reed2], have been developed by the present authors’ group, based on Ni3Al (L12) and Ni3V (D022) pseudo-binary alloy system [Reference Nunomura, Kaneno, Tsuda and Takasugi3, Reference Shibuya, Kaneno, Yoshida and Takasugi4, Reference Shibuya, Kaneno, Tsuda and Takasugi5]. The D022 structure is crystallographically derived from the L12 structure: the lattice parameter a of the D022 structure is close to that of the L12 structure, but the lattice parameter c of the D022 structure is roughly doubled, accompanied with a slight extension. The longitudinal Ni3Al and Ni3V pseudo-binary phase diagram and Ni-rich corner of the isothermal (950 °C) section of Ni–Al–V ternary alloy system are shown in Figs. 1(a) and 1(b), respectively [Reference Kobayashi, Sato, Hayashi, Osaka, Konno, Kaneno and Takasugi6]. In the alloys with hyper-eutectoid compositions in Fig. 1(a), the microstructures at high temperatures are comprising primary Ni3Al phase (γ′) precipitates and Ni solid solution (A1 phase: fcc) matrix present in a channel form. At low temperatures, the Ni solid solution is transformed into a eutectoid microstructure consisting of the Ni3Al and Ni3V phases [Reference Nunomura, Kaneno, Tsuda and Takasugi3, Reference Shibuya, Kaneno, Yoshida and Takasugi4, Reference Shibuya, Kaneno, Tsuda and Takasugi5, Reference Moronaga, Kaneno, Semboshi and Takasugi7]. The microstructures are supposed to be thermally stable even at high temperatures because the two constituent phases are crystallographically quite coherent. Under loading, the primary Ni3Al phase is plastically more deformable than the channel region involving the Ni3V phase [Reference Moronaga, Kaneno, Tsuda and Takasugi8, Reference Varin and Winnicka9, Reference Francois, Hug and Veyssière10, Reference Hagihara, Mori, Kishimoto and Umakoshi11, Reference Singh, Sundararaman and Mukhopadhyay12] in contrast to the Ni base γ–γ′ type superalloys. It has been so far observed that hardness and tensile strength of the Ni base dual two-phase intermetallic alloys are promising for applying to high-temperature structural materials [Reference Takasugi and Kaneno13].
(a) Longitudinal Ni3Al and Ni3V pseudo-binary phase diagram [Reference Kobayashi, Sato, Hayashi, Osaka, Konno, Kaneno and Takasugi6] and (b) Ni-rich corner of isothermal sections of Ni–Al–V ternary alloy system reported at 950 °C [6] and 800 °C [28]. Also, the alloy compositions prepared in this study were plotted in (b).

Alloying is a generally useful procedure to further improve mechanical properties of materials. In the Ni base dual two-phase intermetallic alloys, transition metals including Ti, Nb, and Ta (groups IV and V in a periodic table) [Reference Kawahara, Moronaga, Kaneno, Kakitsuji and Takasugi14, Reference Shibuya, Kaneno, Yoshida, Shishido and Takasugi15, Reference Soga, Kaneno and Takasugi16, Reference Kawahara, Kaneno and Takasugi17, Reference Moronaga, Ishii, Kaneno, Tsuda and Takasugi18, Reference Ioroi, Kaneno, Semboshi and Takasugi19]; W and Mo (group VI); and Re (group VII) [Reference Moronaga, Kaneno, Semboshi and Takasugi7, Reference Moronaga, Ishii, Kaneno, Tsuda and Takasugi18, Reference Edatsugi, Kaneno, Semboshi and Takasugi20, Reference Uekami, Semboshi, Kaneno and Takasugi21] have been shown to be effective solid solution strengtheners. Also, the strengthening of those alloys was generally more significant in the substitution manner of the additive elements for Al than for Ni and V, via refining the dual two-phase microstructure [Reference Ioroi, Kaneno, Semboshi and Takasugi19, Reference Edatsugi, Kaneno, Semboshi and Takasugi20]. There is another alloying parameter especially applicable to intermetallic alloys with a compositional range. It has been well known that stoichiometry significantly affects physical, chemical, and mechanical properties through modifying the crystal structure (involving anti-atom, vacancy and reduced ordering) or compositional range [Reference Noguchi, Oya and Suzuki22].
According to the Ni-rich corner of the isothermal Ni–Al–V phase diagram shown in Fig. 1(b), the two constituent phases, Ni3Al and Ni3V in the two-phase Ni3Al–Ni3V pseudo-binary alloys, have compositional ranges in the Ni-rich sides at temperatures below the eutectoid temperature. Consequently, both the Ni3Al and Ni3V phases equilibrated in the off-stoichiometric Ni3Al–Ni3V pseudo-binary alloys are composed of Ni-rich composition. In monolithic Ni3Al alloys, it has been shown that as Ni content deviates toward to Ni-rich side, not only strength (or hardness) increases but also ambient tensile ductility increases through suppressing intergranular fracture with the help of boron segregation at grain boundaries [Reference Aoki23, Reference Liu, White and Horton24]. Similar feature has been investigated on other L12-type M3B alloys, where M is a transition metal in VIII group and B is a transition metal including semi-metal [Reference Takasugi, Masahashi and Izumi25]. Also, it is shown that further deviation toward to more Ni-rich side leads to three-phase microstructures comprising L12, D022, and A1 phases, by which further enhancement of tensile ductility might be expected. In this study, the microstructures and high-temperature tensile properties of the off-stoichiometric Ni3Al–Ni3V pseudo-binary alloys are investigated as a function of the deviation from the just-stoichiometric composition. Based on the experimental results, the two-phase Ni3Al–Ni3V pseudo-binary alloys with a preferable balance of strength and tensile ductility, which are crucial for high-temperature structural materials, are explored and discussed.
Alloy compositions
In this study, the Ni75Al10V15 (in at.%) alloy was employed as a base alloy composition. The Ni75Al10V15 alloy has been so far used to examine the effect of substitution manner of additive elements for the constituent Ni, Al, or V on the microstructures and mechanical properties [Reference Ioroi, Kaneno, Semboshi and Takasugi19, Reference Edatsugi, Kaneno, Semboshi and Takasugi20, Reference Uekami, Semboshi, Kaneno and Takasugi21]. Chemical compositions of the alloy system conducted on this study are expressed by an equation;
 $${\rm{N}}{{\rm{i}}_{75 + x}}{\left( {{\rm{A}}{{\rm{l}}_{10 + y}}{{\rm{V}}_{15 - y}}} \right)_{25 - x}}\;\left( {{\rm{in}}\;{\rm{at}}.\% } \right)\quad ,$$
where x is the alloying parameter for stoichiometry and takes values of −1, 0, 1, 2, and 3, and y is the alloying parameter for atomic concentrations of Al and V and takes values of −2, −1, 0, and 1. Through the former parameter, off-stoichiometric alloys containing 74, 75, 76, 77, and 78 at.% Ni contents were prepared. For each off-stoichiometric composition, alloys with different atomic ratios having Al/V = 8/17, 9/16, 10/15, and 11/14 were prepared through the latter parameter. As the Al/V ratio increases, the volume fraction of the Ni3Al phase is presumed to increase. The prepared alloys are plotted in the isothermal section in the Ni–Al–V ternary alloy system [Fig. 1(b)] and hereafter designated as, for examples, Ni75Al10 and Ni77Al9 alloys, whose full chemical compositions are expressed as Ni75Al10V15 and Ni77Al8.28V14.72, respectively.
Results
Microstructures
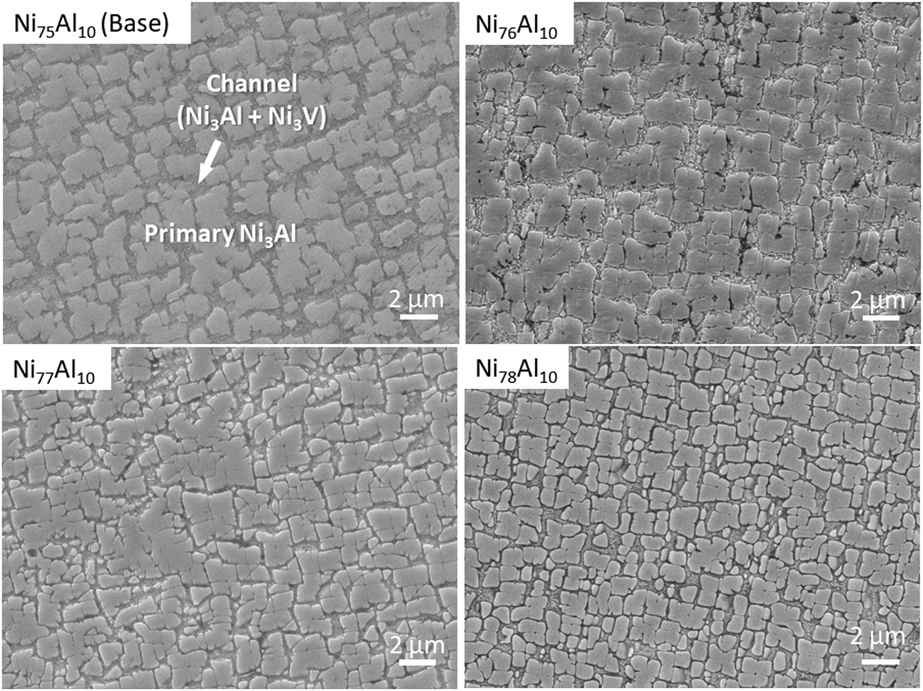
The arc-melted buttons were composed of columnar grains having a diameter of several hundred μm. Figure 2 exhibits the field emission–type scanning electron microscopic (FESEM)-secondary electron images (SEIs) of the microstructures in the grain interiors of the Ni75+x(Al10V15)25−x alloys. The FESEM images were mostly taken from a grain whose sectioning plane was roughly normal to the cube planes of the primary precipitates. In either alloy, the microstructure exhibits primary Ni3Al precipitates and channel region which is presumed to be a eutectoid microstructure consisting of minor Ni3Al and major Ni3V phases. The Ni3Al precipitates tend to be aligned in a direction normal to the cube plane of the precipitates with somewhat cuboidal (square-like) morphology similar to conventional γ–γ′ type superalloys. The previous study [Reference Ioroi, Kaneno, Semboshi and Takasugi19] showed that the morphology and alignment of the primary Ni3Al precipitates were affected by the elastic strain energy due to the lattice mismatch between the precipitate and matrix (i.e., prior A1 phase) and the elastic interaction energy between precipitates [Reference Johnson and Lee26, Reference Miyazaki, Imamura, Mori and Kozakai27]. The FESEM images also indicate that the volume fraction and the morphology of the primary Ni3Al precipitates are not so much dependent on the Ni content in alloy. Also, there were no obvious third intermetallic or inclusion phases in either alloy.
FESEM-SEIs of the microstructures of the Ni75+x(Al10V15)25−x alloys.

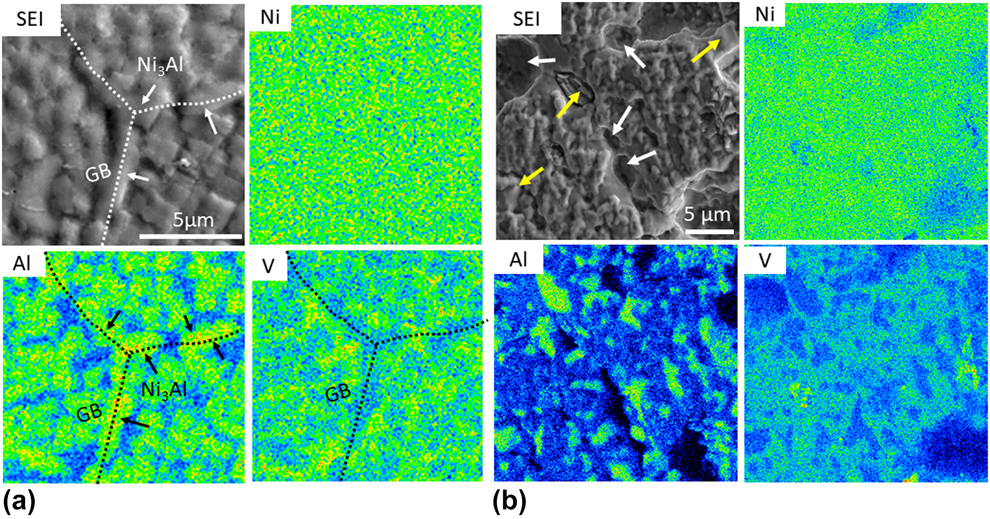
Figure 3(a) shows the FESEM-SEI and electron probe micro analysis (EPMA) elemental maps of the microstructure involving the grain boundaries of the Ni75Al10V15 (Base) alloy. In the grain interior, Al-rich and V-rich regions (corresponding to the Ni3Al precipitates and channel region, respectively) exhibit complementary patterns each other. On the other hand, relatively large primary Ni3Al phase tends to be preferentially precipitated at grain boundaries and covers large area of grain boundaries, which is supposed to be developed at high temperature before the eutectoid reaction.
FESEM-SEIs and EPMA elemental maps of (a) the microstructure involving grain boundaries as well as grain interior and (b) the fracture surface of the Ni75Al10V15 alloy. In the SEI of (b), large Ni3Al precipitates and wholes introduced by the large Ni3Al precipitates falling from grain boundaries are denoted by yellow and white arrows, respectively.
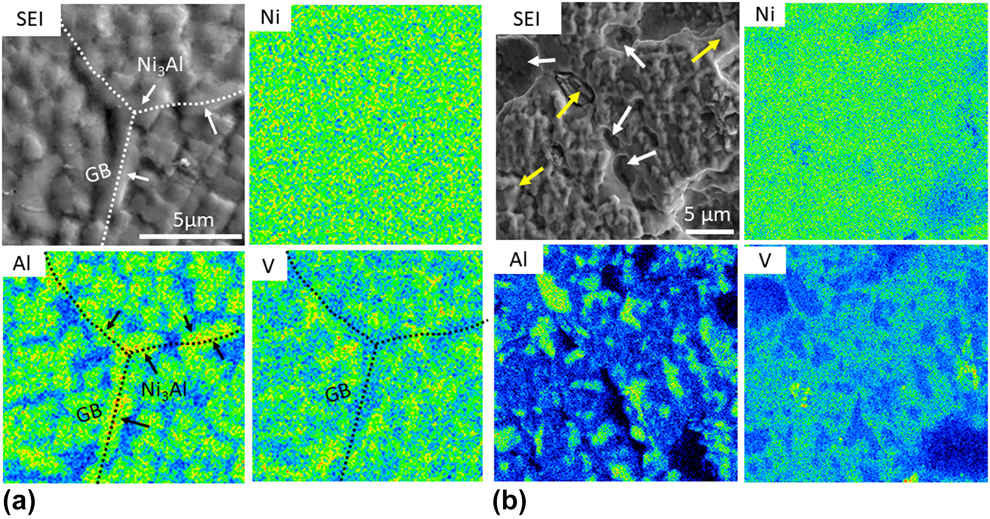
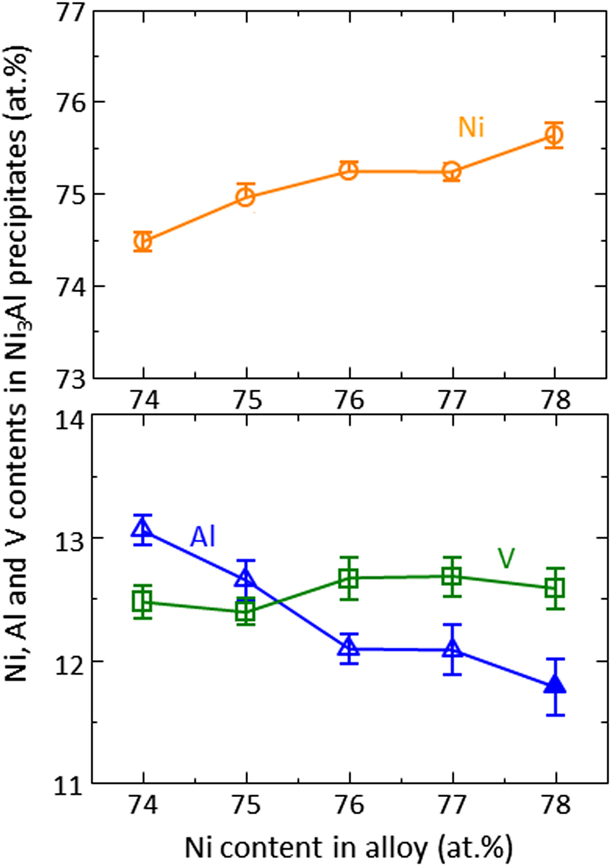
Figure 4 shows the variations of Ni, Al, and V contents in the primary Ni3Al precipitates with deviation from the stoichiometric composition for the Ni75+x(Al10V15)25−x alloys. The Ni content in the precipitates increases (until the Ni76Al10 alloy) and then slowly increases (until the Ni77Al10 alloy) with increasing Ni content in alloy, followed by an apparent increase with further increasing Ni content in alloy. The curve for the Al content draws a contrary variation: the Al content in the precipitates decreases (until the Ni76Al10 alloy) and then slowly decreases (until the Ni77Al10 alloy) with increasing Ni content in alloy, followed by an apparent decrease with further increasing Ni content in alloy. The Ni, Al, and V contents (75.2, 12.1, and 12.7 at.%) measured in the Ni3Al precipitates of both the Ni76Al10 and Ni77Al10 alloys are not so much different from either of those (75.4, 11.5, and 13.1 at.% after Kobayashi et al. [Reference Kobayashi, Sato, Hayashi, Osaka, Konno, Kaneno and Takasugi6] and 76.7, 11.3, and 12.0 at.% after Zapolsky et al. [Reference Zapolsky, Pareige, Marteau and Blavette28]) in the Ni3Al phase equilibrated in the coexistence of the Ni3Al, Ni3V, and Ni solid solution phases which are predicted from the equilibrium phase diagrams.
Variations of Ni, Al, and V contents in the primary Ni3Al precipitates with Ni content in the Ni75+x(Al10V15)25−x alloys, which were analyzed by EPMA.
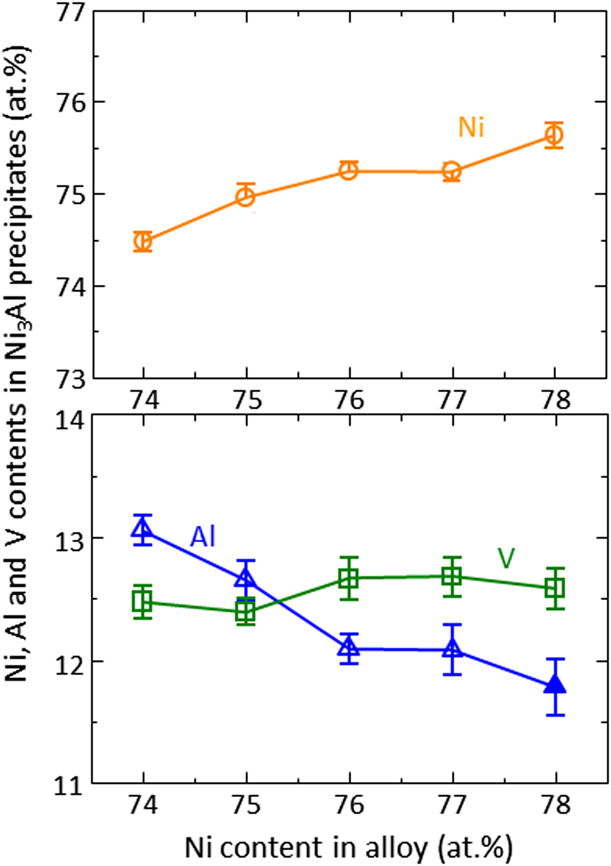
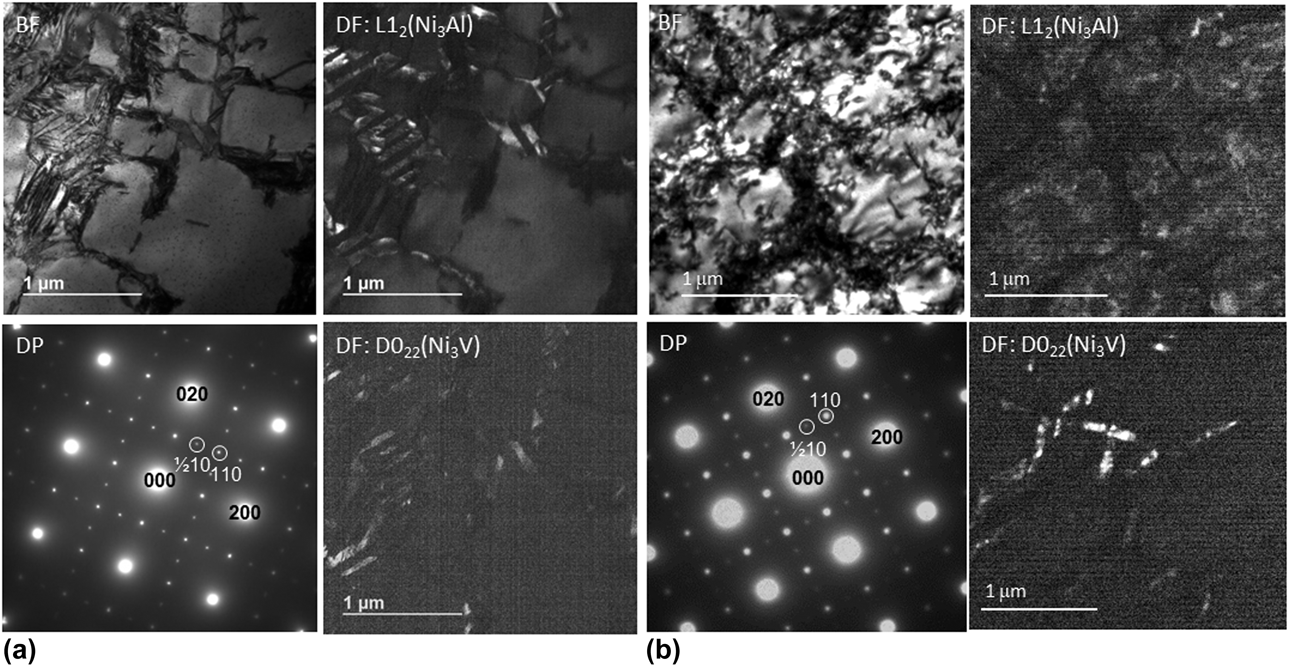
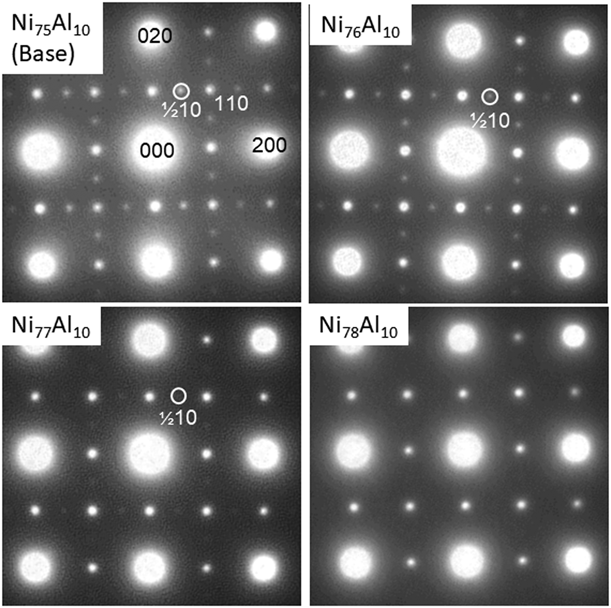
Figure 5 shows the transmission electron microscopyic (TEM) images and selected area diffraction patterns (SADP) of the microstructures of the Ni75Al10 (Base) and Ni76Al10 alloys which were taken from area containing both the primary Ni3Al precipitates and channel region. For the just-stoichiometric alloy [Ni75Al10 (Base)], lamellar-like microstructures, which are constituted alternately by the Ni3V and Ni3Al phases or by the variant structures of the Ni3V phase, were observed in the channel regions. Such lamellar-like microstructures have been so far observed in some alloys [Reference Nunomura, Kaneno, Tsuda and Takasugi3, Reference Shibuya, Kaneno, Yoshida and Takasugi4, Reference Shibuya, Kaneno, Tsuda and Takasugi5, Reference Moronaga, Kaneno, Semboshi and Takasugi7]. In both the alloys, the ordered spots 1/2 1 0 from the D022 phase were visible and the corresponding dark-field (DF) images were observed as a lamellar form in the channel region, therefore indicating that the Ni3V phase is actually present in the channel region of both the alloys. The primary Ni3Al precipitates for the Ni75Al10 (Base) alloy were imaged to be defect free in the bright-field (BF) images taken by not only the [001] beam direction but also other reflections. However, those for the Ni76Al10 alloy were imaged to contain a number of line defects, probably, dislocations although the reason of the presence is unclear at the present time. Here, if paying an attention on the ordered spots 1/2 1 0 from the D022 phase, the intensity became weaker as the alloy composition deviates from the just-stoichiometric one to the Ni-rich one, as shown in Fig. 6. The result reveals that the ordering of the Ni3V phase in the channel region is less progressive as the alloy composition deviates from the just-stoichiometric one. Also, it was observed that the lamellar-like microstructure in the channel region became more obscure with further deviation from the just-stoichiometric composition.
TEM images and SADP of the (a) Ni75Al10 (Base) and (b) Ni76Al10 alloys. The two DF images were taken using encircled spots 110 from the L12 phase and 1/210 from the D022 phase in the SADP.

Variation of the SADPs of the Ni75+x(Al10V15)25−x alloys with deviation from the just-stoichiometric composition.

Hardness and tensile properties
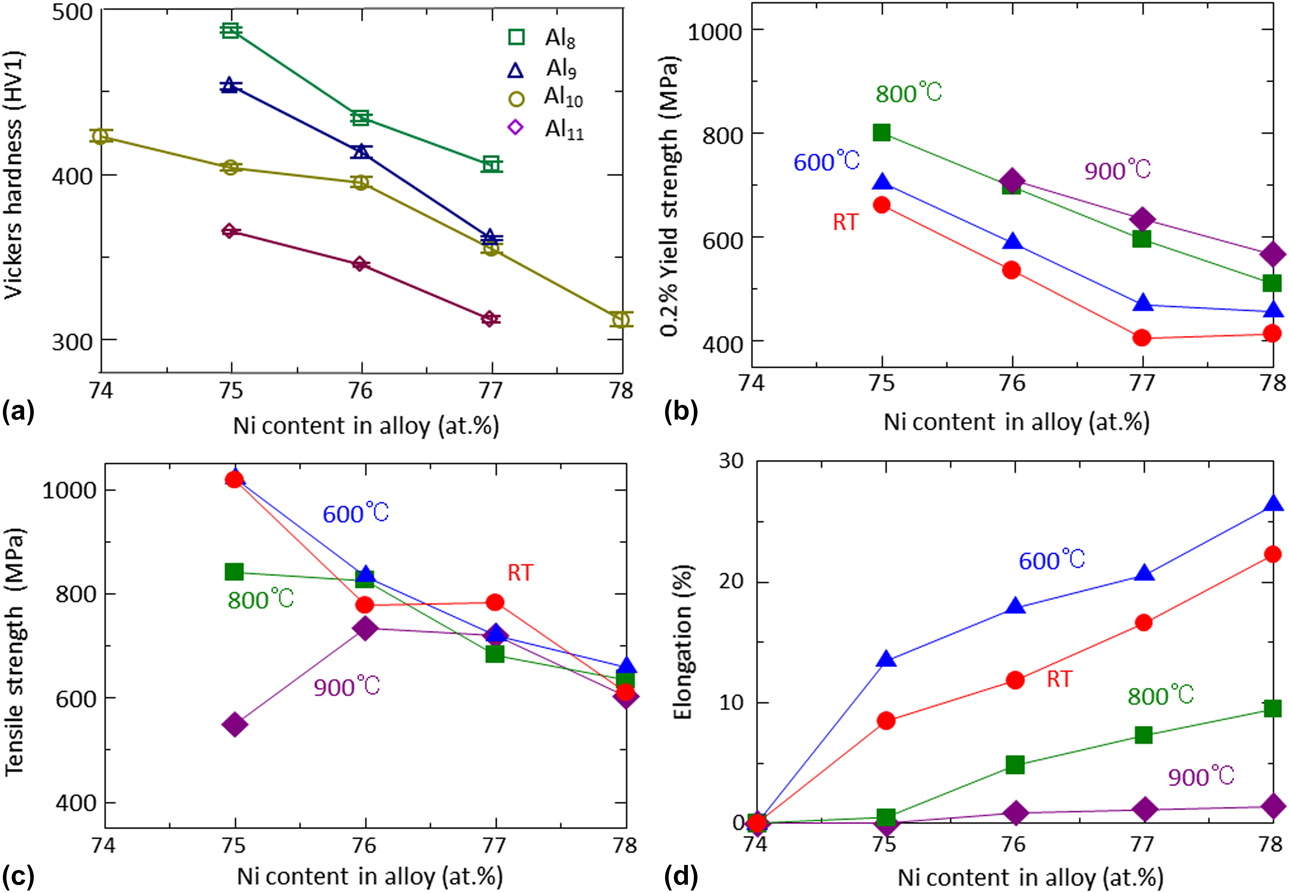
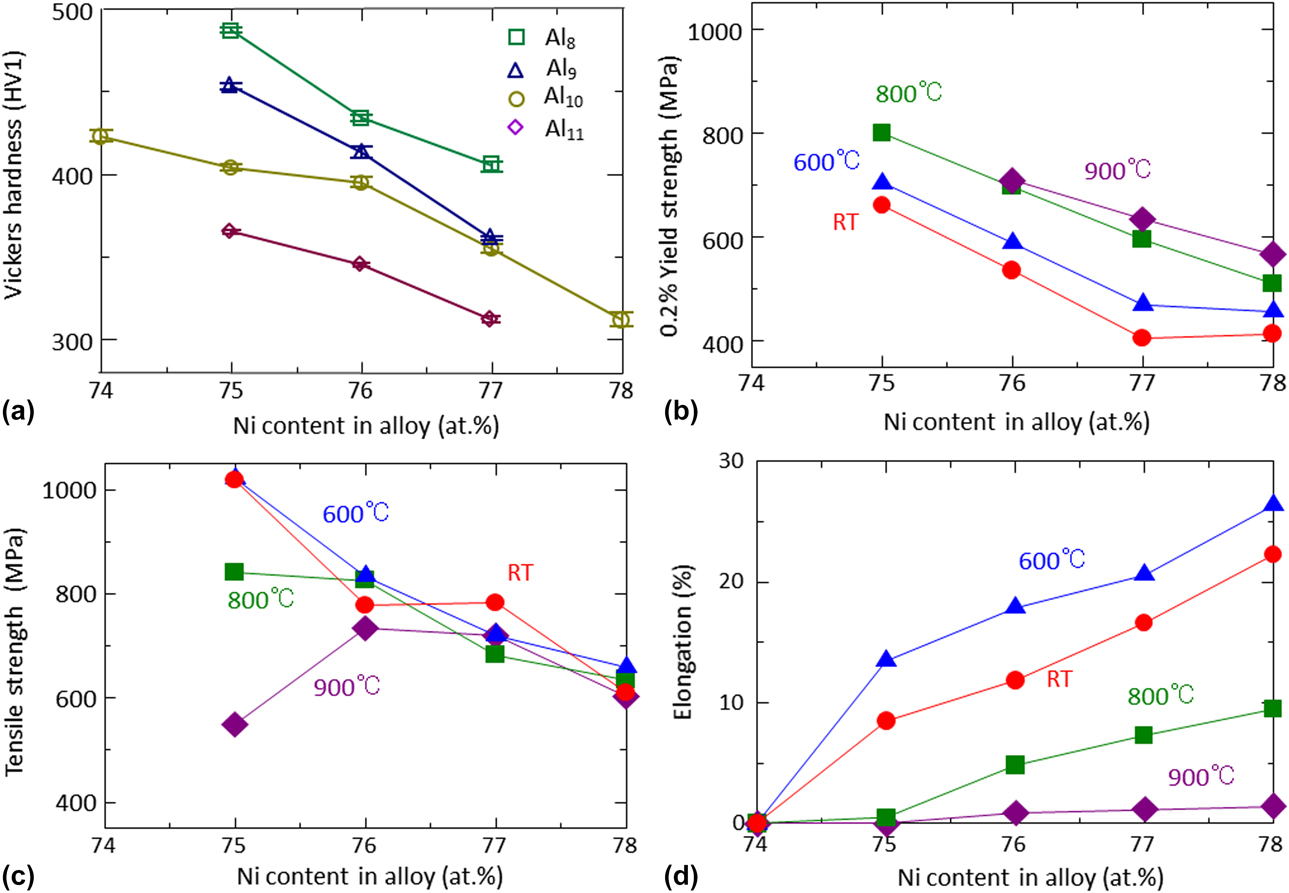
Figure 7(a) shows the variation of the Vickers hardness with Ni content in the alloys having a different atomic ratio of Al to V. The hardness level decreases as the atomic ratio of Al to V increases, which is attributed to decrease in the volume fraction of the harder Ni3V phase. The hardness generally decreases with increasing Ni content in alloys.
Variations of the (a) Vickers hardness, (b) 0.2% yield strength, (c) tensile strength and (d) tensile elongation with Ni content in the Ni75+x(Al10V15)25−x alloys (b, c, d) tensile deformed at RT, 600, 800, and 900 °C.
The tensile axis of the prepared tensile specimens was perpendicular to the axes of the columnar grains developed in the arc-melted buttons: the tensile specimens were composed of the so-called bamboo-type grains. Consequently, a majority portion of grain boundaries should receive normal stress under tensile loading, implying that brittleness induced by intergranular fracture more severely occurs in the present tensile specimens than the specimens composed of equi-axed grains with random orientation.
Figures 7(b)–7(d) show the variations of the yield strength, tensile strength, and tensile elongation with Ni content in the Ni75+x(Al10V15)25−x alloys tensile deformed at room temperature (RT), 600, 800, and 900 °C. Regarding the temperature dependence, the yield strength generally increased with increasing temperature, indicating negative temperature dependence of the yield strength [Reference Takeuchi and Kuramoto29, Reference Pope and Ezz30], which has been observed in many L12-type intermetallic compounds [Reference Pope and Ezz30, Reference Mulford and Pope31, Reference Aoki and Izumi32, Reference Imajo, Kaneno and Takasugi33]. The tensile strength was generally insensitive to test temperature, keeping almost constant values until 600 or 800 °C. On the other hand, the tensile elongation generally increased with increasing test temperature and made a maximum at 600 °C, followed by substantial decrease at high temperatures above 600 °C. Regarding the compositional dependence, the yield strength and tensile strength were the highest in the Ni75Al10 (Base) alloy, whereas the tensile elongation was the lowest in the Ni75Al10 (Base) alloy, regardless of test temperature. The plotted curves reveal that the effect of the off-stoichiometry is significant: as the Ni content in alloy deviates from the just-stoichiometric composition, the yield strength and tensile strength decreased, whereas the tensile elongation conversely increased. The strength data of the Ni74Al10 alloy were not plotted because the fracturing took place before reaching 0.2% plastic strain. It is supposed that no tensile elongation in the Ni74Al10 alloy is due to deficit Ni content in the two constituent phases, as have been observed in some L12-type M3B alloys [Reference Takasugi, Masahashi and Izumi25]. Also, the possibility that the presence of harder Ni2V phase which is predicted from the phase diagram [Reference Hayes, Rogl, Schmid, Petzow and Effenberg34] caused severe brittleness cannot be denied. In Fig. 7(c), the reduction in the tensile strength observed for the Ni75Al10 (Base) alloy deformed at 800 °C as well as 900 °C is due to the premature fracturing before yielding, as understood from Fig. 7(d).
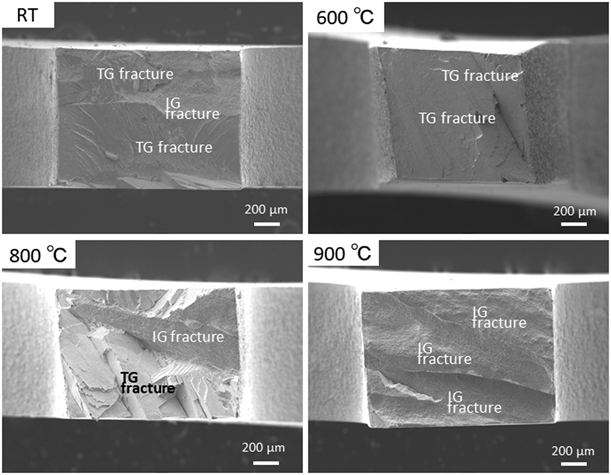
Figure 8 shows the fractographs of the Ni75Al10 (Base) alloy deformed at RT, 600, 800, and 900 °C. At RT, the fracturing took place in transgranular mode mixed with intergranular mode. In the present alloy system, the transgranular fracture did not exhibit dimple patterns but quasi-cleavage-like patterns. At 600 °C, the fracturing took place predominantly in the transgranular mode through the entire fracture surfaces. At 800 °C, the fracturing again took place in the intergranular mode mixed with transgranular mode. At the highest temperature, 900 °C, intergranular fracturing dominated the entire fracture surfaces. Similar temperature dependence of the fracture mode was observed in other Ni75+x(Al10V15)25−x alloys. The result implies that in the present alloy system, the transgranular fracture is much more ductile mode than the intergranular fracture. Consequently, the variation of the fracture mode with test temperature is consistent with that of the tensile elongation with test temperature shown in Fig. 7(d): the invasion of intergranular fracturing results in decrease in the tensile elongation, regardless of test temperature or alloy composition. To evaluate the effect of off-stoichiometry on the fracture mode, the fractographs of the Ni75+x(Al10V15)25−x alloys deformed at RT were compared (not shown here). In the Ni74Al10 alloy, intergranular fracture mode dominated the entire fracture surfaces, consistent with no tensile elongation observed in Fig. 7(d). As the Ni content in alloy deviates from the just-stoichiometric composition, more transgranular fracture patterns prevailed the fracture surfaces of alloys, consistent with the variation of the tensile elongation with the Ni content in alloy [Fig. 7(d)].
Fractographs of the Ni75Al10 (Base) alloy deformed at RT, 600, 800, and 900 °C. The TG and IG fractures mean transgranular and intergranular fractures, respectively.

Detailed fractographs at high magnification were investigated. Figure 3(b) shows the FESEM-SEI fractograph and EPMA elemental maps on the exposed intergranular fracture surface of the Ni75Al10V15 alloy tensile deformed at RT. Large area of the exposed fracture surfaces appears to be covered by the channel region where relatively large Ni3Al precipitates and holes introduced by the large Ni3Al precipitates falling from grain boundaries were observed, suggesting that the large Ni3Al precipitates acted as stress concentrator, resulting in initiation sites of the intergranular fracture. Thus, the observed morphological and compositional features reveal that the present two-phase alloys are intrinsically fragile because the grain boundaries are prevailed by the harder channel region (i.e., eutectoid microstructure) in addition to the dispersion of larger Ni3Al precipitates. On the other hand, the compositional feature observed on the transgranular fracture surface (not shown here) was similar to that of the microstructure in the grain interior shown in Fig. 3(a). The result implies that the fracture path does not lie on the interfaces between the precipitate and channel but penetrates through the both regions. The fracture path had to penetrate along octahedral {111} planes through both the Ni3Al precipitate and channel region consisting of Ni3Al and Ni3V phases. In a previous study using a single crystal of the present dual two-phase alloy, it has been investigated that the transgranular fracture took place along octahedral {111} planes, accompanied with appreciable plastic deformation [Reference Shibuya, Kaneno, Yoshida, Shishido and Takasugi15].
Relation between the strength (hardness) and tensile elongation
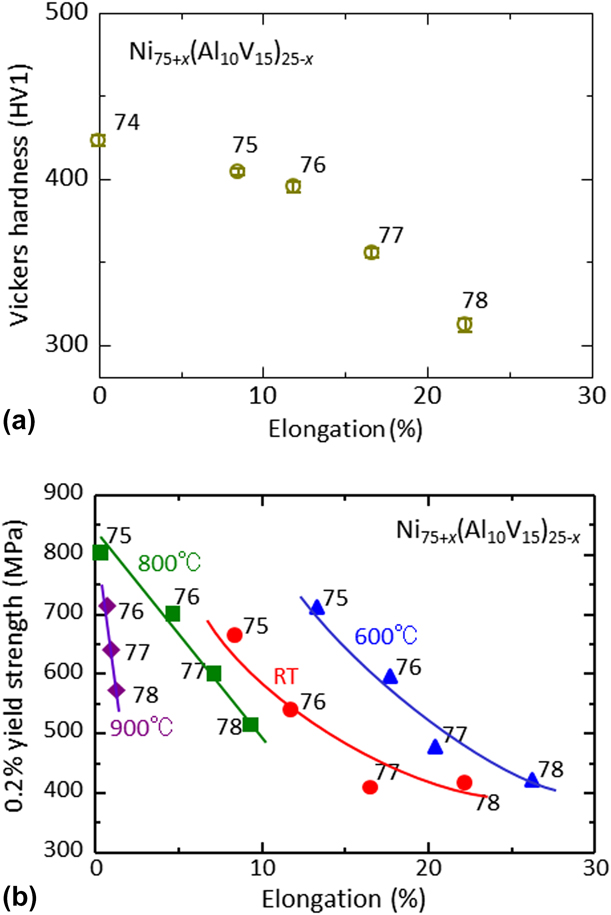
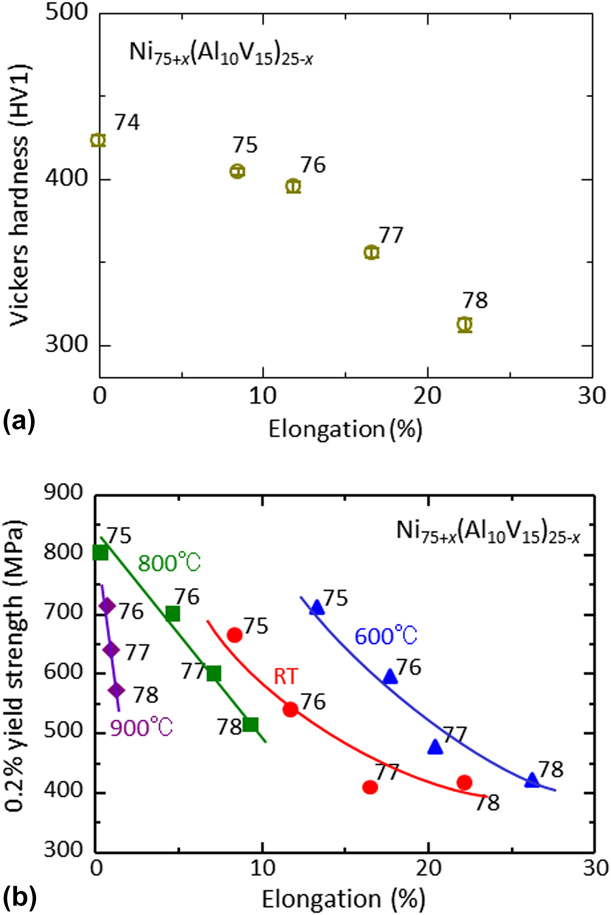
Regarding the balance of the strength (or hardness) and tensile elongation for the alloy system investigated in this study, Fig. 9(a) shows the variation of the RT Vickers hardness with the tensile elongation for the Ni75+x(Al10V15)25−x alloys. It is evident that the Vickers hardness decreased as the tensile elongation increased, indicating trade-off relation between the both properties. Figure 9(b) shows the relation between the yield strength and tensile elongation for the Ni75+x(Al10V15)25−x alloys, plotting the data for the alloys with different off-stoichiometric compositions. The plots were done at RT, 600, 800, and 900 °C. At all test temperatures, the yield strength decreased as the tensile elongation increased, again indicating the trade-off relation between the both properties. As temperature increases from RT to 600 °C, the trade-off curve was more shifted toward higher tensile elongation region than toward higher yield strength region. The result implies that the increase of the tensile elongation via enhancing the grain boundary cohesion by the temperature increase is much larger than the increase in the flow strength of the matrix (grain interior) due to the positive temperature dependence of the flow strength [Reference Takeuchi and Kuramoto29, Reference Pope and Ezz30]. At high temperatures beyond 600 °C, the balance of the yield strength and tensile elongation was degraded: the trade-off curve was shifted toward lower tensile elongation region without receiving the merit of the flow strength increase.
(a) Relations between the Vickers hardness and tensile elongation and (b) between the 0.2% yield strength and tensile elongation for the Ni75+x(Al10V15)25−x alloys. The numbers denoted in the figures mean the Ni contents in the alloys.
Discussion
From the present TEM observation, it is hard to determine whether the A1 (Ni solid solution) phase is present or absent in the channel region, because there is no diffraction spots uniquely identifying the A1 phase and therefore the technique using DF image is not applicable to image the A1 phase: all possible diffraction spots corresponding to the A1 phase are involved in those corresponding to the Ni3Al or Ni3V phase. However, it is likely that the A1 phase is precipitated in the channel region of the Ni76Al10 alloy and more Ni-rich alloys. Besides, the phase separation into the eutectoid microstructure appears to be incomplete in the off-stoichiometric alloys. For the Ni78Al10 alloy with the highest Ni content, the diffraction spots from the Ni3V phase are eventually invisible, thereby indicating that the Ni3Al phase is directly equilibrated with the A1 phase.
Let us discuss the microstructures observed in the present off-stoichiometric alloys which were decomposed under the condition of the cooling rate of ∼10 °C/min after solid solution treatment, referring those predicted from the equilibrium phase diagrams drawn by Kobayashi et al. [Reference Kobayashi, Sato, Hayashi, Osaka, Konno, Kaneno and Takasugi6] and Zapolsky et al. [Reference Zapolsky, Pareige, Marteau and Blavette28]. The former equilibrium phase diagram was constructed using the specimens annealed at 950 °C for 2000 h while the latter one using the specimens annealed at 800 °C for 24 h. It does not appear that the latter phase diagram draws “equilibrium” one. The result that the Ni3V phase is present in the Ni77Al10 alloy is consistent with the phase diagram by Zapolsky et al. [Reference Zapolsky, Pareige, Marteau and Blavette28] but inconsistent with one by Kobayashi et al. [see Fig. 1(b)]. On the other hand, the result that the Ni3Al and Ni solid solution phases coexist in the Ni78Al22 alloy is consistent with both phase diagrams. Thus, the microstructures of the present off-stoichiometric alloys meet the phase diagram predicted by Zapolsky et al.
If assuming that two-ordered Ni3Al and Ni3V phases and one-disordered (Ni solid solution) phase coexists in the channel region, the disordered phase might be localized between the different variants of the same ordered Ni3V phase or between the different ordered phases (Ni3Al and Ni3V). To resolve the constituent phases in extremely fine microstructures, for examples, an atom probe-field ion microscope as has been actually done by Zapolsky et al. [Reference Zapolsky, Pareige, Marteau and Blavette28] in the present alloy system or lattice images using high-resolution TEM will be potential analysis procedures. An experimental study based on such atomistic measurements is currently considered to fully understand the microstructures formed in the channel region of the off-stoichiometric alloys which were simply cooled down from high temperature and received the eutectoid reaction.
For the decrease in the strength as well as hardness (Fig. 7) by the deviation from the just-stoichiometric composition, an explanation based on the effects of the reduced ordering in the two-ordered phases [Reference Stoloff and Davies35, Reference Stoloff36] and the presence of the disordered phase are possible. It is suggested that the latter effect more prevails in the largely off-stoichiometric alloys than the former effect because the volume fraction of the A1 (Ni solid solution) phase increases with deviating from the just-stoichiometric composition.
The observed tensile elongation was strongly correlated with the propensity of the intergranular fracture: the more the intergranular fracturing, the lower the tensile elongation becomes. As shown in Fig. 3, the grain boundaries of the present alloy system are not only morphologically but also compositionally complicated. The grain boundaries are constituted of several types of interface planes between the Ni3Al precipitate and channel, the Ni3Al precipitate and Ni3Al precipitate, and the channel region and channel region. The most preferable (or resistive) interface plane to the intergranular fracture is not explicitly determined in this study. However, if the ordering of two ordered phases are reduced and also the Ni content in the two ordered phases becomes surplus [Reference Aoki23, Reference Liu, White and Horton24, Reference Takasugi, Masahashi and Izumi25], any interface planes mentioned above should become strong, thereby suppressing the intergranular fracturing. In the alloys largely deviated from the just-stoichiometric composition, further increase in the tensile elongation had to be promoted by preferential precipitation of the disordered phase at grain boundaries as well as grain interior, thereby enhancing the grain boundary cohesion. Further studies particularly involving the effect of the off-stoichiometry on the mechanical properties of the Ni3V phase, which has not been reported until today, are definitely required to justify mechanisms by which the intergranular fracturing is suppressed in the largely off-stoichiometric alloys.
Conclusions
The microstructures and tensile properties of the off-stoichiometric Ni3Al–Ni3V pseudo-binary alloys were investigated by an FESEM, a TEM, Vickers hardness test, and high-temperature tensile test. The following results were obtained from the present study.
(1) As the alloy composition deviates from the just-stoichiometric composition toward the Ni-rich one, the constituent phases are suggested to be changed from two ordered phases, Ni3Al and Ni3V to two ordered phases Ni3Al and Ni3V and one disordered phase (Ni solid solution).
(2) As the alloy composition deviates from the just-stoichiometric composition toward the Ni-rich one, the flow strength as well as Vickers hardness decreased, whereas the tensile elongation increased.
(3) High tensile elongation in the off-stoichiometric alloys was induced by the transition from intergranular fracturing to transgranular fracturing.
(4) The trade-off relation in the yield strength (or hardness) versus tensile elongation curve, which was drawn plotting the data for the alloys with different off-stoichiometric compositions, was improved by temperature increase from RT to 600 °C but was degraded at high temperatures beyond 600 °C.
(5) From the observed results, it was shown that the off-stoichiometry in the two-phase Ni3Al–Ni3V pseudo-binary alloy system is useful alloying parameter to improve the balance of the flow strength and tensile ductility.
Experimentals
The alloys were made from raw metals with purities of 99.99 wt% Ni, 99.99 wt% Al and 99.9 wt% V and doped with 50 wt ppm boron to suppress a propensity of intergranular fracture. Button ingots with 30 mm in diameter were prepared by arc-melting in argon gas atmosphere using a non-consumable tungsten electrode on a copper hearth. The button ingots were melted at least three times to ensure chemical homogeneity through the entire cross section. Since the weight loss (or gain) of the arc-melted buttons during melting was less than 0.1 wt% the actual alloy compositions have to be close to the intended compositions. The arc-melted buttons were solution-treated (homogenized) at 1280 °C in the A1 (γ) phase field for 5 h in vacuum and then furnace-cooled at a rate of 10 °C/min to RT. The button ingots were then cut into a plate form with 1.5 mm in thickness which are suitable for the observation and tests.
Microstructural observation and EPMA were performed with the FESEM [JEOL JXA-8530F (JEOL Ltd., Tokyo, Japan) equipped with wave dispersive spectroscopy (WDS) operating at 20 kV] and TEM (JEM-2000EX and JEM-2000FX operating at 200 kV). The specimens used for the FESEM observation were abraded on SiC paper and were electrochemically polished in a mixture solution of 15 vol% H2SO4 + 85 vol% CH3OH at −20 ∼ −10 °C. The chemical compositions in the constituent phases were analyzed with FESEM-WDS. K α lines were used for the analyses of Ni, Al, and V. The specimens used for the TEM observation, with 3 mm in diameter, were mechanically abraded to approximately 30 μm in thickness. They were electrochemically jet-polished at approximately −20 °C in a mixture solution mentioned above and then Argon gas ion-milled in the conditions of an accelerated voltage of 3.7 keV and a holding time within 1 h. The TEM observation for the microstructures of the prepared alloys was performed mostly using a beam incident from [001] of the Ni3Al or Ni3V phase, particularly paying an attention on the microstructures of the channel region.
Vickers hardness test was performed in the conditions of a holding time of 10 s and a load of 9.8 N at RT for all the arc-melted buttons prepared in this study. In each hardness measurement, about 10 data points were collected and averaged, excluding the largest and smallest data points. Tensile specimens with a gauge dimension of 2 × 1.2 × 10 mm3 were cut from the solution-treated arc button using an electron discharge machine and then abraded on a sufficiently fine SiC paper. The tensile tests were conducted at RT, 600, 800, and 900 °C within a split-type electric furnace. The electric furnace was evacuated to a vacuum of approximately 1.5 × 10⁻³ Pa before tensile testing. The tensile specimens were heated in the furnace to an intended temperature and then held for at least 10 min before pulling them. The tensile specimens were then deformed at an initial strain rate of 1.67 × 10⁻⁴ s−1 up to fracturing. The yield strength was defined at a plastic strain of 0.2%, whereas the tensile strength was calculated by dividing the fracture load (or ultimate load) by the initial cross-section of the specimen. The tensile elongation was calculated from a load–elongation curve drawn using the recorded data and defined as a plastic strain to fracture. The fracture surfaces of the tensile-deformed specimens were examined in terms of microstructural, morphological and compositional features using FESEM and EPMA.
Acknowledgments
The authors thank Dr. M. Nagasako, Mr. E. Aoyagi, and Mr. S. Itoh of the Institute for Materials Research (IMR) of Tohoku University for their experimental assistance.