1 Introduction
The floating elastic plate is one of the key canonical problems in hydroelasticity. It can serve as both an illustrative example and as a practical model for the frozen ocean or for vlfs (very large floating structures) (Squire Reference Squire2007, Reference Squire2011). The interaction of waves with an ice sheet or vlfs generates flexural-gravity waves which are coupled to the floating elastic structure and the underlying fluid. The study of wave–ice interaction using the floating elastic plate model begins with Kheysin (Kheysin Reference Kheysin1963, Reference Kheysin1964; Kheisin Reference Kheisin1969; Kheysin Reference Kheysin and Yakovlev1973). Most of the studies in hydroelasticity are concerned with scattering (Squire Reference Squire2007, Reference Squire2011; Sahoo Reference Sahoo2012) but the propagation of plane waves in a uniform ice cover can be highly sophisticated when moving loads or compressive effects are considered. Flexural-gravity wave patterns on an ice plate due to a moving load were given in Davys, Hosking & Sneyd (Reference Davys, Hosking and Sneyd1985). In a follow-up paper, Schulkes, Hosking & Sneyd (Reference Schulkes, Hosking and Sneyd1987) considered three additional modelling features: compressive stress, current and water stratification. The impact of the compressive stress was to reduce the phase speed corresponding to the critical load and to alter the group speed (Schulkes et al. Reference Schulkes, Hosking and Sneyd1987, figure 2), a phenomenon which can be more important in thinner ice or under high compressive stress (Squire et al. Reference Squire, Hosking, Kerr and Langhorne2012, § 7.2.5). The flexural-gravity wave pattern was shown to be re-oriented relative to the direction of the moving load by a current. A remarkable validation of the floating elastic plate model for waves due to moving loads on the ice was given in Squire et al. (Reference Squire, Robinson, Langhorne and Haskell1988). Under certain circumstances, the dispersion relation corresponding to plane progressive flexural-gravity waves possesses more than one root, and this results in wave blocking, a phenomenon in which the group velocity becomes null and wave energy ceases to propagate. While this phenomenon was first found in Schulkes et al. (Reference Schulkes, Hosking and Sneyd1987), it was studied in detail in Das, Sahoo & Meylan (Reference Das, Sahoo and Meylan2018), who provided an analytic expression for the compressive force that results in wave blocking and connected wave blocking in the presence of a current to analogue gravity. We note here that perfect wave blocking is not possible if we include effects due to the slight compressibility of water or the elasticity of the ocean bottom (Eyov et al. Reference Eyov, Klar, Kadri and Stiassnie2013; Abdolali et al. Reference Abdolali, Kadri, Parsons and Kirby2018).
In the context of free surface gravity waves, blocking occurs due to the interaction of waves with an opposing current. This effect is often observed near the entrance of tidal inlets. The impact of the opposing current reduces the wavelength of the incoming waves, resulting in an increase in wave height. Hence, prior to blocking, the wave environment can become very rough and result in navigational hazards (see Chawla & Kirby Reference Chawla and Kirby2002). Further, in the case of short-crested waves, the opposing current can even reflect the incoming waves (Trulsen & Mei Reference Trulsen and Mei1993). Smith (Reference Smith1975) demonstrated that away from the blocking region, the wave field consists of an incident wave and a much shorter reflected wave. Peregrine (Reference Peregrine1976), using linear water wave theory, first established a mathematical method for describing wave blocking in the presence of an opposing current. Various experiments were conducted to validate the theory of wave blocking (Ris & Holthuijsen Reference Ris and Holthuijsen1996; Chawla & Kirby Reference Chawla and Kirby1998, Reference Chawla and Kirby2002). The effect of surface tension in wave blocking was first predicted by Phillips (Reference Phillips1981) and later analytically established by Shyu & Phillips (Reference Shyu and Phillips1990) in the case of one-dimensional waves. Subsequently, Shyu & Tung (Reference Shyu and Tung1999) incorporated wave obliqueness and investigated the blocking effect in the presence of a unidirectional steady irrotational current. Trulsen & Mei (Reference Trulsen and Mei1993) used boundary layer theory to prove that in the presence of surface tension, often short reflected waves are re-reflected from a second blocking point downstream of the primary gravity wave blocking point. Nardin, Rousseaux & Coullet (Reference Nardin, Rousseaux and Coullet2009), using dynamical systems theory, studied the hydrodynamic phenomenon of wave blocking by a counter-current and established a direct analogy with rainbow and black hole dynamics. Maissa, Rousseaux & Stepanyants (Reference Maissa, Rousseaux and Stepanyants2013) presented a brief review of wave–current interaction and discussed different scenarios of wave blocking which include the effects of Froude number, water depth, surface tension, vorticity and the effects of weak nonlinearity. Recently Das et al. (Reference Das, Sahoo and Meylan2018) studied flexural-gravity waves in a homogeneous fluid having a plate covered surface with compression and a current. They showed that wave blocking occurred under the influence of compressive force and an opposing current, and drew an analogy between the dynamics of wave propagation for such a problem and the propagation of light waves near black holes (such a connection is known as analogue gravity). However, wave blocking in a stratified fluid does not appear to have been considered previously outside the work of Schulkes et al. (Reference Schulkes, Hosking and Sneyd1987).
Density stratifications in fluids frequently occur in nature in both the ocean or other bodies of water and the atmosphere. The primary reasons for such stratification is an abrupt change in temperature or salinity with depth for water or due to a sudden change in temperature or humidity with altitude for the atmosphere. It is standard to approximate the fluid as a two-layer system with the upper layer resting over a lower layer of higher density. This approximation is especially valid in the ocean where there often exists a thin pycnocline where a drastic change in density occurs, and the water is well mixed above and below it. For a two-layer fluid with a free surface and an interface, there exist both surface and internal modes, by which we mean modes which are predominantly at the surface or predominantly at the interface. This was initially explained by Stokes (Reference Stokes1847). A generalization of the standard two-layer problem is to consider a two-layer fluid medium in the presence of a floating elastic plate/floating ice sheet, first considered by Schulkes et al. (Reference Schulkes, Hosking and Sneyd1987). Bhattacharjee & Sahoo (Reference Bhattacharjee and Sahoo2008) studied wave–structure interaction problems in a two-layer fluid with an elastic plate covered free surface as a scattering problem. They analysed the characteristics of the associated eigenfunctions, which are important for understanding wave–structure interactions (Sahoo Reference Sahoo2012). One of the curiosities in two-layer fluids is the dead water phenomenon responsible for abnormal wave resistance experienced by ships. This phenomenon is well known to sailors. In fact, this type of still water situation where it is difficult to row a boat was mentioned in the Latin literature by Tacitus who experienced such situations in Scotland and Germany (see Mercier, Vasseur & Dauxois Reference Mercier, Vasseur and Dauxois2011). However, the first well-documented report on the dead water phenomenon was provided by the Norwegian Arctic explorer Fridtjof Nansen (see Nansen Reference Nansen1897), who encountered the phenomenon while sailing in his ship Fram near Nordenskiöld island in 1893. A proper scientific explanation of such abnormal behaviour was not provided until Ekman (Reference Ekman and Nansen1904), motivated by the report of Nansen, investigated the phenomenon in detail with the help of experiments. It was confirmed through his experiments that the huge resistance experienced by the slowly moving ship is mainly because of the generation of internal waves and that the maximum drag resistance occurred when ship speed matches that of the internal waves. The subsequent theoretical development of the theory for this phenomenon is mainly restricted to the linear case. Miloh, Tulin & Zilman (Reference Miloh, Tulin and Zilman1993) developed a linear theory for the dead water phenomenon in a two-layer fluid of finite depth. Recently, a nonlinear theory has been developed by Grue, Bourgault & Galbraith (Reference Grue, Bourgault and Galbraith2016).
Motivated by the results of Davys et al. (Reference Davys, Hosking and Sneyd1985), Schulkes et al. (Reference Schulkes, Hosking and Sneyd1987) and Das et al. (Reference Das, Sahoo and Meylan2018), we study here the dynamics of the blocking of flexural-gravity waves in a two-layer fluid having a plate covered surface in the presence of a compressive force, under the assumption of linear water wave theory and small amplitude structural response. Our objective is to analyse the dispersion relation and to obtain the analytic condition for blocking in both wave modes. Furthermore, we demonstrate the existence of multiple roots of the dispersion relation for incoming waves of fixed frequency, and the coalescence of the phase and group velocities of the surface and internal modes for certain parameter values. We establish the flexural-gravity analogue of dead water and consider the time-domain evolution of wave packets. The outline of this paper is as follows. In § 2 we give a mathematical formulation of the problem, and in § 3 we derive the dispersion equation under the assumption of plane waves. In § 4 we consider some special cases, namely an infinite lower layer with a finite or shallow upper layer and the case when both layers are shallow or deep. In § 5 we consider the flexural-gravity analogue of dead water. In § 6 we address the applicability of the theory presented in the manuscript. In § 7 we present some time-domain simulations and we end with brief conclusions in § 8.
2 Mathematical formulation
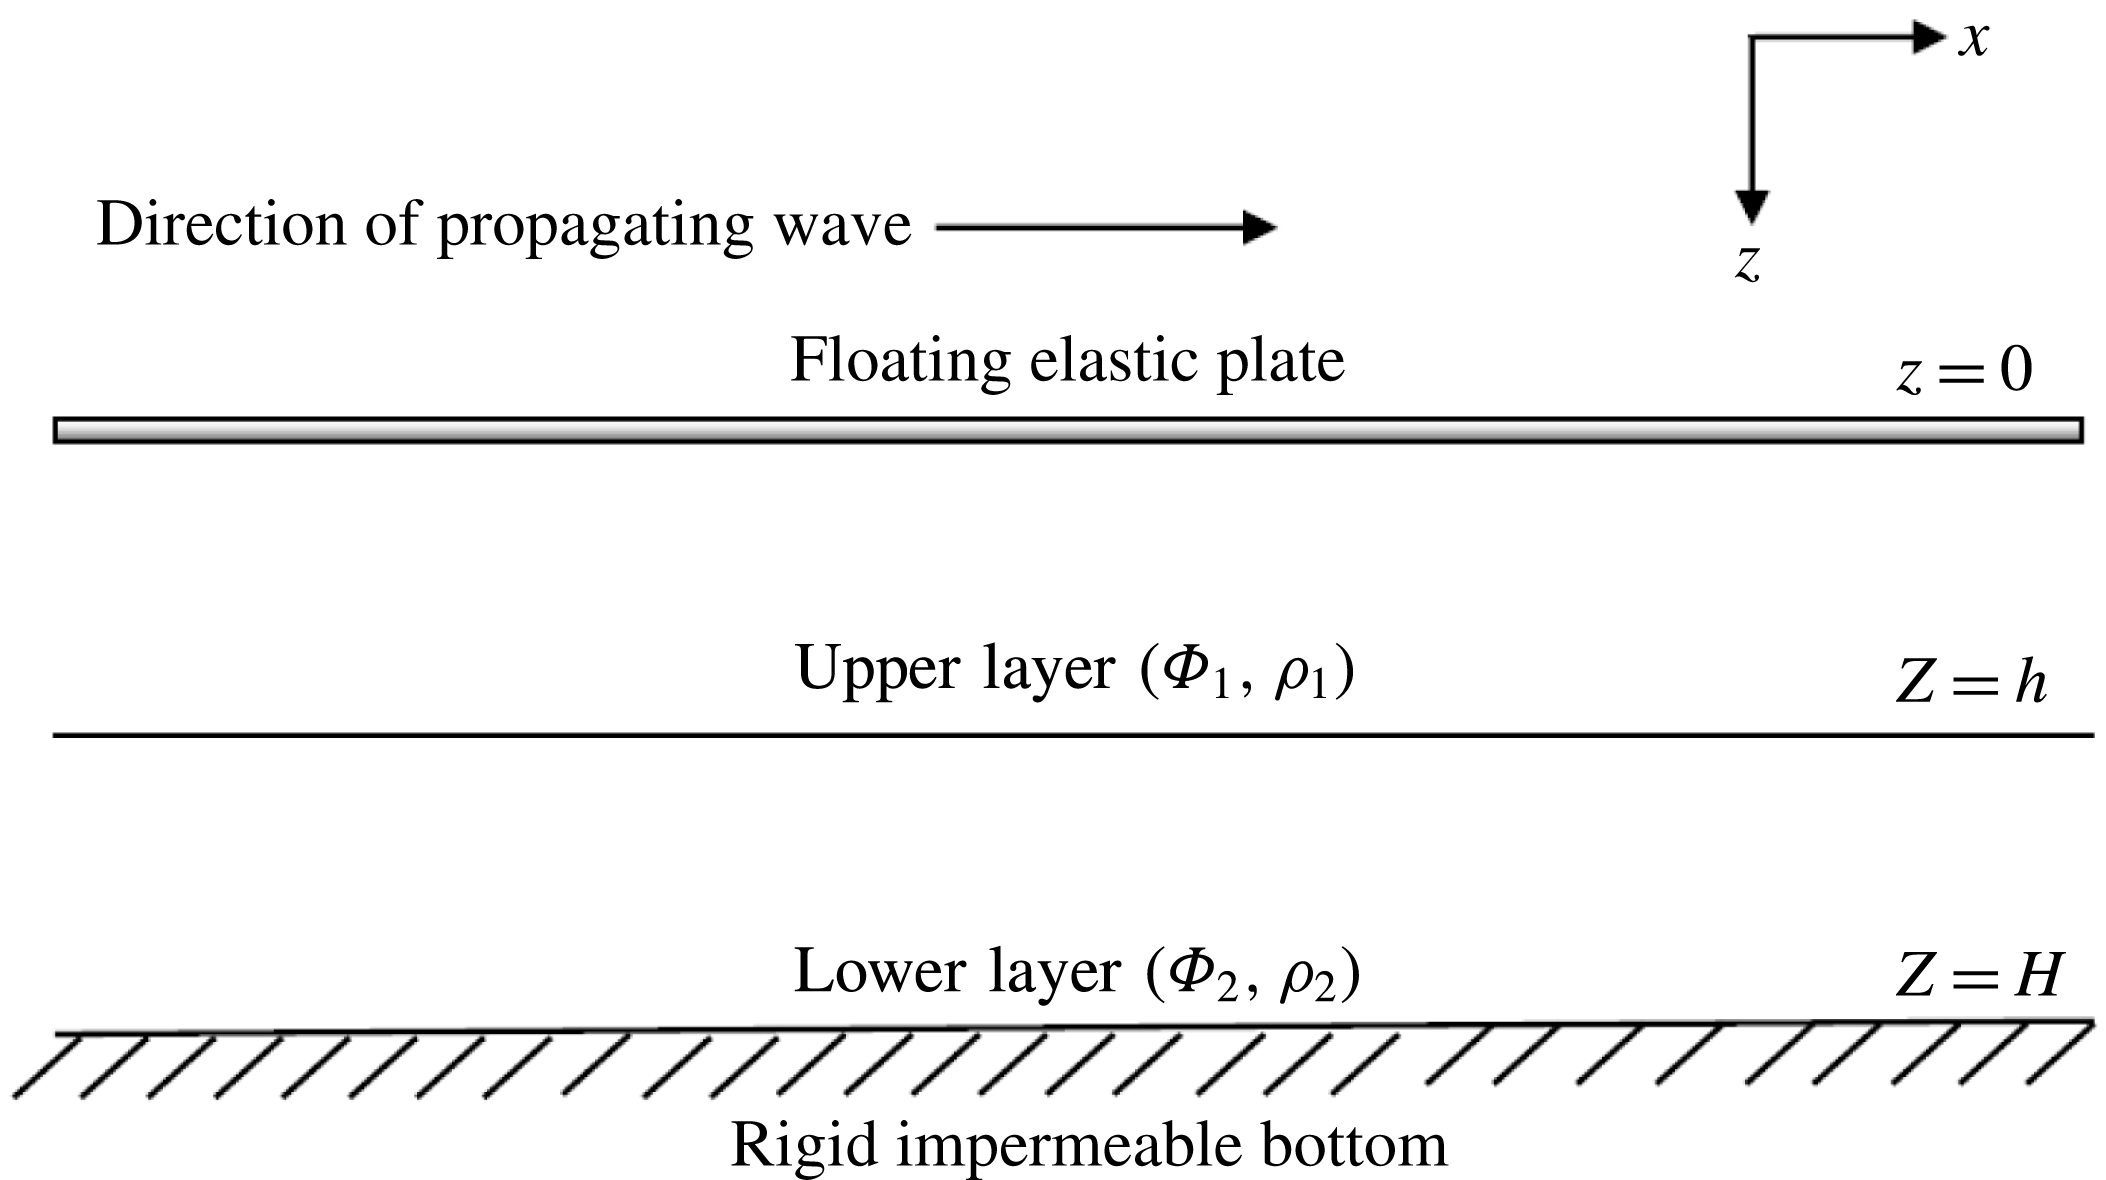
In the present study, we consider the small amplitude response of a floating thin elastic plate, the standard model for sea ice and very large floating structures. The thin elastic plate is assumed to be of infinite extent and floating on the mean free surface of the water of finite constant depth. The problem is two-dimensional with the
 $x$
-axis horizontal and the
 $z$
-axis vertically downward (figure 1). The fluid domain consists of two different immiscible fluids of density
 $\unicode[STIX]{x1D70C}_{1}$
and
 $\unicode[STIX]{x1D70C}_{2}$
such that
 $\unicode[STIX]{x1D70C}_{2}>\unicode[STIX]{x1D70C}_{1}$
and we define
 $s=\unicode[STIX]{x1D70C}_{1}/\unicode[STIX]{x1D70C}_{2}$
. Our interest here is to understand in detail the properties of the flexural-gravity waves which can propagate in such a system. The upper fluid occupies the region
 $-\infty <x<\infty$
,
 $0\leqslant z\leqslant h$
and the lower fluid occupies the region
 $-\infty <x<\infty$
,
 $h\leqslant z\leqslant H$
. The fluids are assumed to be inviscid, incompressible and the motions of both fluids are irrotational, which ensures the existence of the velocity potentials
 $\unicode[STIX]{x1D6F7}_{j}(x,z,t)$
for
 $j=1,2$
that satisfy the two-dimensional Laplace equation given by
 $$\begin{eqnarray}\unicode[STIX]{x1D6FB}^{2}\unicode[STIX]{x1D6F7}_{j}=0,\quad j=1,2,\end{eqnarray}$$
in the upper and lower layer fluid respectively. The linearized kinematic boundary condition on the plate covered surface is given by
 $$\begin{eqnarray}\frac{\unicode[STIX]{x2202}\unicode[STIX]{x1D702}_{1}}{\unicode[STIX]{x2202}t}=\frac{\unicode[STIX]{x2202}\unicode[STIX]{x1D6F7}_{1}}{\unicode[STIX]{x2202}z}\quad \text{on }z=0,\end{eqnarray}$$
where
 $\unicode[STIX]{x1D702}_{1}(x,t)$
is the deflection of the floating elastic plate. In the presence of in-axis compressive forces
 $N$
acting along the
 $x$
-axis of the homogeneous floating elastic plate, the linearized plate covered dynamic boundary condition on the mean free surface is given by (Kheisin Reference Kheisin1962, Reference Kheisin1969; Bukatov Reference Bukatov1980; Magrab & Leissa Reference Magrab and Leissa1980; Kerr Reference Kerr1983)
 $$\begin{eqnarray}\left(EI\frac{\unicode[STIX]{x2202}^{4}}{\unicode[STIX]{x2202}x^{4}}+N\frac{\unicode[STIX]{x2202}^{2}}{\unicode[STIX]{x2202}x^{2}}+\unicode[STIX]{x1D70C}_{p}d\frac{\unicode[STIX]{x2202}^{2}}{\unicode[STIX]{x2202}t^{2}}+\unicode[STIX]{x1D70C}_{1}g\right)\unicode[STIX]{x1D702}_{1}=\unicode[STIX]{x1D70C}_{1}\frac{\unicode[STIX]{x2202}\unicode[STIX]{x1D6F7}_{1}}{\unicode[STIX]{x2202}t}\quad \text{on }z=0,\end{eqnarray}$$
where
 $E=d^{3}/(12(1-\unicode[STIX]{x1D708}^{2}))$
is Young’s modulus,
 $\unicode[STIX]{x1D708}$
is Poisson’s ratio,
 $d$
is the thickness of the floating plate and
 $\unicode[STIX]{x1D70C}_{p}$
is the plate density. The linearized dynamic and kinematic boundary conditions at the mean interface are
 $$\begin{eqnarray}\displaystyle & \displaystyle \unicode[STIX]{x1D70C}_{2}\left\{g\unicode[STIX]{x1D702}_{2}-\frac{\unicode[STIX]{x2202}\unicode[STIX]{x1D6F7}_{2}}{\unicode[STIX]{x2202}t}\right\}-\unicode[STIX]{x1D70C}_{1}\left\{g\unicode[STIX]{x1D702}_{2}-\frac{\unicode[STIX]{x2202}\unicode[STIX]{x1D6F7}_{1}}{\unicode[STIX]{x2202}t}\right\}=0\quad \text{on }z=h, & \displaystyle\end{eqnarray}$$
 $$\begin{eqnarray}\displaystyle & \displaystyle \text{and}\quad \frac{\unicode[STIX]{x2202}\unicode[STIX]{x1D702}_{2}}{\unicode[STIX]{x2202}t}=\frac{\unicode[STIX]{x2202}\unicode[STIX]{x1D6F7}_{j}}{\unicode[STIX]{x2202}z}\quad \text{on }z=h\text{ for }j=1,2, & \displaystyle\end{eqnarray}$$
where
 $\unicode[STIX]{x1D702}_{2}(x,y,t)$
is the interface elevation. Finally, at the rigid bottom the boundary condition is given by
 $$\begin{eqnarray}\frac{\unicode[STIX]{x2202}\unicode[STIX]{x1D6F7}_{2}}{\unicode[STIX]{x2202}z}=0\quad \text{on }z=H.\end{eqnarray}$$
Schematic diagram of the physical problem.

3 Plane wave characteristics
In this section, the characteristics of the plane progressive wave solution are investigated by analysing the dispersion relation associated with the problem by assuming plane wave solutions of the form
 $$\begin{eqnarray}\displaystyle & \displaystyle \unicode[STIX]{x1D702}_{1}=\text{Re}\{a_{1}\text{e}^{\text{i}(kx-\unicode[STIX]{x1D714}t)}\}, & \displaystyle\end{eqnarray}$$
 $$\begin{eqnarray}\displaystyle & \displaystyle \text{and}\quad \unicode[STIX]{x1D702}_{2}=\text{Re}\{a_{2}\text{e}^{\text{i}(kx-\unicode[STIX]{x1D714}t)}\}, & \displaystyle\end{eqnarray}$$
where
 $k$
is the wavenumber,
 $\unicode[STIX]{x1D714}$
is the angular frequency,
 $a_{1}$
and
 $a_{2}$
are the amplitudes of the plate deflection and interface elevation, respectively. Thus, the velocity potentials
 $\unicode[STIX]{x1D6F7}_{1}$
and
 $\unicode[STIX]{x1D6F7}_{2}$
satisfying (2.1) along with the boundary conditions (2.2) and (2.6) are of the forms (Schulkes et al.
Reference Schulkes, Hosking and Sneyd1987)
 $$\begin{eqnarray}\displaystyle & \displaystyle \unicode[STIX]{x1D6F7}_{1}=(A\cosh kz-\text{i}\unicode[STIX]{x1D714}a_{1}k^{-1}\sinh kz)\text{e}^{\text{i}(kx-\unicode[STIX]{x1D714}t)}, & \displaystyle\end{eqnarray}$$
 $$\begin{eqnarray}\displaystyle & \displaystyle \unicode[STIX]{x1D6F7}_{2}=B\cosh k(H-z)\text{e}^{\text{i}(kx-\unicode[STIX]{x1D714}t)}, & \displaystyle\end{eqnarray}$$
where
 $A$
and
 $B$
are unknown constants to be determined. Using the boundary conditions (2.4) and (2.5) in (3.3) and (3.4), the constants
 $A$
,
 $B$
and
 $a_{2}$
are obtained in terms of
 $a_{1}$
by solving the matrix equation
 $$\begin{eqnarray}\left[\begin{array}{@{}ccc@{}}s\cosh kh & -\cosh \,k(H-h) & -(1-s)g/\text{i}\unicode[STIX]{x1D714}\\ \sinh kh & \sinh k(H-h) & 0\\ 0 & -\sinh \,k(H-h) & \text{i}\unicode[STIX]{x1D714}/k\\ \end{array}\right]\left[\begin{array}{@{}c@{}}A\\ B\\ a_{2}\\ \end{array}\right]=\left[\begin{array}{@{}c@{}}(\text{i}\unicode[STIX]{x1D714}sa_{1}/k)\sinh kh\\ (\text{i}\unicode[STIX]{x1D714}a_{1}/k)\cosh kh\\ 0\\ \end{array}\right].\end{eqnarray}$$
The solution of the above matrix system yields
 $$\begin{eqnarray}\unicode[STIX]{x1D6F7}_{1}=-\frac{\text{i}\unicode[STIX]{x1D714}}{k}(\unicode[STIX]{x1D707}\cosh kz+\sinh kz)\unicode[STIX]{x1D702}_{1},\end{eqnarray}$$
with
 $$\begin{eqnarray}\displaystyle & \displaystyle \unicode[STIX]{x1D707}=-\frac{s+\coth kh\{\coth k(H-h)-(1-s)gk/\unicode[STIX]{x1D714}^{2}\}}{s\coth kh+\coth k(H-h)-(1-s)gk/\unicode[STIX]{x1D714}^{2}} & \displaystyle\end{eqnarray}$$
 $$\begin{eqnarray}\displaystyle & \displaystyle \text{and}\quad r=\frac{a_{2}}{a_{1}}=\frac{s}{\sinh kh\{s\coth kh+\coth k(H-h)-(1-s)gk/\unicode[STIX]{x1D714}^{2}\}}. & \displaystyle\end{eqnarray}$$
Under the assumption that the plate thickness is very small compared to the wavelength, i.e. assuming the elastic restoring force to be much stronger than the inertial force, we neglect the term
 $\unicode[STIX]{x1D70C}_{p}d\unicode[STIX]{x1D714}^{2}/\unicode[STIX]{x1D70C}_{1}\ll 1$
following Schulkes et al. (Reference Schulkes, Hosking and Sneyd1987). This assumption simplifies our equations and is physically sensible because the term needs to be small if the elastic plate floats and is thin. Thus, using (2.3) and (3.6), the dispersion relation for the flexural-gravity wave motion in two-layer fluid of finite depth is obtained as
 $$\begin{eqnarray}A_{1}\unicode[STIX]{x1D714}^{4}-B_{1}\unicode[STIX]{x1D714}^{2}+C_{1}=0,\end{eqnarray}$$
where
 $$\begin{eqnarray}\left.\begin{array}{@{}c@{}}A_{1}=s+\coth kh\coth k(H-h),\\ B_{1}=gk[(1-s)\coth kh+A_{2}\{s\coth kh+\coth k(H-h)\}],\\ C_{1}=A_{2}(1-s)g^{2}k^{2},\\ A_{2}=Dk^{4}-Qk^{2}+1,\end{array}\right\}\end{eqnarray}$$
with
 $D=EI/(\unicode[STIX]{x1D70C}_{1}g)$
and
 $Q=N/(\unicode[STIX]{x1D70C}_{1}g)$
. Note that in Schulkes et al. (Reference Schulkes, Hosking and Sneyd1987) compression was not included in their two-layer fluid model. As we shall see shortly, this compression has a number of significant effects.
The dispersion relation (3.9) is a quadratic equation in
 $\unicode[STIX]{x1D714}^{2}$
whose solution yields the wave frequencies in the surface and internal modes and are denoted as
 $\unicode[STIX]{x1D714}_{+}$
and
 $\unicode[STIX]{x1D714}_{-}$
respectively. It is to be noted that
 $\unicode[STIX]{x1D714}_{+}$
corresponds to the mode with the faster phase velocity, compared to
 $\unicode[STIX]{x1D714}_{-}$
which is slower. Generally, the quicker mode has an amplitude ratio,
 $r$
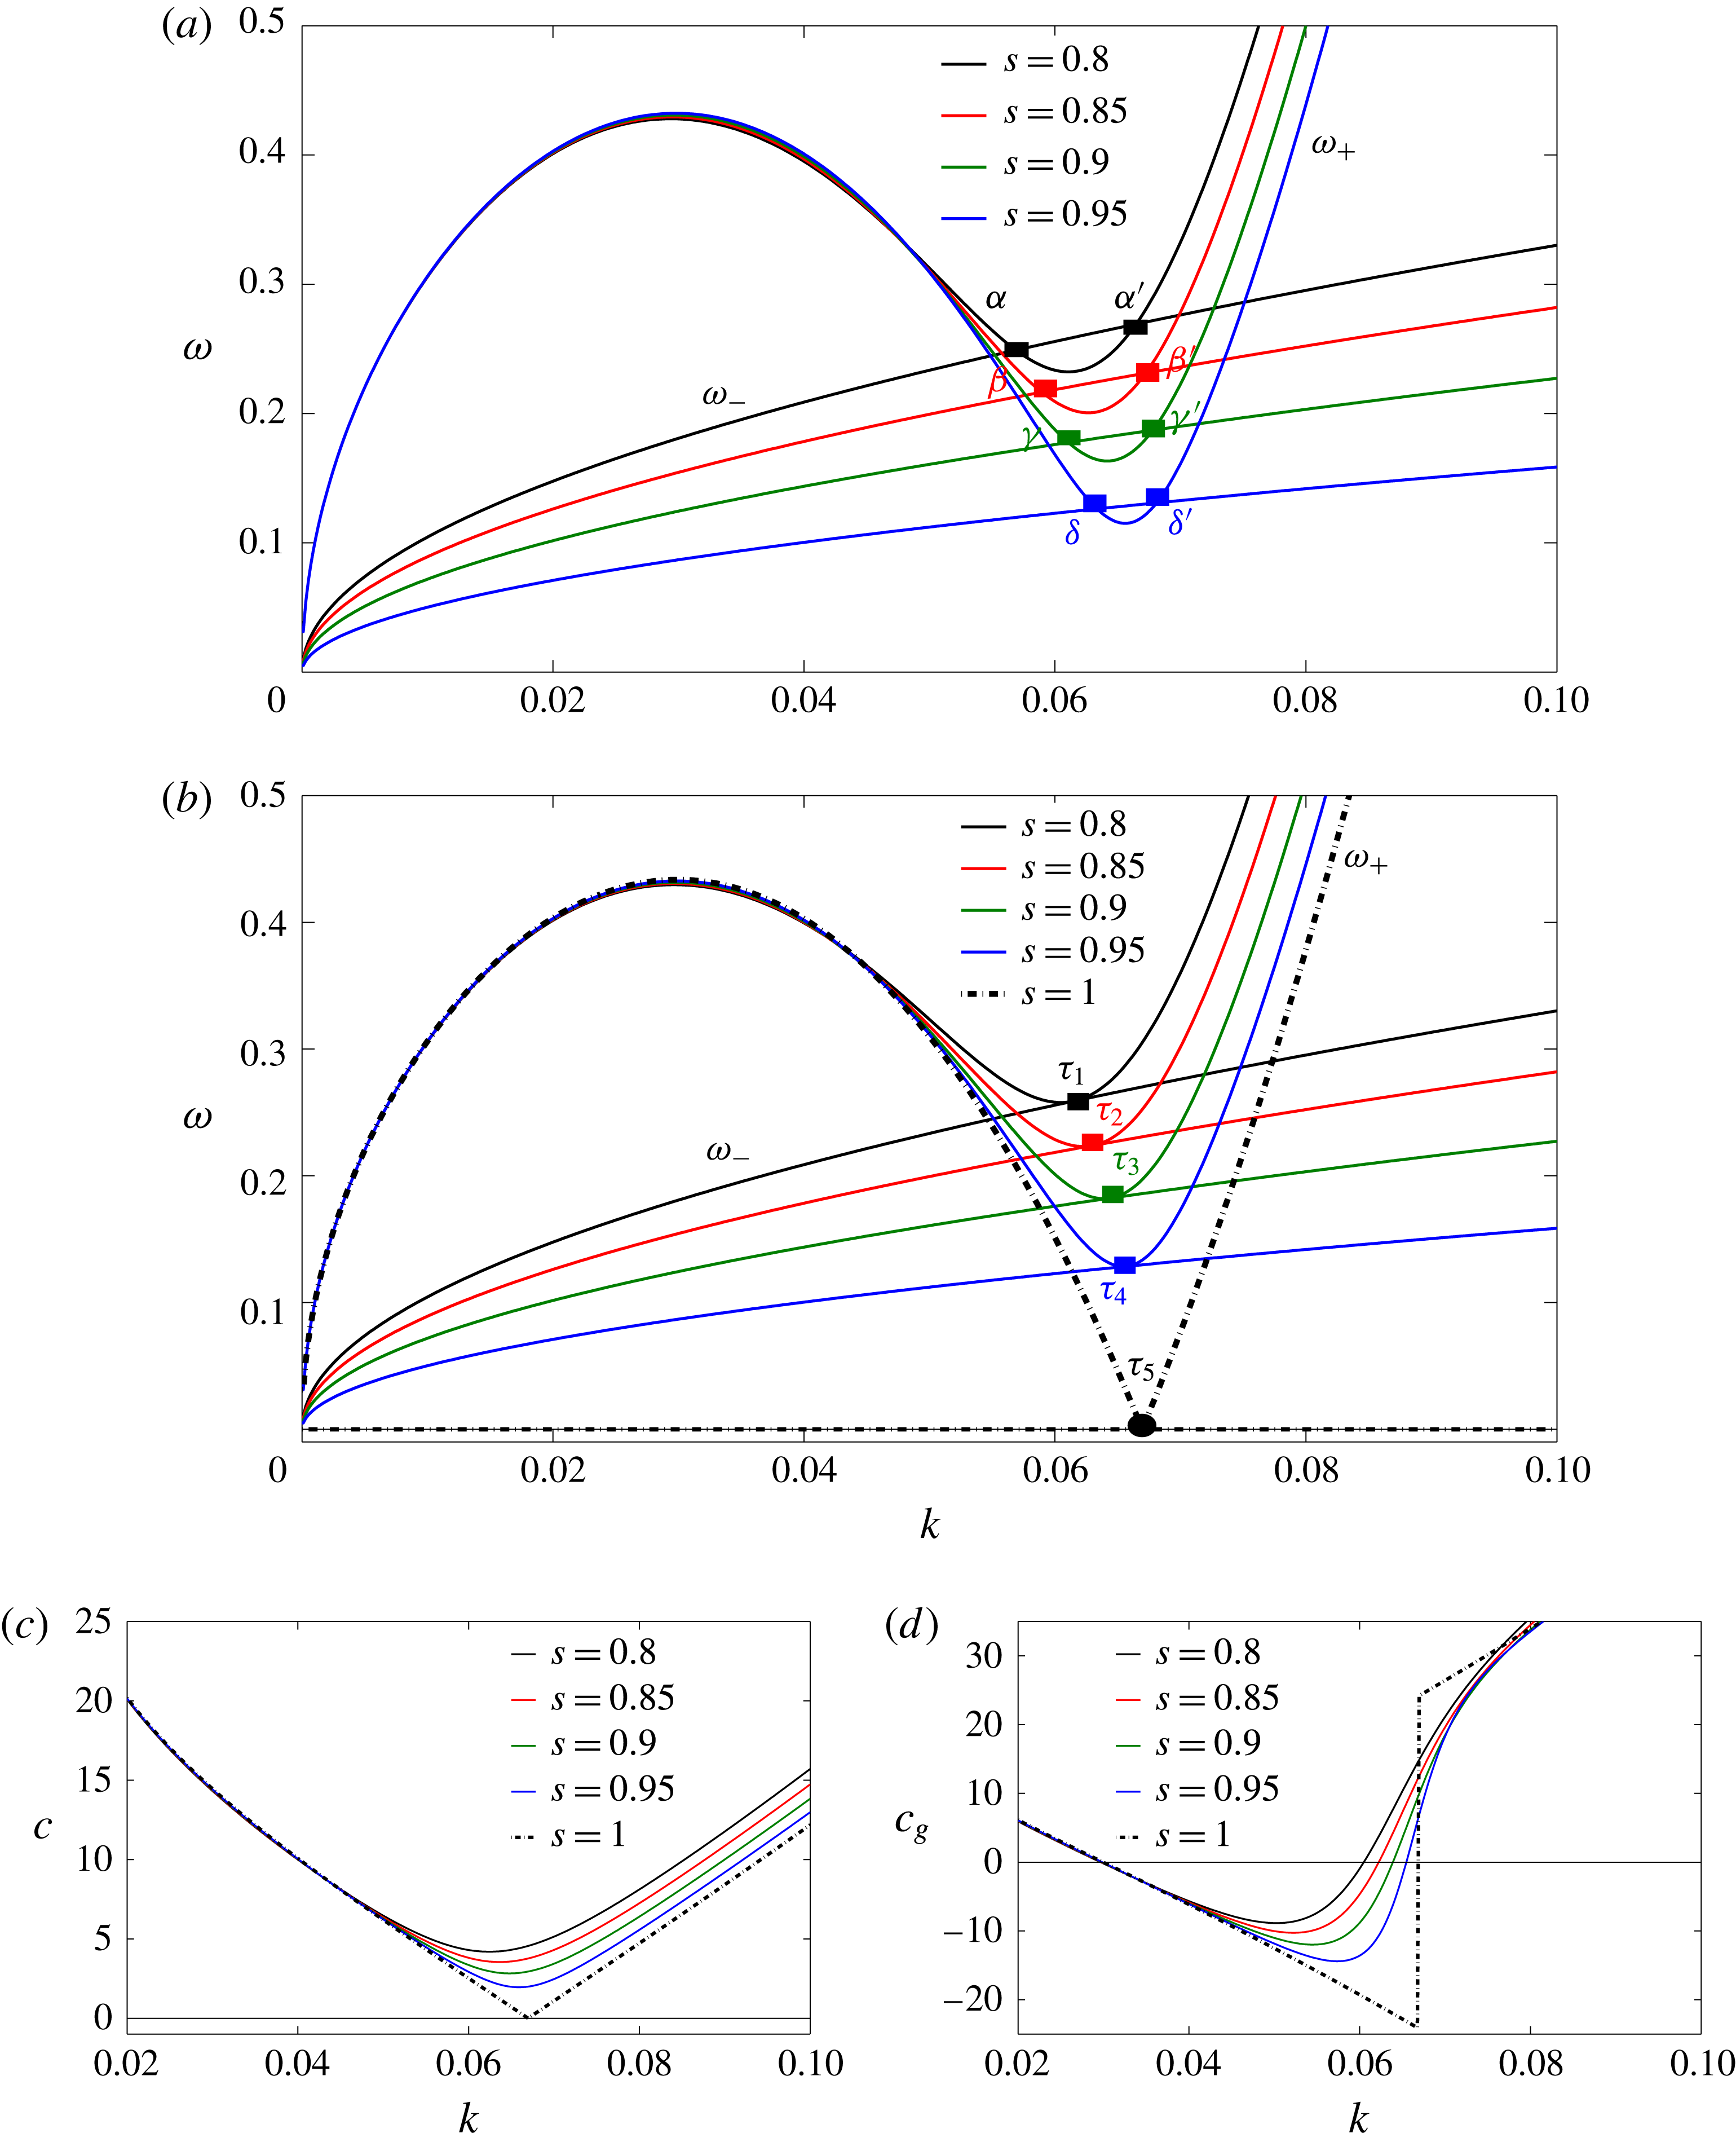
, less than one, which corresponds to a mode with greater amplitude at the surface. The slower mode corresponds to an amplitude ratio which is smaller than the negative one which corresponds to a mode with a higher amplitude at the interface. While this is generally true, there can be a situation where the internal mode (mode with amplitude ratio less than minus one) is faster than the surface mode in the case of the deep water approximation under the condition
 $Q=2\sqrt{2Ds/(1+s)}$
near the secondary blocking point (see the portion
 $\unicode[STIX]{x1D6FC}\unicode[STIX]{x1D6FC}^{\prime }$
in figure 9
a). However, this situation will not arise with a finite upper layer and the shallow water approximation. These observations will be discussed in more detail in the subsequent sections. Thus,
 $$\begin{eqnarray}\unicode[STIX]{x1D714}_{\pm }^{2}=\frac{B_{1}\pm \sqrt{B_{1}^{2}-4A_{1}C_{1}}}{2A_{1}},\end{eqnarray}$$
which yields
 $$\begin{eqnarray}c_{g}^{\pm }=\frac{\displaystyle \unicode[STIX]{x1D714}_{\pm }^{2}\frac{\text{d}B_{1}}{\text{d}k}-\unicode[STIX]{x1D714}_{\pm }^{4}\frac{\text{d}A_{1}}{\text{d}k}-\frac{\text{d}C_{1}}{\text{d}k}}{2\unicode[STIX]{x1D714}_{\pm }(2A_{1}\unicode[STIX]{x1D714}_{\pm }^{2}-B_{1})},\end{eqnarray}$$
where subscripts
 $\pm$
correspond to waves in surface and internal modes respectively. Moreover, following the procedure as in Schulkes et al. (Reference Schulkes, Hosking and Sneyd1987), it can be easily derived that the mean potential energy and mean kinetic energy associated with flexural-gravity wave motion in the presence of a uniform compressive force are equal to each other and the total energy
 $E$
, which is a sum of the mean potential and kinetic energy, given by
 $$\begin{eqnarray}E=\frac{\unicode[STIX]{x1D70C}_{1}}{2}(Dk^{4}-Qk^{2}+g)a_{1}^{2}+\frac{\unicode[STIX]{x1D70C}_{2}}{2}(1-s)a_{2}^{2}.\end{eqnarray}$$
We include this energy here for completeness.
4 Dynamics of waves: special cases
We consider here a number of special cases in which we can make simplifying assumptions.
4.1 Infinite depth lower layer
We consider the case when the upper layer depth is comparable to the wavelength (
 $kh=O(1)$
), but the lower layer water depth is large (
 $k(H-h)\gg 1$
). Under these conditions, the dispersion relation (3.11) is modified to
 $$\begin{eqnarray}\displaystyle & \displaystyle \unicode[STIX]{x1D714}_{+}^{2}=\frac{(Dk^{4}-Qk^{2})(s\coth kh+1)+1+\coth kh}{\coth kh+s}gk, & \displaystyle\end{eqnarray}$$
 $$\begin{eqnarray}\displaystyle & \displaystyle \unicode[STIX]{x1D714}_{-}^{2}=\frac{(1-s)A_{2}gk}{(1+s\coth kh)A_{2}+(1-s)\coth kh}. & \displaystyle\end{eqnarray}$$
The rate at which wave energy propagates is proportional to the group velocity
 $(\text{d}\unicode[STIX]{x1D714}_{\pm }/\text{d}k)$
of the wave train. Hence, wave energy propagation stops when
 $(\text{d}\unicode[STIX]{x1D714}_{\pm }/\text{d}k)=0$
and this phenomenon is referred to as blocking.
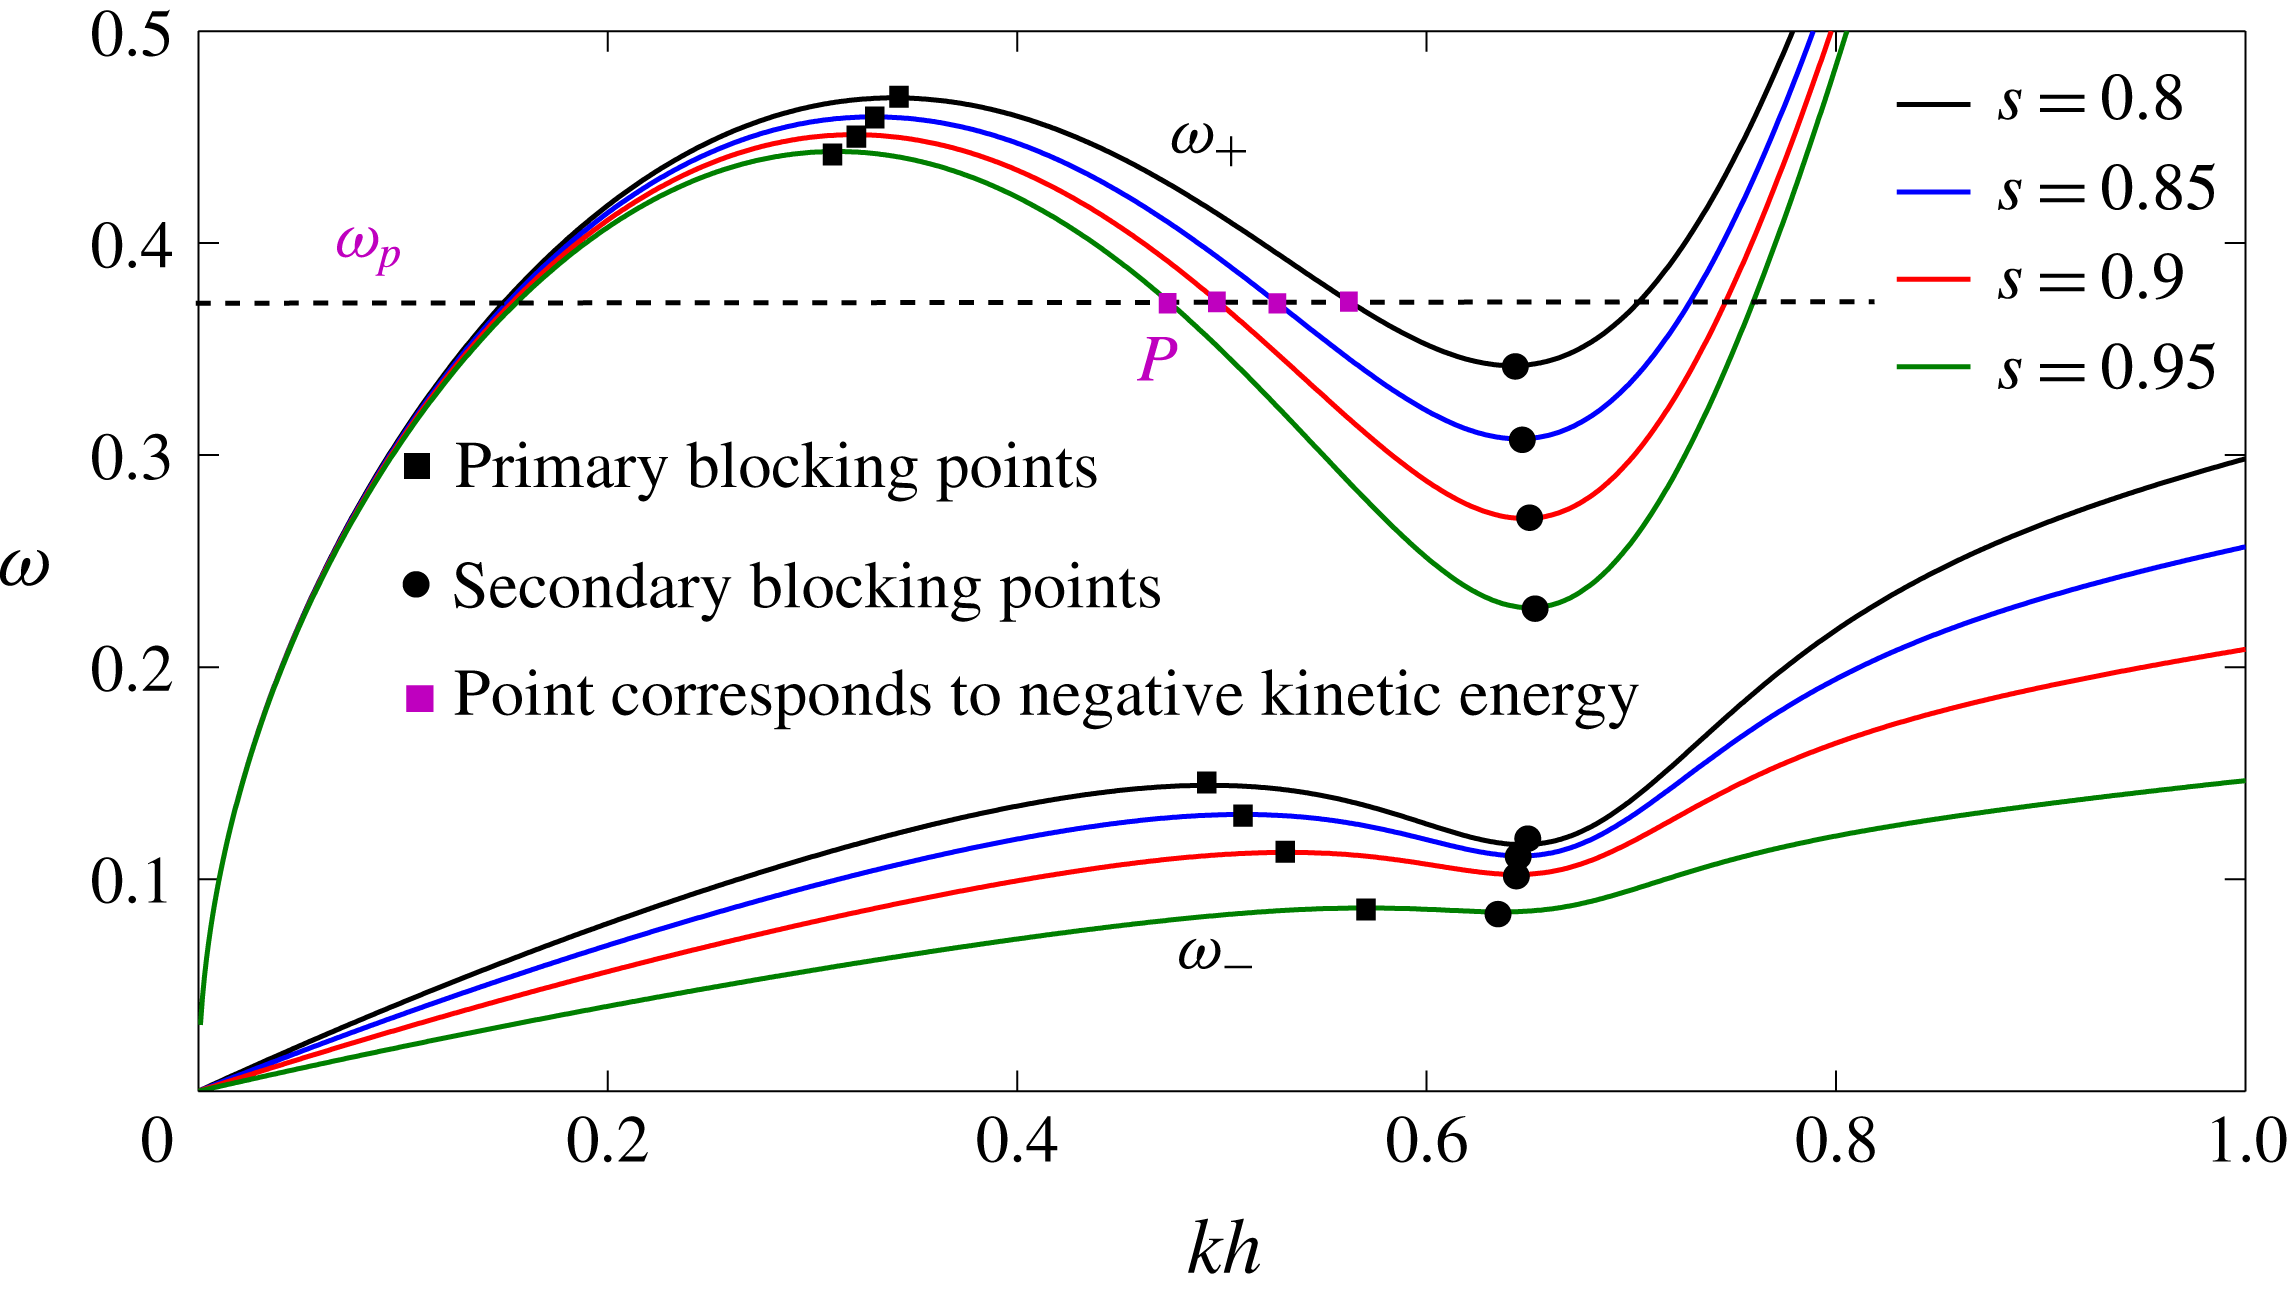
Dispersion graphs for both waves at the surface and at the interface for an infinite lower layer for different values of the density ratio
 $s$
with
 $Q/\sqrt{D}=1.95$
and
 $h=10$
. Wave blocking, characterized by the occurrences of maxima and minima, is observed in both the modes. Solid black squares correspond to primary blocking, whereas solid black circles correspond to secondary blocking. When the density ratio
 $s$
increases, i.e. the difference of the densities is small, the slope of the dispersion curve for the surface wave (the movement of the point
 $P$
along the dispersion curves for different values of density and for fixed incoming wave frequency
 $\unicode[STIX]{x1D714}_{p}$
) in between the two blocking points increases, whereas a reverse pattern is observed for waves in the internal mode. This results in a higher rate of negative kinetic energy propagation for the surface waves.

The dispersion graph is plotted in figure 2 for four different values of density ratio
 $s$
with
 $Q/\sqrt{D}=1.95$
and
 $h=10$
being kept fixed. The choice of
 $Q/\sqrt{D}$
is made to give a high value that is below the critical value of
 $Q/\sqrt{D}=2$
, which is the buckling limit (Schulkes et al.
Reference Schulkes, Hosking and Sneyd1987; Åkesson Reference Åkesson2007; Chryssanthopoulos Reference Chryssanthopoulos2009). The condition for blocking ensures that the points of blocking are the points of maxima and minima, and are readily observed in the figure. The black squares correspond to primary blocking where incident waves are blocked, whereas the secondary blocking points are marked with black circles at which the negative energy waves are blocked. Furthermore, wave blocking is observed in internal mode too, and the occurrences of primary and secondary blocking are illustrated respectively with squares and circles. It is interesting that with an increase of
 $s$
, i.e. when the layer densities are close to each other, for the surface mode the negative energy propagation rate increases. This can be interpreted from the increasing slope of the curves at the point
 $P$
as it moves along the dispersion curves (the locus of
 $P$
is shown by pink squares) with an increase in
 $s$
. However, a reverse pattern is observed from the dispersion curve corresponding to the internal modes. This observation provides the possibility for the transfer of negative kinetic energy from the internal mode to the surface mode as the density difference decreases, i.e. as
 $s$
increases.
For the waves in the surface mode, the condition for wave blocking yields the following expression for the compressive force:
 $$\begin{eqnarray}Q=\frac{\{5pr-kh(1-s^{2})(1-\coth ^{2}kh)\}Dk^{4}+qr-kh(1-s)(1-\coth ^{2}kh)}{k^{2}\{3pr-kh(1-s^{2})(1-\coth ^{2}kh)\}},\end{eqnarray}$$
where
 $p=s\coth kh+1$
,
 $q=1+\coth kh$
and
 $r=s+\coth kh$
.
Substituting the above expression into (4.1), the following relation between the blocking frequency and the wavenumber is obtained:
 $$\begin{eqnarray}\unicode[STIX]{x1D714}_{+}^{b}=\sqrt{\frac{2pq-kh(1-s)(1-\coth ^{2}kh)-2p^{2}Dk^{4}}{3pr-kh(1-s^{2})(1-\coth ^{2}kh)}gk}.\end{eqnarray}$$
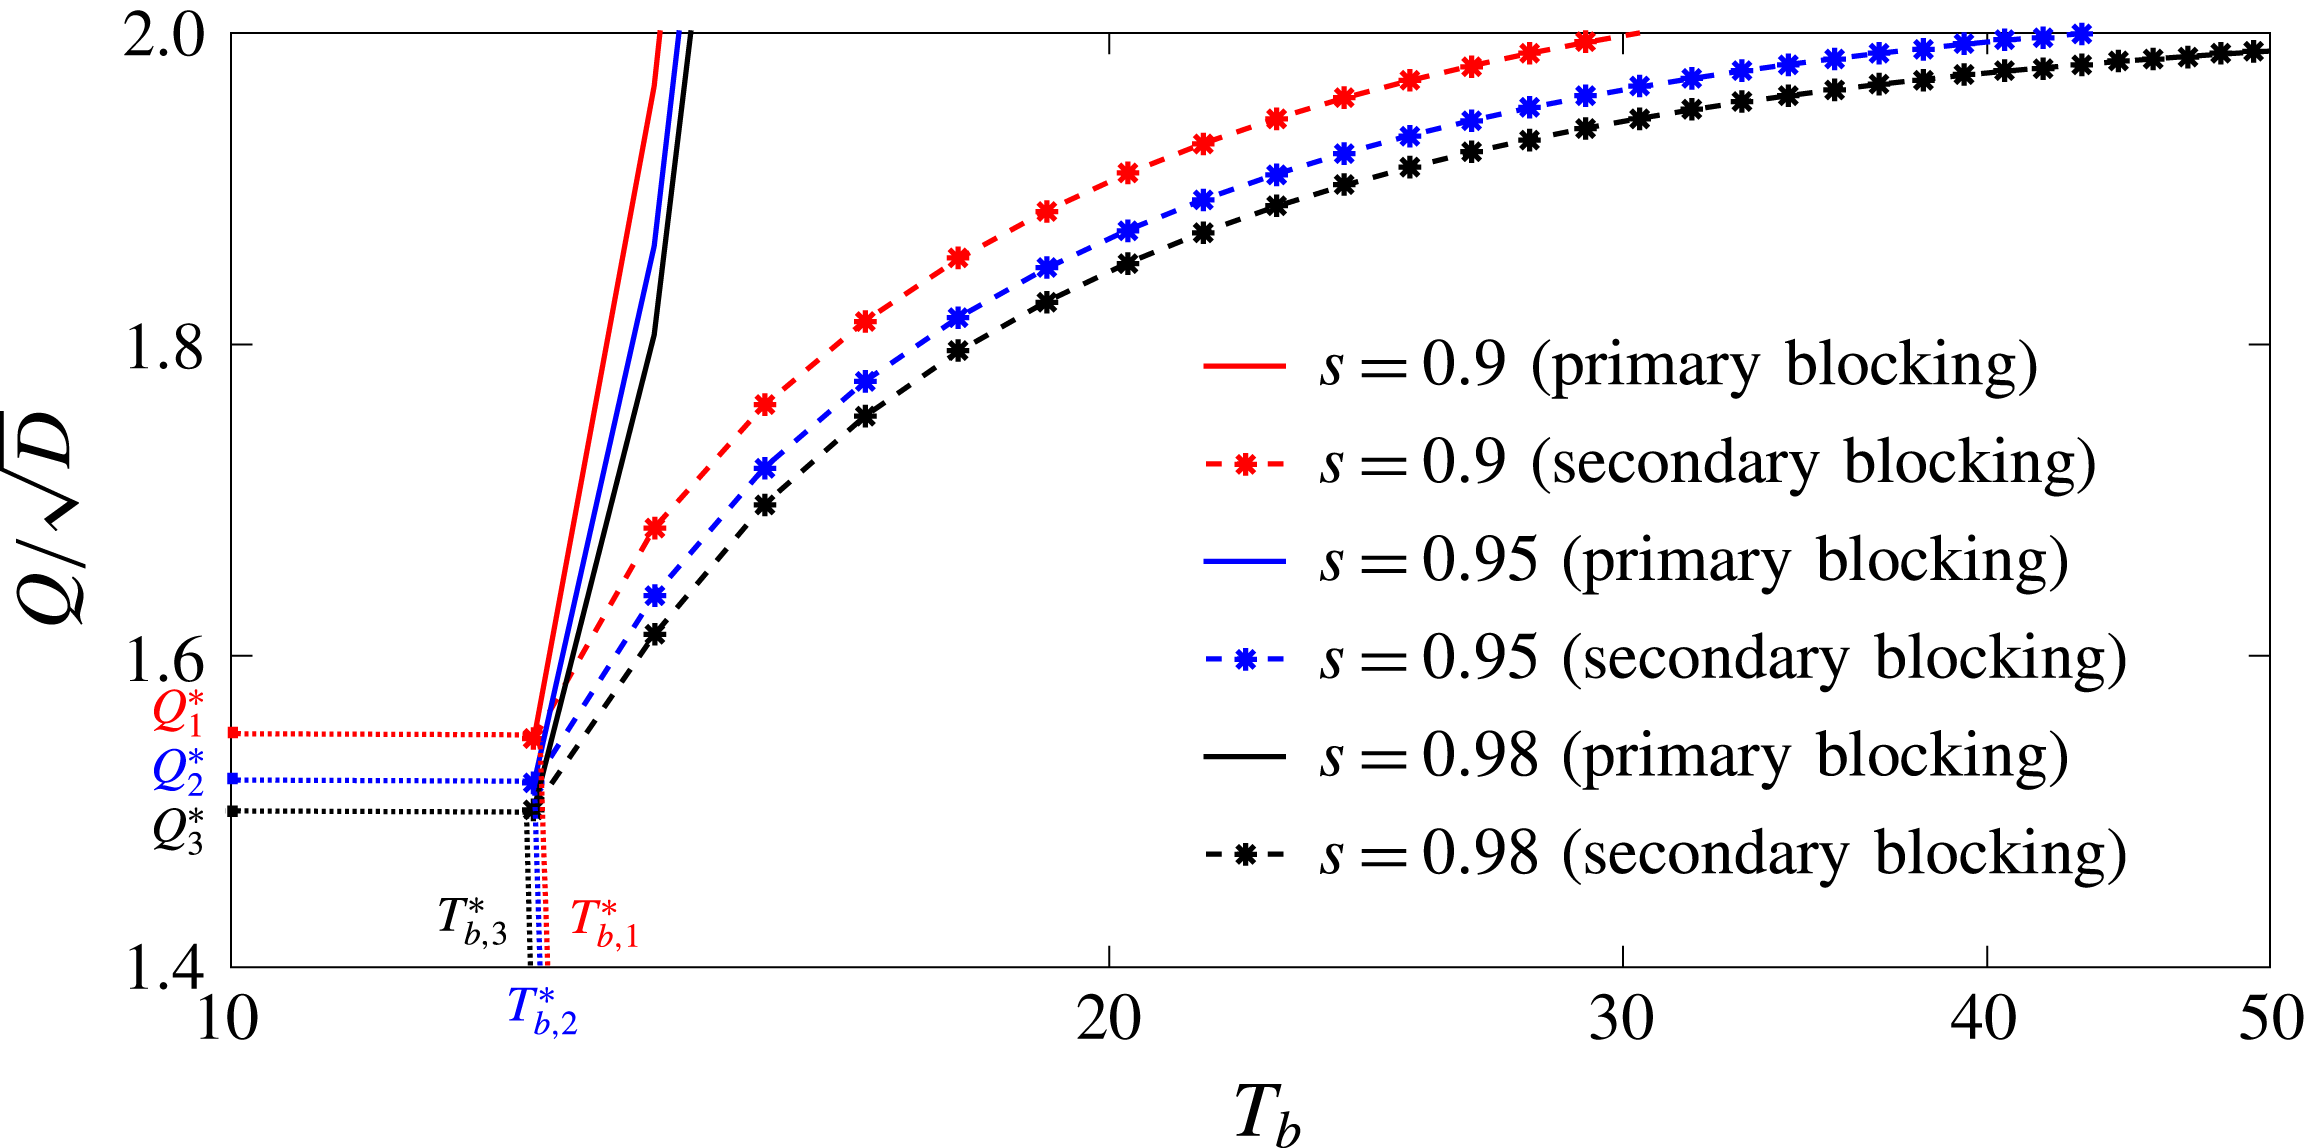
Dependency between the compressive force and the time period of blocked surface waves for different values of the density ratio. Solid lines correspond to primary blocking (related to the incident wave) and dot-dashed lines are for the secondary blocking (related to waves with negative kinetic energy). Points of inflexion where wave blocking initiates are represented by the points
 $(Q_{1}^{\ast },T_{b,1}^{\ast }),(Q_{2}^{\ast },T_{b,2}^{\ast })$
and
 $(Q_{3}^{\ast },T_{b,3}^{\ast })$
for
 $s=0.9,0.95$
and
 $0.98$
, respectively. The points on the curves represent the compressive force required to block a wave of specific time period. However, waves having a time period less than
 $T_{b}^{\ast }$
are never blocked by the action of a compressive force. Also, depending upon the density ratio, a minimum compressive force is required to achieve wave blocking, e.g.
 $Q_{3}^{\ast }$
for
 $s=0.9$
. However, the time period of the incident waves remain almost the same.

It is to be noted that (4.4) provides two different solutions for the wavenumber
 $k$
, one for the primary and the other for the secondary blocking, for a fixed value of
 $\unicode[STIX]{x1D714}_{+}^{b}$
. Consequently, the corresponding compressive force can readily be obtained from (4.3). The blocking period
 $T_{b}$
is given by
 $T_{b}=2\unicode[STIX]{x03C0}/\unicode[STIX]{x1D714}_{+}^{b}$
.
The dependency between the compressive force and
 $T_{b}$
is shown in figure 3 for three different values of density ratio
 $s$
. The solid lines are for the primary blocking points at which the incident waves are blocked, whereas the dot-dashed lines correspond to secondary blocking points at which the waves with negative kinetic energy are blocked. Any point on the graphs demonstrates a specific value of compressive force which is required to block a wave of the corresponding time period. Now, the points where both the blocking points merge is known as the point of inflexion, and we denote this point
 $(Q^{\ast },T_{b}^{\ast })$
. Consequently, it follows that any wave which has a period less than
 $T_{b}^{\ast }$
cannot be blocked by any compressive force. It is interesting to observe that the incident wave period at which the wave blocking initiates is almost invariant with respect to the density ratio. For
 $s=0.9$
, the minimum compressive force required to block any flexural-gravity wave is denoted
 $Q_{1}^{\ast }$
. Similar values of compressive forces for
 $s=0.95,0.98$
are respectively denoted by
 $Q_{2}^{\ast }$
and
 $Q_{3}^{\ast }$
. Higher compressive force is required to block flexural-gravity waves when the density ratio reduces.
For the waves in the internal mode, the condition for wave blocking provides the following relation between the wave frequency and the wavenumber:
 $$\begin{eqnarray}\unicode[STIX]{x1D714}_{b}^{-}=\sqrt{\frac{-\hat{B}+\sqrt{\hat{B}^{2}-4\hat{A}{\hat{C}}}}{2\hat{A}}},\end{eqnarray}$$
where
 $$\begin{eqnarray}\left.\begin{array}{@{}c@{}}\hat{A}=2(Dk^{4}-1)(1+s\coth kh)^{2}-(1-s)\{\unicode[STIX]{x1D70F}+(1+2s\coth kh)\coth kh\},\\ \hat{B}=gk(1-s)\{(1-s)(\unicode[STIX]{x1D70F}+2\coth kh)-4(Dk^{4}-1)(1+s\coth kh)\},\\ {\hat{C}}=2g^{2}k^{2}(1-s)^{2}(Dk^{4}-1),\\ \unicode[STIX]{x1D70F}=\coth kh-kh(1-\coth ^{2}kh),\end{array}\right\}\end{eqnarray}$$
and the corresponding compressive force is calculated from the following relation:
 $$\begin{eqnarray}(Dk^{4}-Qk^{2}+1)^{2}+\frac{(1-s)\unicode[STIX]{x1D70F}}{(1+s\unicode[STIX]{x1D70F})}(Dk^{4}-Qk^{2}+1)+2\frac{(1-s)}{(1+s\unicode[STIX]{x1D70F})}(Dk^{4}-1)\coth kh=0.\end{eqnarray}$$
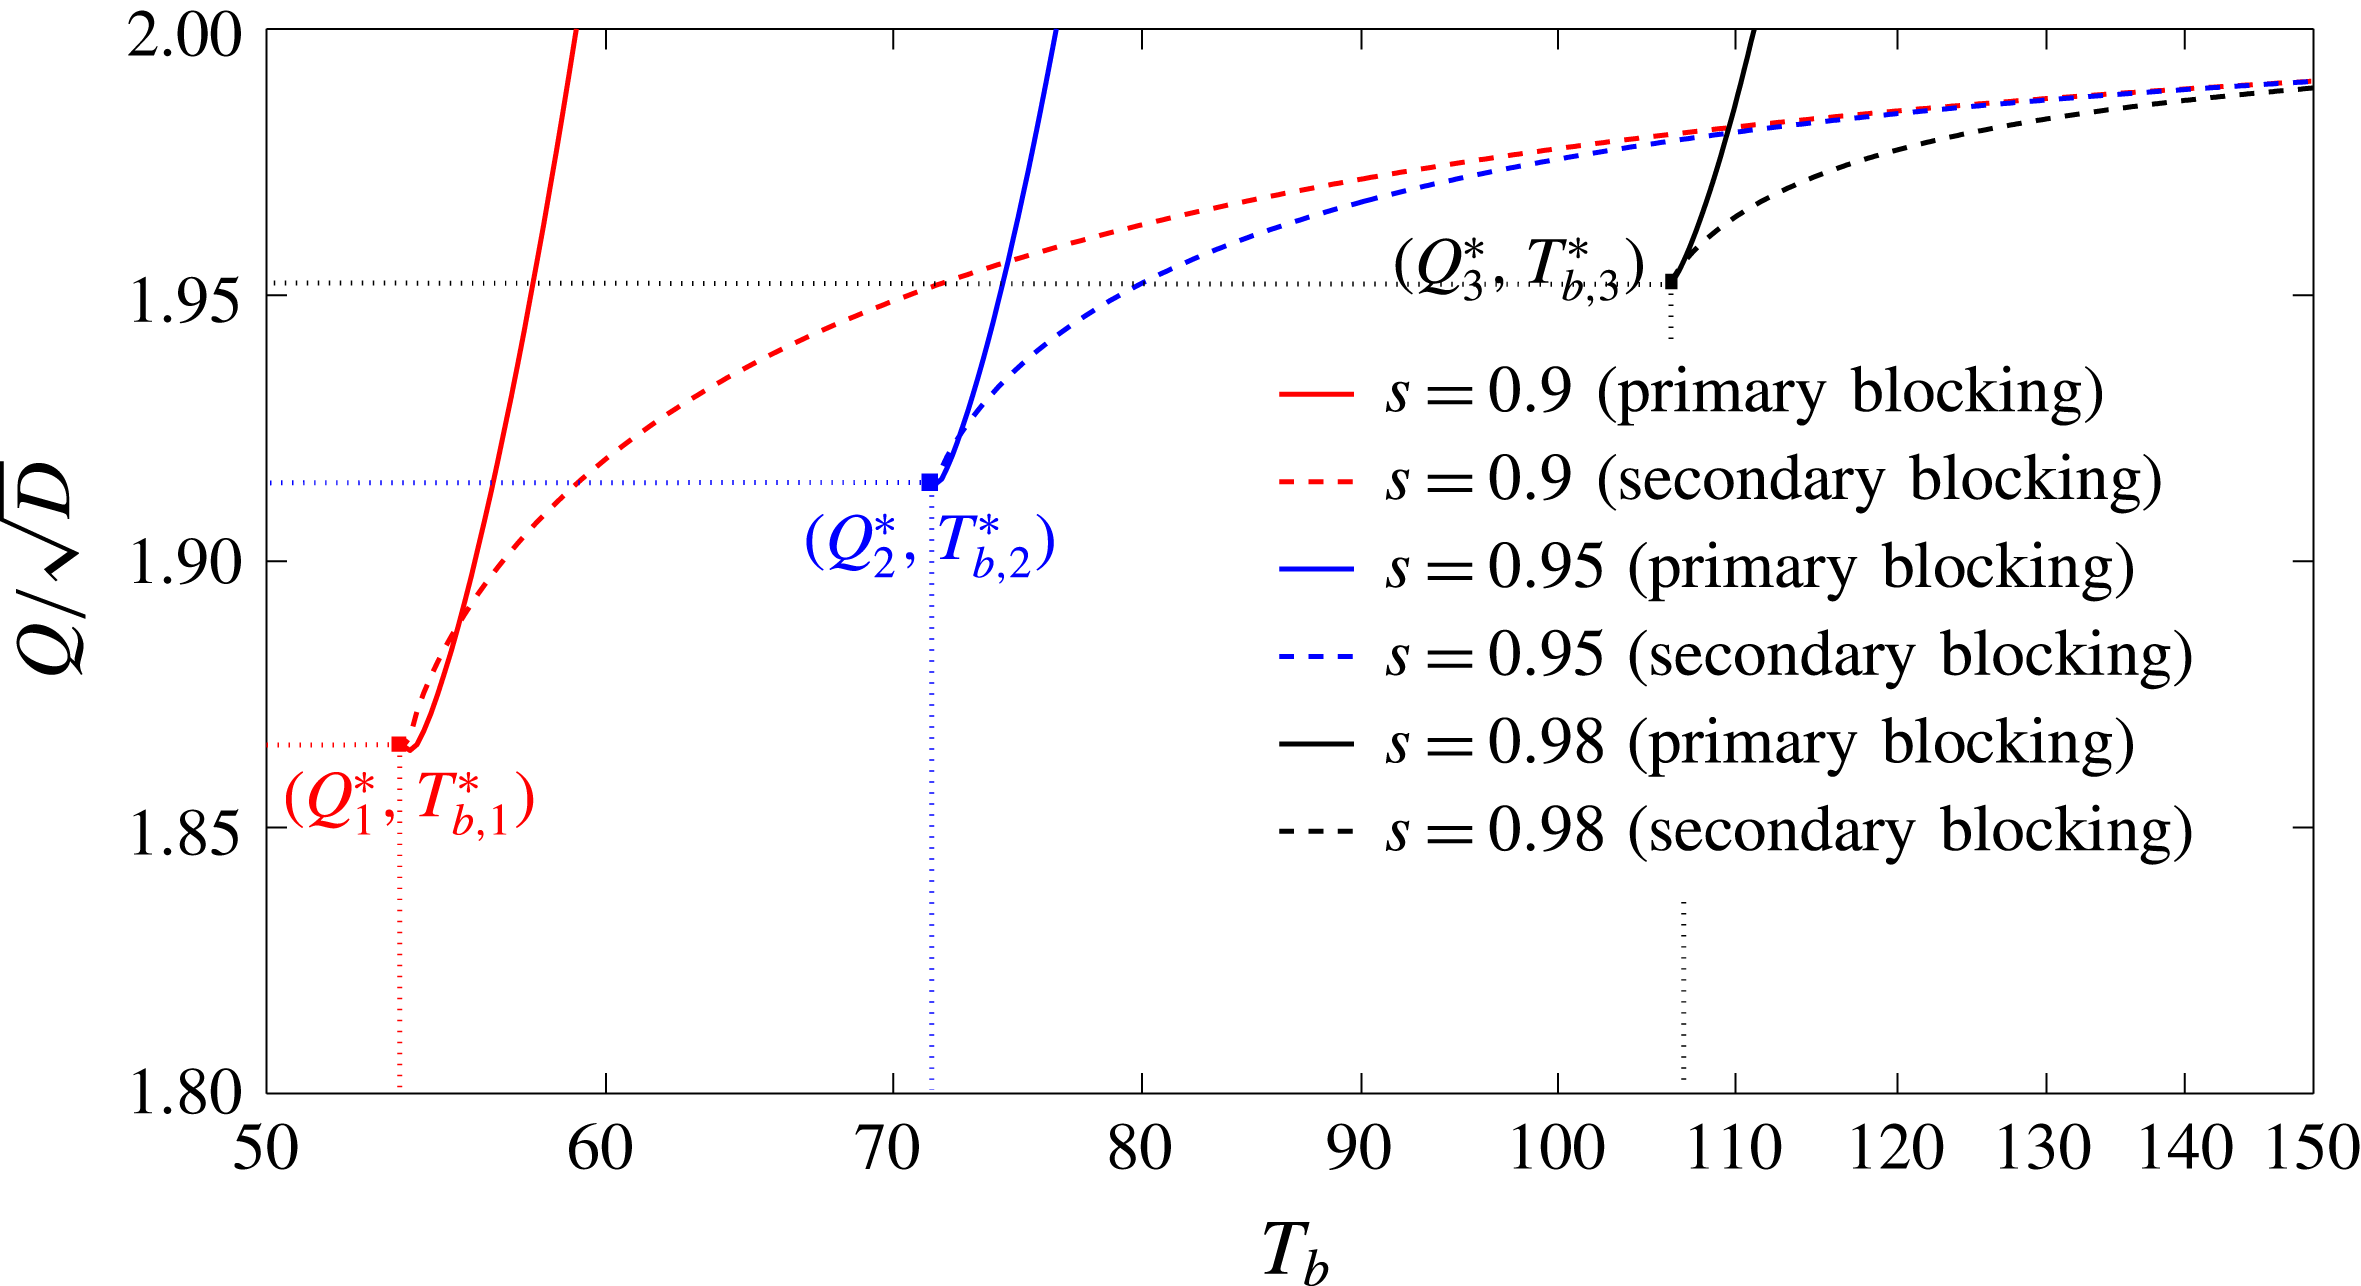
The dependency between the time period and the compressive force is illustrated in figure 4. The pattern of the graphs is very similar to those obtained in figure 3. However, it is to be noted that when the layer densities are very close to each other, wave blocking occurs in the presence of a relatively higher compressive force for waves having higher time period. The same can easily be observed for the graph corresponding to
 $s=0.98$
in which
 $Q_{3}^{\ast }$
, the minimum compressive force required to block the waves, is quite high compared to
 $Q_{1}^{\ast }$
(for
 $s=0.9$
) and
 $Q_{2}^{\ast }$
(for
 $s=0.95$
). Similarly, the corresponding time period
 $T_{b,3}^{\ast }$
of the blocked waves for
 $s=0.98$
is higher than that for
 $s=0.9$
(
 $T_{b,1}^{\ast }$
) and
 $0.95$
(
 $T_{b,2}^{\ast }$
).
The internal wave time period and the compressive force for different values of the density ratio for an infinite lower layer. The pattern is similar to figure 3. A higher density ratio requires a higher compressive force to initiate blocking for waves with a higher time period. The compressive force
 $Q_{3}^{\ast }$
corresponding to a point of inflexion for waves in a stratified fluid having density ratio
 $s=0.98$
is higher than
 $Q_{2}^{\ast }$
(for
 $s=0.95$
) and
 $Q_{1}^{\ast }$
(for
 $s=0.9$
). The corresponding time period
 $T_{b,3}^{\ast }$
is also higher than
 $T_{b,2}^{\ast }$
and
 $T_{b,1}^{\ast }$
. Interestingly, for a fixed value of
 $s$
, the curves intersect before the point of inflexion, and this suggests that at the same value of compressive force, waves with the same frequency go through both primary and secondary blocking but at different wavenumbers.

4.2 Shallow upper layer and infinite lower layer depth
We assume here a shallow upper layer depth, i.e.
 $|k|h\ll 1$
and an infinite lower layer depth, i.e.
 $k(H-h)\gg 1$
. Under these assumptions, equation (3.11) is modified to
 $$\begin{eqnarray}\displaystyle & \displaystyle \unicode[STIX]{x1D714}_{+}^{2}=\frac{(Dk^{4}-Qk^{2})(s+kh)+1+kh}{1+skh}gk, & \displaystyle\end{eqnarray}$$
 $$\begin{eqnarray}\displaystyle & \displaystyle \unicode[STIX]{x1D714}_{-}^{2}=\frac{(1-s)A_{2}gk^{2}h}{(kh+s)A_{2}+(1-s)}. & \displaystyle\end{eqnarray}$$
The compressive force for which wave blocking occurs is obtained as
 $$\begin{eqnarray}Q=\frac{\{5p^{\prime }r^{\prime }-kh(1-s^{2})(k^{2}h^{2}-1)\}Dk^{4}+q^{\prime }r^{\prime }-kh(1-s)(k^{2}h^{2}-1)}{k^{2}\{3p^{\prime }r^{\prime }-kh(1-s^{2})(k^{2}h^{2}-1)\}},\end{eqnarray}$$
where
 $p^{\prime }=s+kh$
,
 $q^{\prime }=1+kh$
and
 $r=1+skh$
.
Substituting the above expression into (4.8) and (4.9) respectively, the following relations between the blocking frequency and the wavenumber are obtained:
 $$\begin{eqnarray}\displaystyle & \displaystyle \unicode[STIX]{x1D714}_{+}^{b}=\sqrt{\frac{2p^{\prime }q^{\prime }-kh(1-s)(k^{2}h^{2}-1)-2{p^{\prime }}^{2}Dk^{4}}{3p^{\prime }r^{\prime }-kh(1-s^{2})(k^{2}h^{2}-1)}gk}, & \displaystyle\end{eqnarray}$$
 $$\begin{eqnarray}\displaystyle & \displaystyle \unicode[STIX]{x1D714}_{b}^{-}=kh\sqrt{\frac{-\bar{B}+\sqrt{\bar{B}^{2}-4\bar{A}\bar{C}}}{2\bar{A}}}, & \displaystyle\end{eqnarray}$$
where
 $$\begin{eqnarray}\displaystyle & \displaystyle \bar{A}=2(Dk^{4}-1)(kh+s)^{2}-(1-s)\{3kh-k^{3}h^{3}+2s\}, & \displaystyle\end{eqnarray}$$
 $$\begin{eqnarray}\displaystyle & \displaystyle \bar{B}=\frac{g(1-s)}{h}\{(1-s)(4-k^{2}h^{2})-4(Dk^{4}-1)(s+kh)\}, & \displaystyle\end{eqnarray}$$
 $$\begin{eqnarray}\displaystyle & \displaystyle {\hat{C}}=\frac{2g^{2}}{h^{2}}(1-s)^{2}(Dk^{4}-1). & \displaystyle\end{eqnarray}$$
4.3 Shallow water approximation
We now assume that both of the layers are shallow, i.e. for
 $|k|h\ll 1$
and
 $|k|(H-h)\ll 1$
, so that (3.9) yields
 $$\begin{eqnarray}\unicode[STIX]{x1D714}_{\pm }^{2}=\{\unicode[STIX]{x1D6FD}\pm \sqrt{\unicode[STIX]{x1D6FD}^{2}-4\unicode[STIX]{x1D6FF}}\}/2,\end{eqnarray}$$
where
 $$\begin{eqnarray}\unicode[STIX]{x1D6FD}=gk^{2}[(1-s+A_{2}s)(H-h)+A_{2}h],\quad \text{and}\quad \unicode[STIX]{x1D6FF}=(1-s)h(H-h)A_{2}g^{2}k^{4}.\quad\end{eqnarray}$$
Equation (4.16) reveals that the angular frequencies in the surface and the internal modes will coalesce only if
 $\unicode[STIX]{x1D6FD}^{2}-4\unicode[STIX]{x1D6FF}=0$
, which yields
 $$\begin{eqnarray}A_{2}=\left(\frac{h}{2h_{p}}-1\right)\left[\left(\frac{2h}{h_{p}}-1\right)\pm 2\sqrt{\frac{h}{h_{p}}\left(\frac{h}{h_{p}}-1\right)}\right],\end{eqnarray}$$
with
 $h_{p}=sH+(1-s)h$
. Under the condition
 $0<s<1$
, the quantity
 $h/h_{p}$
becomes less than
 $1$
and consequently
 $A_{2}$
becomes a complex number. This implies that the wave frequencies of the surface and the internal modes in the two-layer fluid will never coalesce under the shallow water approximation. For the existence of a real
 $A_{2}$
, the interface has to coincide with the bottom bed, i.e.
 $h_{p}=h$
. Under such a circumstance, the physical problem will be converted to that of flexural-gravity wave motion in a homogeneous fluid.
(a) Wave frequencies of the surface and the internal modes with
 $h=5~\text{m}$
and
 $Q=1.95\sqrt{D}$
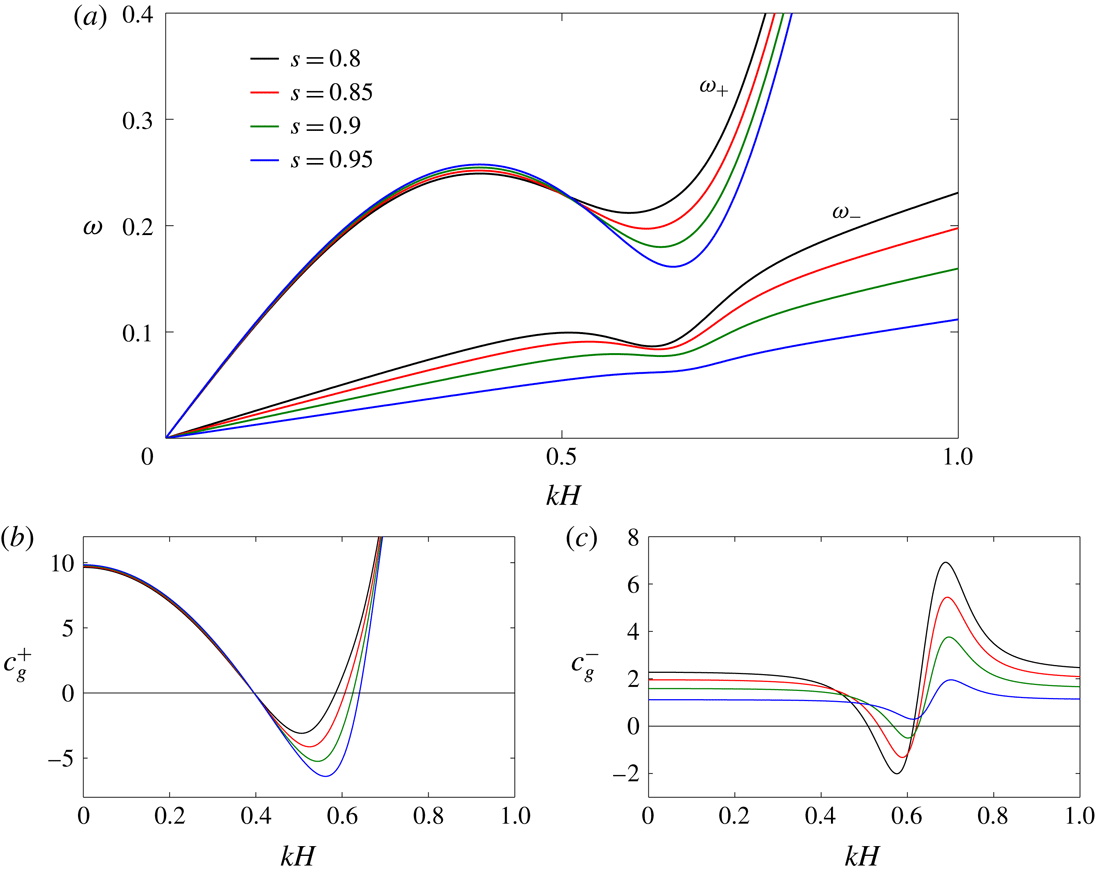
for various values of the density ratio. Here, both the upper and lower layers are shallow. (b,c) The corresponding group velocities of the surface and the internal modes, respectively. Occurrences of wave blocking (zero group velocity) and propagation of waves with negative energy (negative group velocity) in both the modes are illustrated.

Wave frequencies of the surface and the internal modes in shallow water with
 $s=0.8$
for various values of
 $h/H$
and
 $Q$
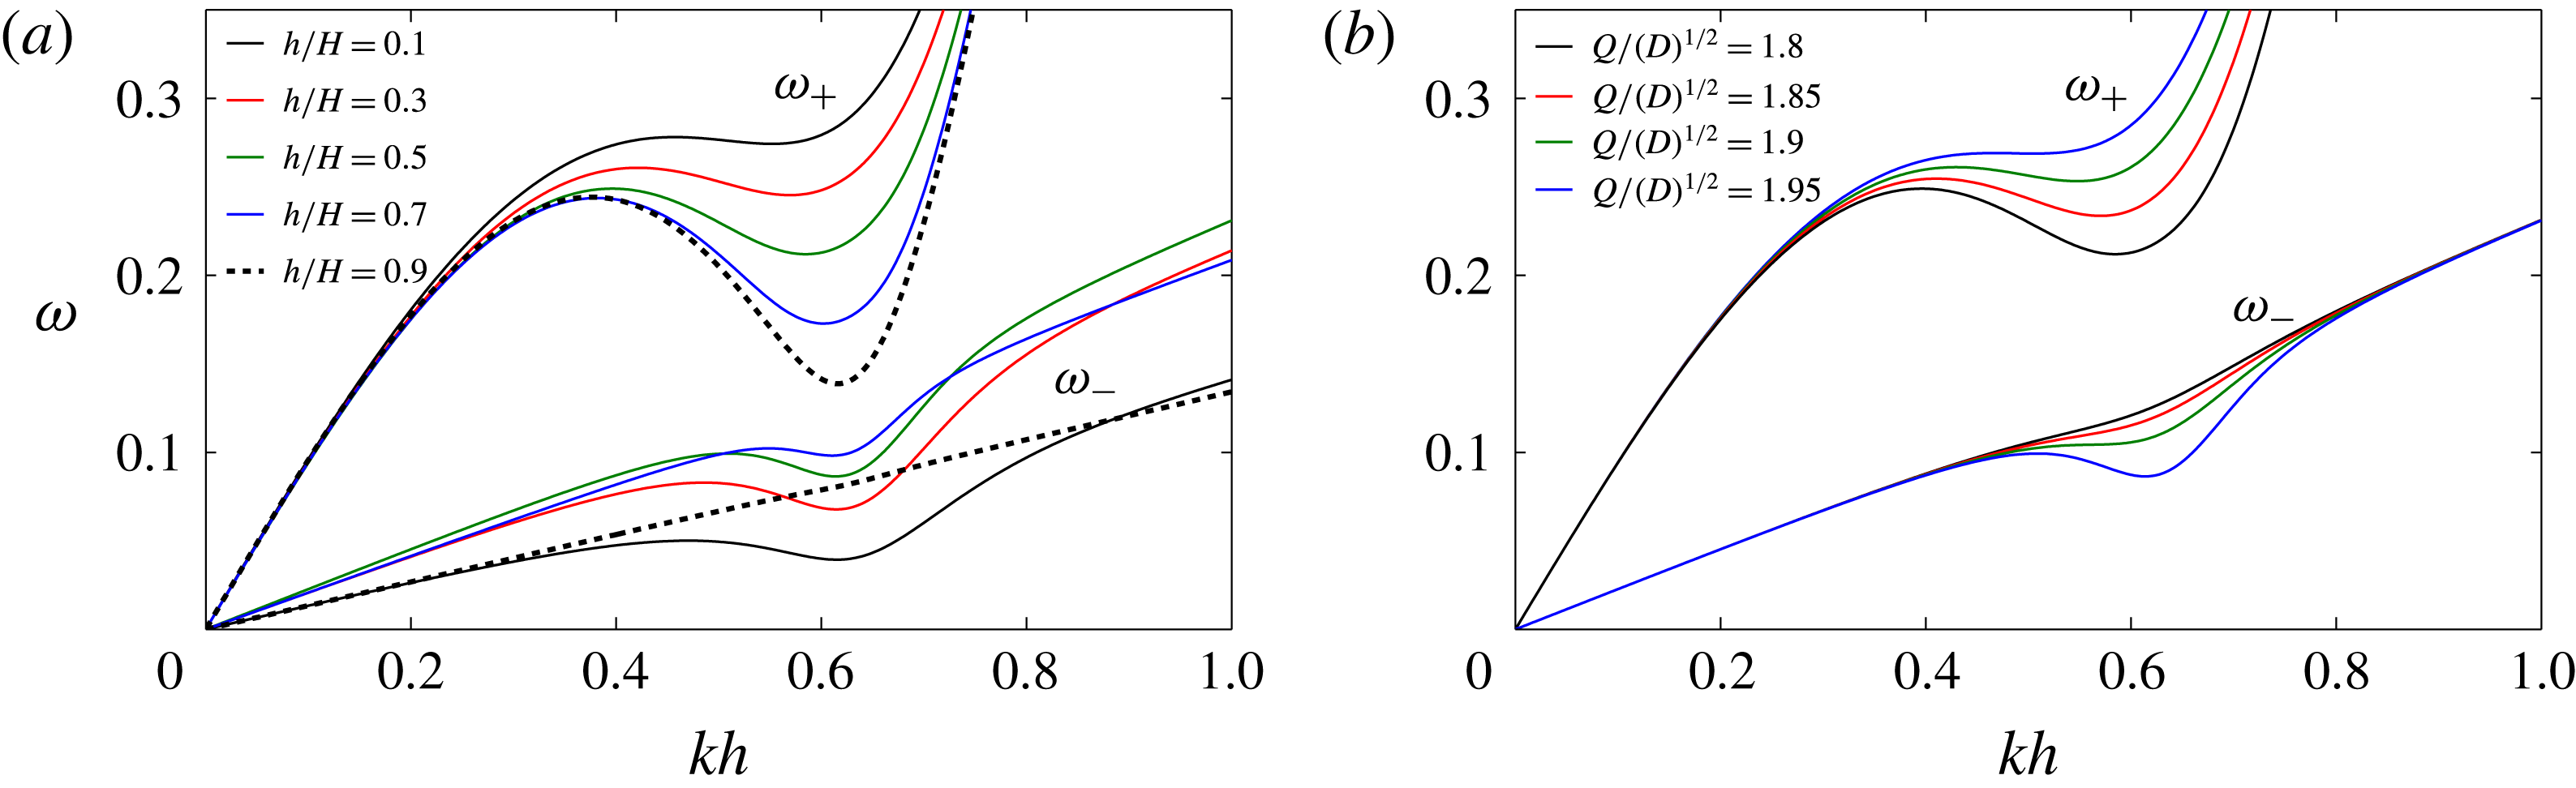
. Wave blocking is observed from the local optima (maximum for primary blocking and minimum for secondary blocking) of the graphs. Waves with negative energy (negative slope of the graph) propagate in between. (a) For various values of
 $h/H$
with
 $Q=1.95\sqrt{D}$
and
 $H=10~\text{m}$
. (b) For various values of
 $Q$
with
 $h=5~\text{m}$
and
 $H=10~\text{m}$
.

Figure 5 shows that, under the shallow water approximation, for a suitable choice of compressive force and density ratio, blocking occurs for flexural-gravity waves in the surface and the internal modes. Thus, the dispersion relations in both the surface and the internal modes can have at most three positive and three negative roots. Further, wave blocking in the internal mode is more prominent when the difference in densities between the two layers is large. From (4.16), group velocities,
 $c_{g}^{+}$
and
 $c_{g}^{-}$
of the surface and the internal modes respectively, are obtained as
 $$\begin{eqnarray}c_{g}^{\pm }=gk\frac{\unicode[STIX]{x1D714}_{\pm }^{2}(H-h_{p}+h_{p}A_{3})-h(H-h_{p})gk^{2}A_{4}}{\unicode[STIX]{x1D714}_{\pm }(2\unicode[STIX]{x1D714}_{\pm }^{2}-\unicode[STIX]{x1D6FD})},\end{eqnarray}$$
with
 $$\begin{eqnarray}A_{3}=3Dk^{4}-2Qk^{2}+1,\end{eqnarray}$$
and
 $$\begin{eqnarray}A_{4}=4Dk^{4}-3Qk^{2}+2.\end{eqnarray}$$
Figure 6(a) reveals that, when the interface position is close to the impermeable bottom, wave blocking does not take place in the internal mode, which is due to the negligible effect of the compressive force on the waves in the internal mode. However, the pattern of
 $\unicode[STIX]{x1D714}_{+}$
and
 $\unicode[STIX]{x1D714}_{-}$
in figure 6(a) reveals that, when the interface is close to the free surface, the absolute value of the group velocity of the surface mode will decrease, while the reverse trend is observed for waves in the internal mode between the two blocking points. On the other hand, figure 6(b) reveals that when the interface location is fixed at
 $h/H=0.5$
, blocking of the surface and the internal modes is predominant when the compressive force lies in the range
 $Q_{cg}<Q<Q_{c}$
with
 $Q_{cg}$
and
 $Q_{c}$
defined in the same manner as in the case of deep water.
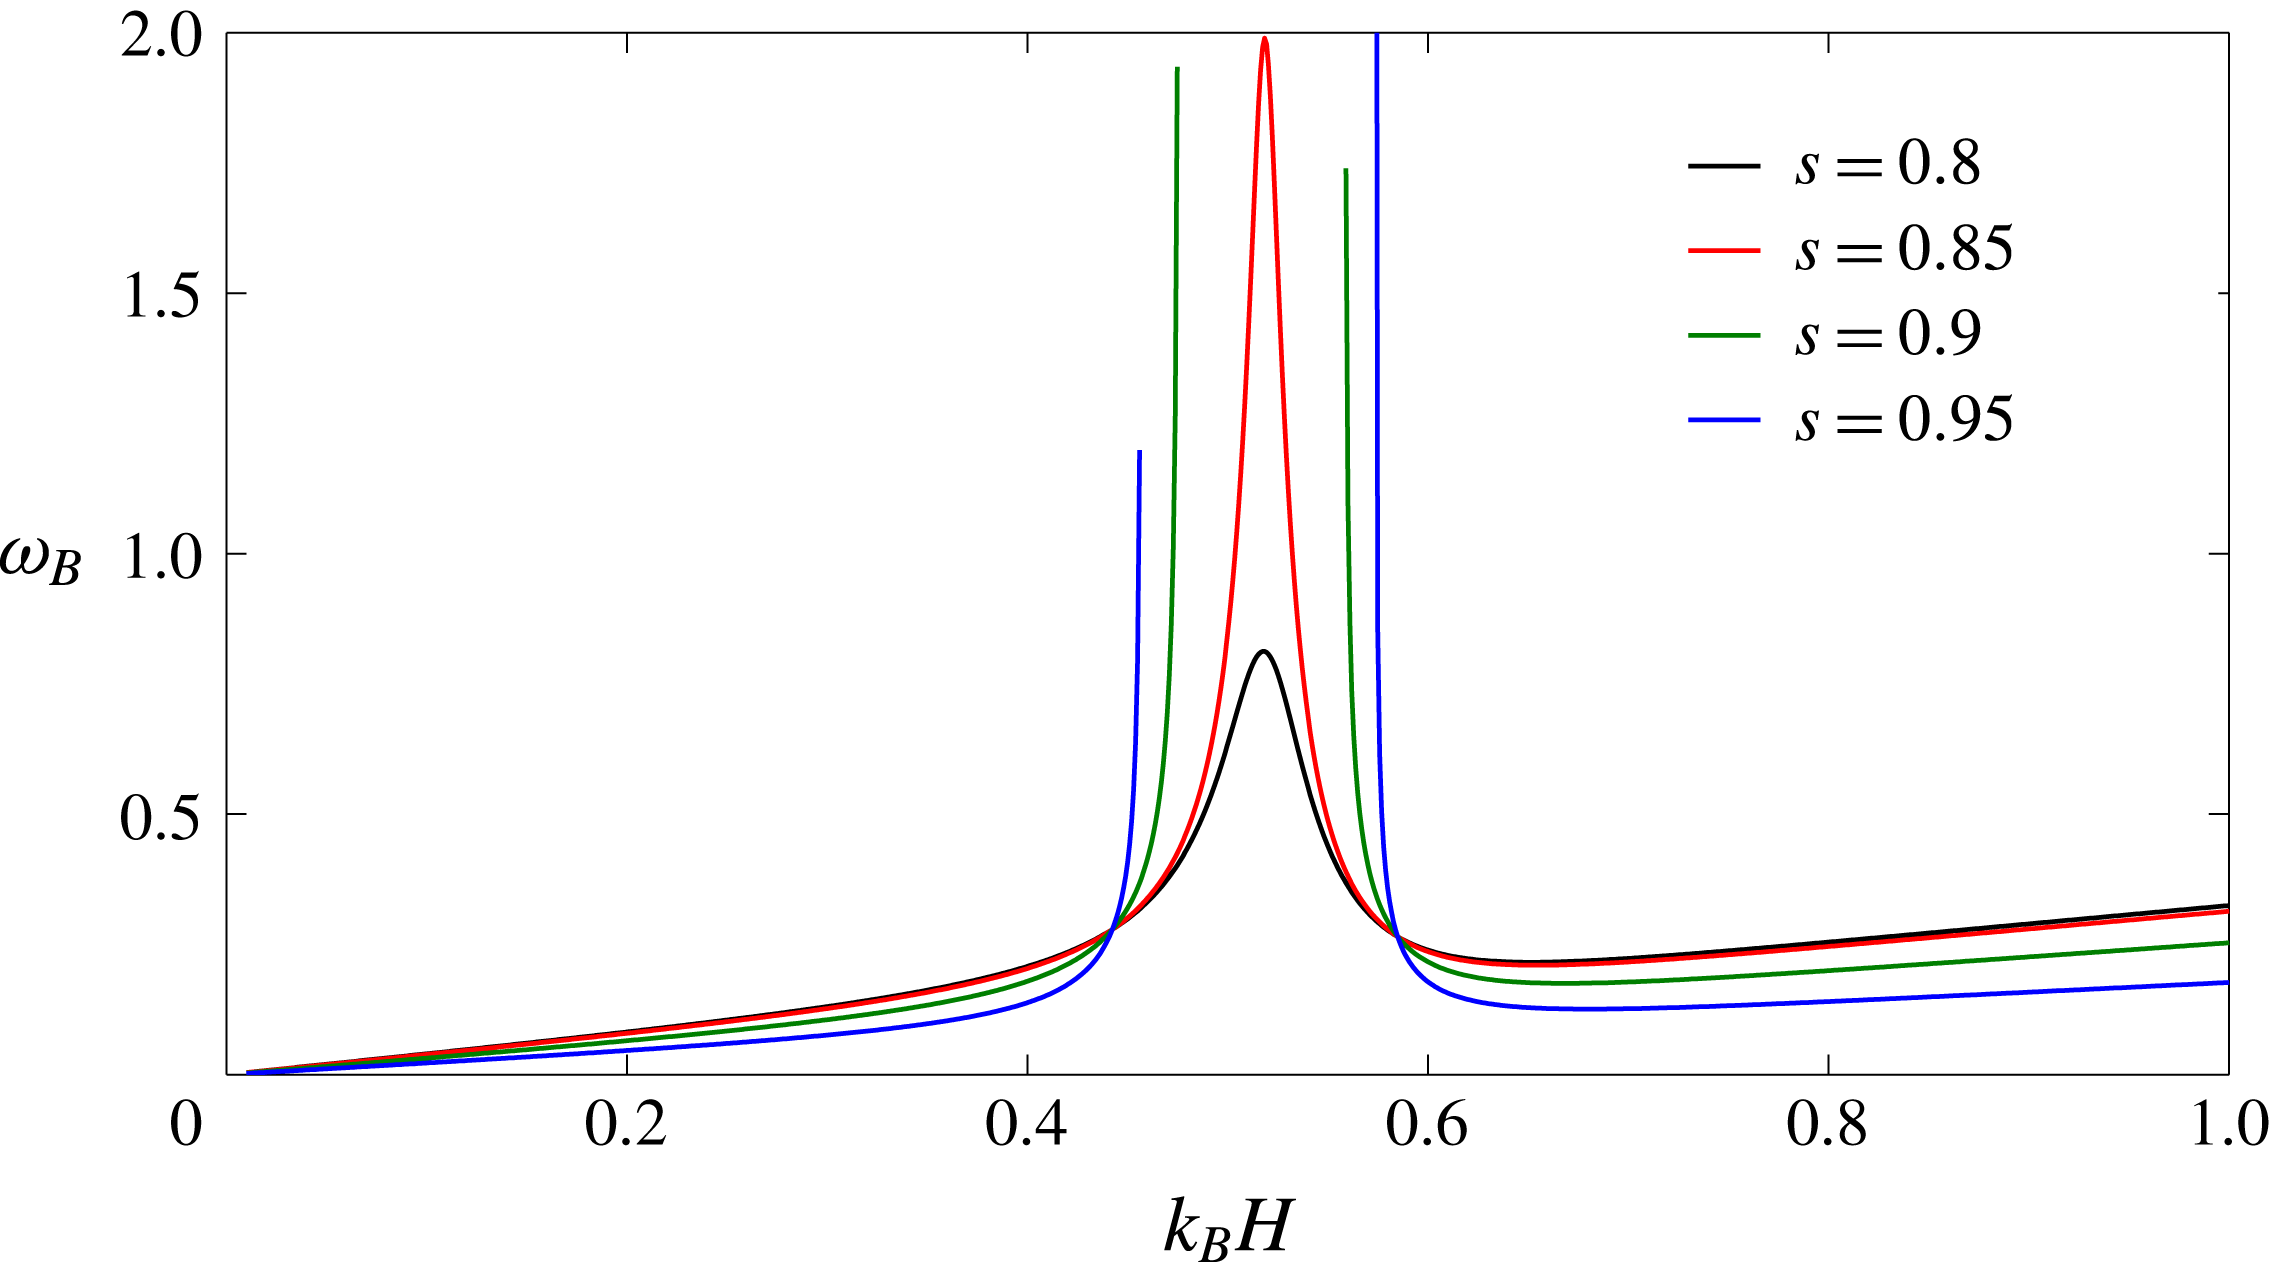
Dependency between the blocking frequency and the wavenumber with
 $Q=1.8\sqrt{D}$
. For small density difference (
 $s=0.9,0.95$
), the graphs are discontinuous due to the non-existence of blocking frequency in a certain range of wavenumbers. However, the blocking frequency, having a high value, emerges when the density difference increases (
 $s=0.8,0.85$
).

Further, the condition for wave blocking in the internal mode can be obtained from (4.19) by putting
 $c_{g}^{-}=0$
. This yields the following relation between the blocking frequency
 $\unicode[STIX]{x1D714}_{B}$
and blocked wavenumber
 $k_{b}$
:
 $$\begin{eqnarray}\unicode[STIX]{x1D714}_{B}^{2}=gk_{b}^{2}\frac{h(H-h_{p})A_{4}}{H-h_{p}+h_{p}A_{3}}.\end{eqnarray}$$
The above dependency between the blocking frequency and the wavenumber is illustrated in figure 7 with
 $Q=1.8\sqrt{D}$
. It can be observed that when the density ratio is high, i.e. densities are close to each other, there exists a range of wavenumbers for which no blocking frequency exists. This means no matter what the given input frequency is, the waves with a wavenumber in that range cannot be blocked for the critical values of the compressive force and density ratio. A mathematical explanation of this non-occurrence of a blocking frequency for certain blocked wavenumbers is because (4.22) and (4.1) or (4.2) do not intersect in such circumstances. This result can be obtained from the discontinuity in the graph (for example, the graphs corresponding to
 $s=0.9,0.95$
). As the density ratio decreases, high-frequency waves in the aforementioned wavenumber range can be blocked.
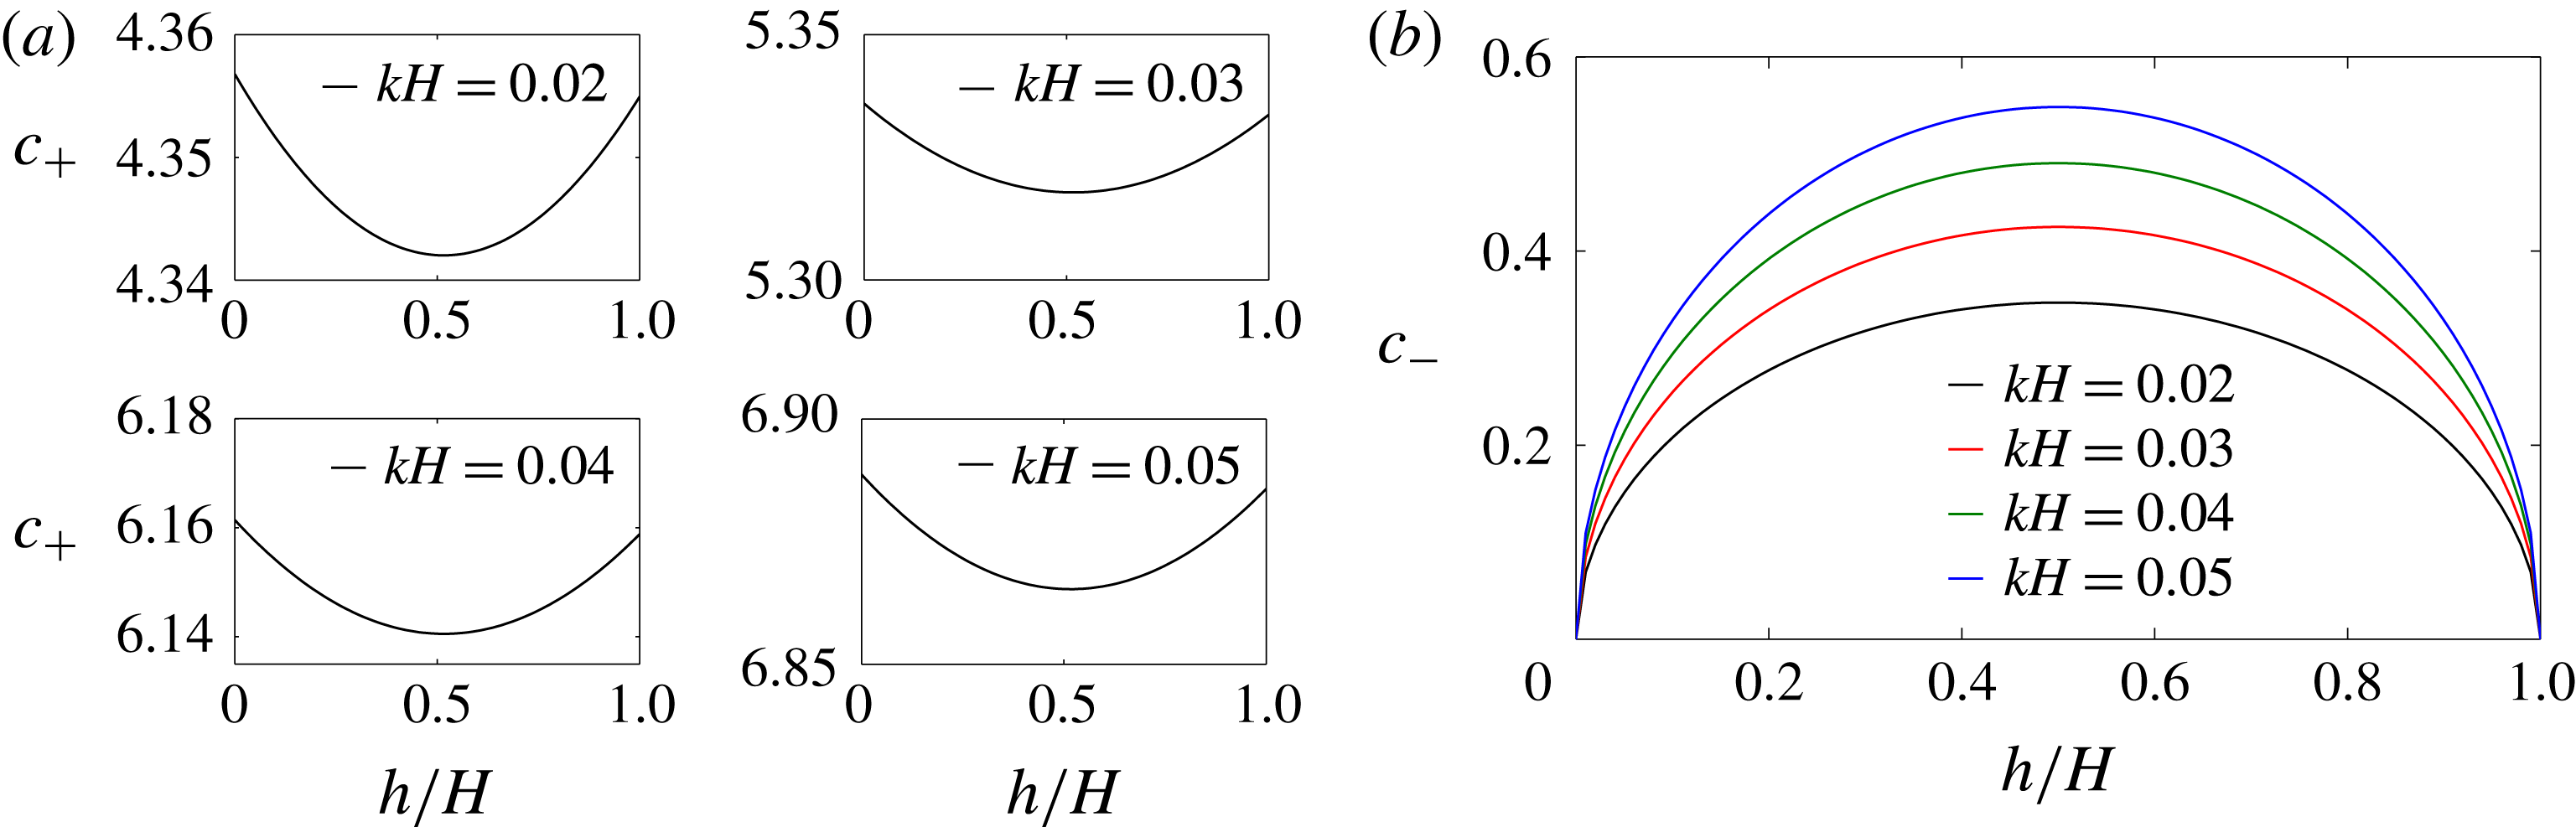
Phase velocities of the surface and the internal modes with
 $Q=1.95\sqrt{D}$
and
 $H=10~\text{m}$
are depicted. (a) Minimum in the phase velocity in the surface mode occurs at
 $h/H\approx 1/2$
. (b) Similarly, a maximum in phase velocity in the internal mode is obtained at
 $h/H\approx 1/2$
.

On the other hand, (4.19) shows that the phase velocities of the surface and the internal modes attain optimum values, and are denoted as
 $h_{c}^{\pm }$
,
 $$\begin{eqnarray}h_{c}^{\pm }=\left.\left[H-\frac{c_{\pm }^{2}(1-1/A_{2})}{g}\right]\right/2,\end{eqnarray}$$
where
 $\text{d}c_{\pm }/\text{d}h=0$
. Further, equation (4.16) yields
 $$\begin{eqnarray}\left.\frac{\text{d}^{2}c_{\pm }}{\text{d}h^{2}}\right|_{h=h_{c}}=\mp \frac{\text{d}^{2}\unicode[STIX]{x1D6FF}}{\text{d}h^{2}}=\pm 2(1-s)A_{2},\quad \text{with }A_{2}>0.\end{eqnarray}$$
Thus, equation (4.24) ensures that
 $$\begin{eqnarray}\text{d}^{2}c_{\pm }/\text{d}h^{2}\gtrless 0\quad \text{at }h=h_{c}^{\pm },\end{eqnarray}$$
which demonstrates that the phase velocity attains a minimum in the surface mode and a maximum in the internal mode at
 $h=h_{c}^{\pm }$
. Moreover, figure 8 reveals that the optima in phase velocities are attained at
 $h_{c}^{\pm }\approx H/2$
under the shallow water approximation. In particular, in the case of free surface gravity waves in a two-layer fluid, i.e. for
 $D=0$
,
 $Q=0$
, the phase velocity attains a minimum in the surface mode and a maximum in the internal mode for
 $h_{c}^{\pm }=H/2$
. A similar observation was made for the phase velocity in the internal mode by Mondal & Sahoo (Reference Mondal and Sahoo2012) but without any explanation.
4.4 Deep water approximation
Under the assumption of the deep water approximation, assuming
 $|k|h\gg 1$
and
 $|k|(H-h)\gg 1$
, (3.9) yields
 $$\begin{eqnarray}\unicode[STIX]{x1D714}_{+}^{2}=(Dk^{4}-Qk^{2}+1)g|k|,\quad \unicode[STIX]{x1D714}_{-}^{2}=\frac{(1-s)g|k|}{1+s}.\end{eqnarray}$$
Under this limit, the upper and lower waves become uncoupled and the amplitude ratio
 $r$
tends to either zero or infinity. The results here are interesting because qualitatively they will apply for large finite depths. Figure 9(a) reveals that in the case of deep water, the wave frequency of the surface mode attains a maximum as well as a minimum for certain positive wavenumbers where
 $\text{d}\unicode[STIX]{x1D714}/\text{d}k$
vanishes, which ensures the existence of a wave frequency where no energy will propagate, and this phenomenon is known as blocking. The negative energy wave that propagates in between primary and secondary blocking is often regarded as the blue-shifted wave, as defined by Nardin et al. (Reference Nardin, Rousseaux and Coullet2009). This wave is not a reflected wave since it has a positive wavenumber.
Equation (4.26) demonstrates that in the case of deep water, the characteristics of flexural-gravity waves in the surface mode are similar to those of a homogeneous fluid, as discussed in Das et al. (Reference Das, Sahoo and Meylan2018), whilst the waves in the internal mode depend on the density ratio, the same as the internal waves associated with free surface gravity waves in deep water. Thus, the dispersion relation has a maximum of three positive roots in the surface mode and one positive root in the internal mode. Within the range of the trapped energy zone, where waves with negative energy propagate, the dispersion relation in the surface mode has three positive roots of which two coalesce at the point of blocking, whereas all the three roots coalesce at the point of inflexion.
Apart from the distinct frequencies in the surface and the internal modes, equation (4.26) reveals that the angular frequencies in surface and internal modes coalesce when
 $$\begin{eqnarray}Dk^{4}-Qk^{2}+2s/(1+s)=0,\end{eqnarray}$$
which yields that the wavenumber in surface mode coincides with that of the internal mode at four distinct points (two positive and two negative wavenumbers) in the case of the deep water approximation under the condition
 $$\begin{eqnarray}2\sqrt{\frac{2Ds}{1+s}}<Q<2\sqrt{D}.\end{eqnarray}$$
The reason for the upper bound on
 $Q$
is as follows. The plate can sustain an amount
 $Q<2\sqrt{D}$
of compressive force under the deep water approximation. The following physical interpretation also justifies this upper bound on
 $Q$
. In this situation,
 $\unicode[STIX]{x1D714}_{-}=0$
and
 $\unicode[STIX]{x1D714}_{+}$
touches the wavenumber axis with a sharp corner, and this results in a discontinuous group velocity, i.e. plate buckling. Figure 9(a) demonstrates that the curves for
 $\unicode[STIX]{x1D714}_{+}$
and
 $\unicode[STIX]{x1D714}_{-}$
intersect at two distinct points for each value of the density ratio
 $s$
, where the compressive force satisfies the aforementioned condition. Note that the value of
 $Q$
in figure 9(a) depends on
 $s$
. The pairs of distinct cut points
 $(\unicode[STIX]{x1D6FC},\unicode[STIX]{x1D6FC}^{\prime }),(\unicode[STIX]{x1D6FD},\unicode[STIX]{x1D6FD}^{\prime }),(\unicode[STIX]{x1D6FE},\unicode[STIX]{x1D6FE}^{\prime })$
and
 $(\unicode[STIX]{x1D6FF},\unicode[STIX]{x1D6FF}^{\prime })$
correspond to the density ratios
 $s=0.8,0.85,0.9$
and
 $0.95$
, respectively. However, these two distinct points coalesce at the point
 $$\begin{eqnarray}k_{c}=\left[\frac{2s}{D(1+s)}\right]^{1/4}\quad \text{for }Q_{c}=2\sqrt{\frac{2Ds}{1+s}},\end{eqnarray}$$
as in figure 9(b), which implies that
 $\unicode[STIX]{x1D714}_{-}$
is tangent to
 $\unicode[STIX]{x1D714}_{+}$
at
 $k_{c}$
. The values of
 $\unicode[STIX]{x1D70F}_{i}\,(i=1,2,3,4)$
are such points for the density ratios
 $s=0.8,0.85,0.9$
and
 $0.95$
, respectively. Further,
 $\unicode[STIX]{x1D714}_{-}$
vanishes (coincides with
 $k$
-axis) and
 $\unicode[STIX]{x1D714}_{+}$
becomes zero at
 $k_{c}=\unicode[STIX]{x1D70F}_{5}$
(tangent to the
 $\unicode[STIX]{x1D714}_{-}$
curve) when
 $s=1$
and the corresponding
 $Q_{c}$
becomes the buckling limit of flexural-gravity wave motion in single-layer fluid, as discussed in Das et al. (Reference Das, Sahoo and Meylan2018).
(a) Multiple coalescence of frequencies in the surface and the internal modes occurs for
 $Q=(1.6\sqrt{2s/(1+s)}+0.2)\sqrt{D}$
which satisfies relation (4.28), for various values of the density ratio. The regions
 $(\unicode[STIX]{x1D6FC},\unicode[STIX]{x1D6FC}^{\prime }),(\unicode[STIX]{x1D6FD},\unicode[STIX]{x1D6FD}^{\prime }),(\unicode[STIX]{x1D6FE},\unicode[STIX]{x1D6FE}^{\prime })$
and
 $(\unicode[STIX]{x1D6FF},\unicode[STIX]{x1D6FF}^{\prime })$
correspond to the regions where the internal mode travels faster than the surface mode. (b) Single coalescence of frequencies occurs for
 $Q=Q_{c}$
where the frequency graphs are tangent to each other. For
 $s=1$
, the internal mode vanishes and the corresponding
 $Q_{c}$
becomes the buckling limit in the case of a homogeneous fluid. (c) Phase velocity of the surface mode never vanishes for
 $Q=Q_{c}$
in a two-layer fluid (
 $s=1$
corresponds to a homogeneous fluid). (d) Occurrences of negative group velocity suggest wave blocking in the surface mode.

On the other hand, in the absence of a compressive force, (4.27) reveals that the angular frequency of the surface mode will never coincide with that of the internal mode. Moreover, figure 9(c) reveals that a non-zero minimum in phase velocity is attained at
 $k=k_{c}$
for
 $Q=Q_{c}$
and
 $0<s<1$
, and phase velocity
 $c_{+}=c_{-}=c$
attains zero minimum at
 $k=k_{c}$
for
 $Q=Q_{c}$
and
 $s=1$
. Figure 9(d) demonstrates that the group velocity becomes negative within the range
 $Q_{cg}<Q<Q_{c}$
for which blocking will occur, as discussed in Das et al. (Reference Das, Sahoo and Meylan2018), with
 $Q_{cg}$
being the threshold of blocking.
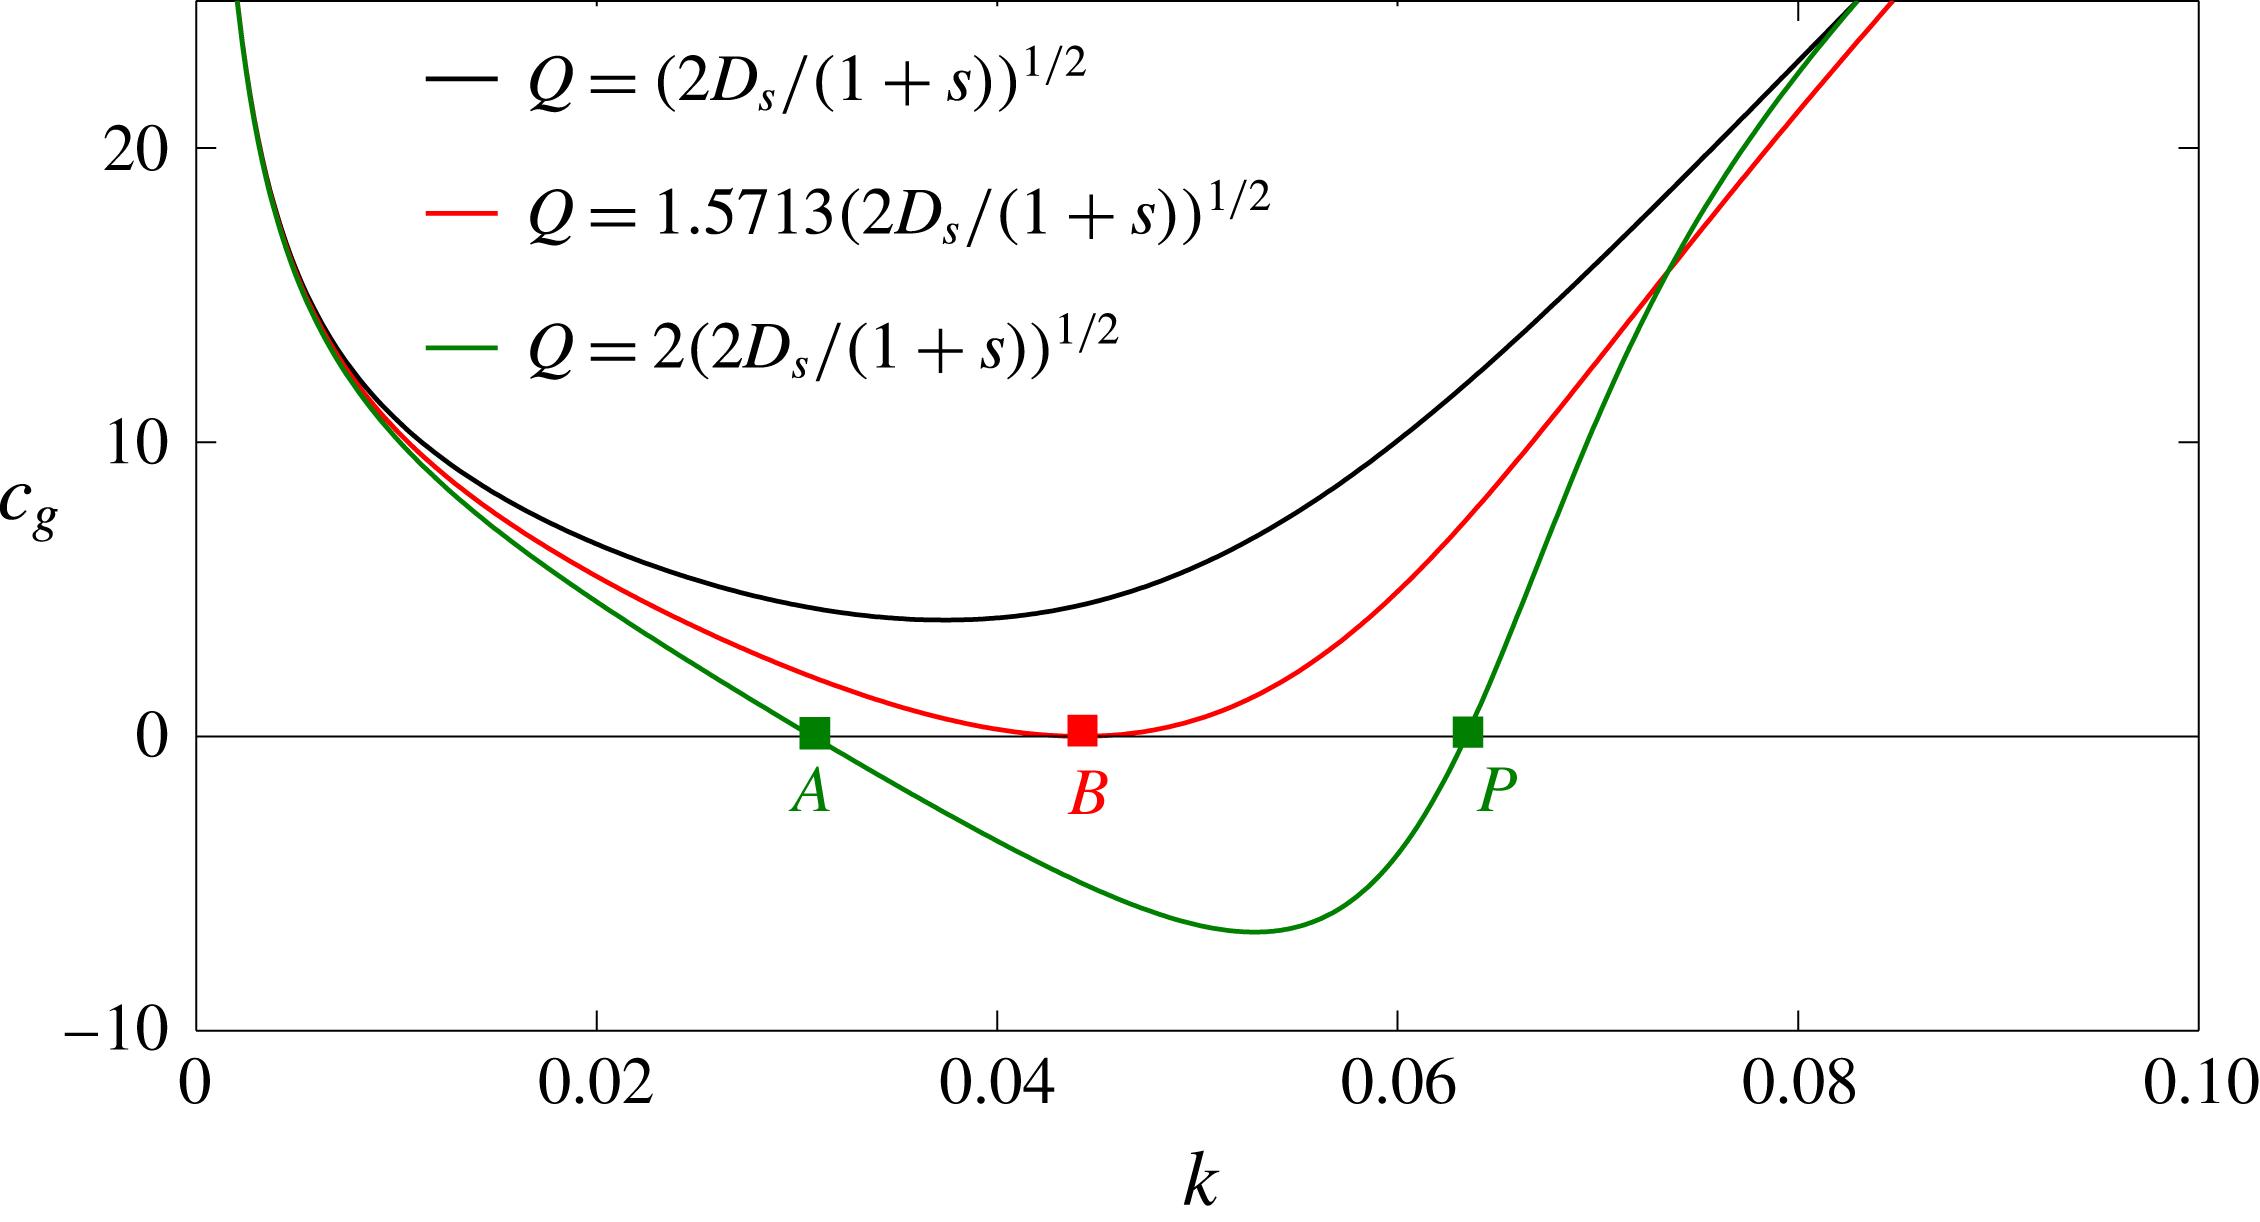
The group velocity in the surface mode for
 $\unicode[STIX]{x1D714}_{+}=\unicode[STIX]{x1D714}_{-}$
with
 $s=0.9$
. The group velocity vanishes at the blocking points
 $A$
and
 $P$
for
 $Q=Q_{c}$
, and merges at the point of inflexion
 $B$
(with an decrease in
 $Q$
) to provide a zero minimum in the group velocity.

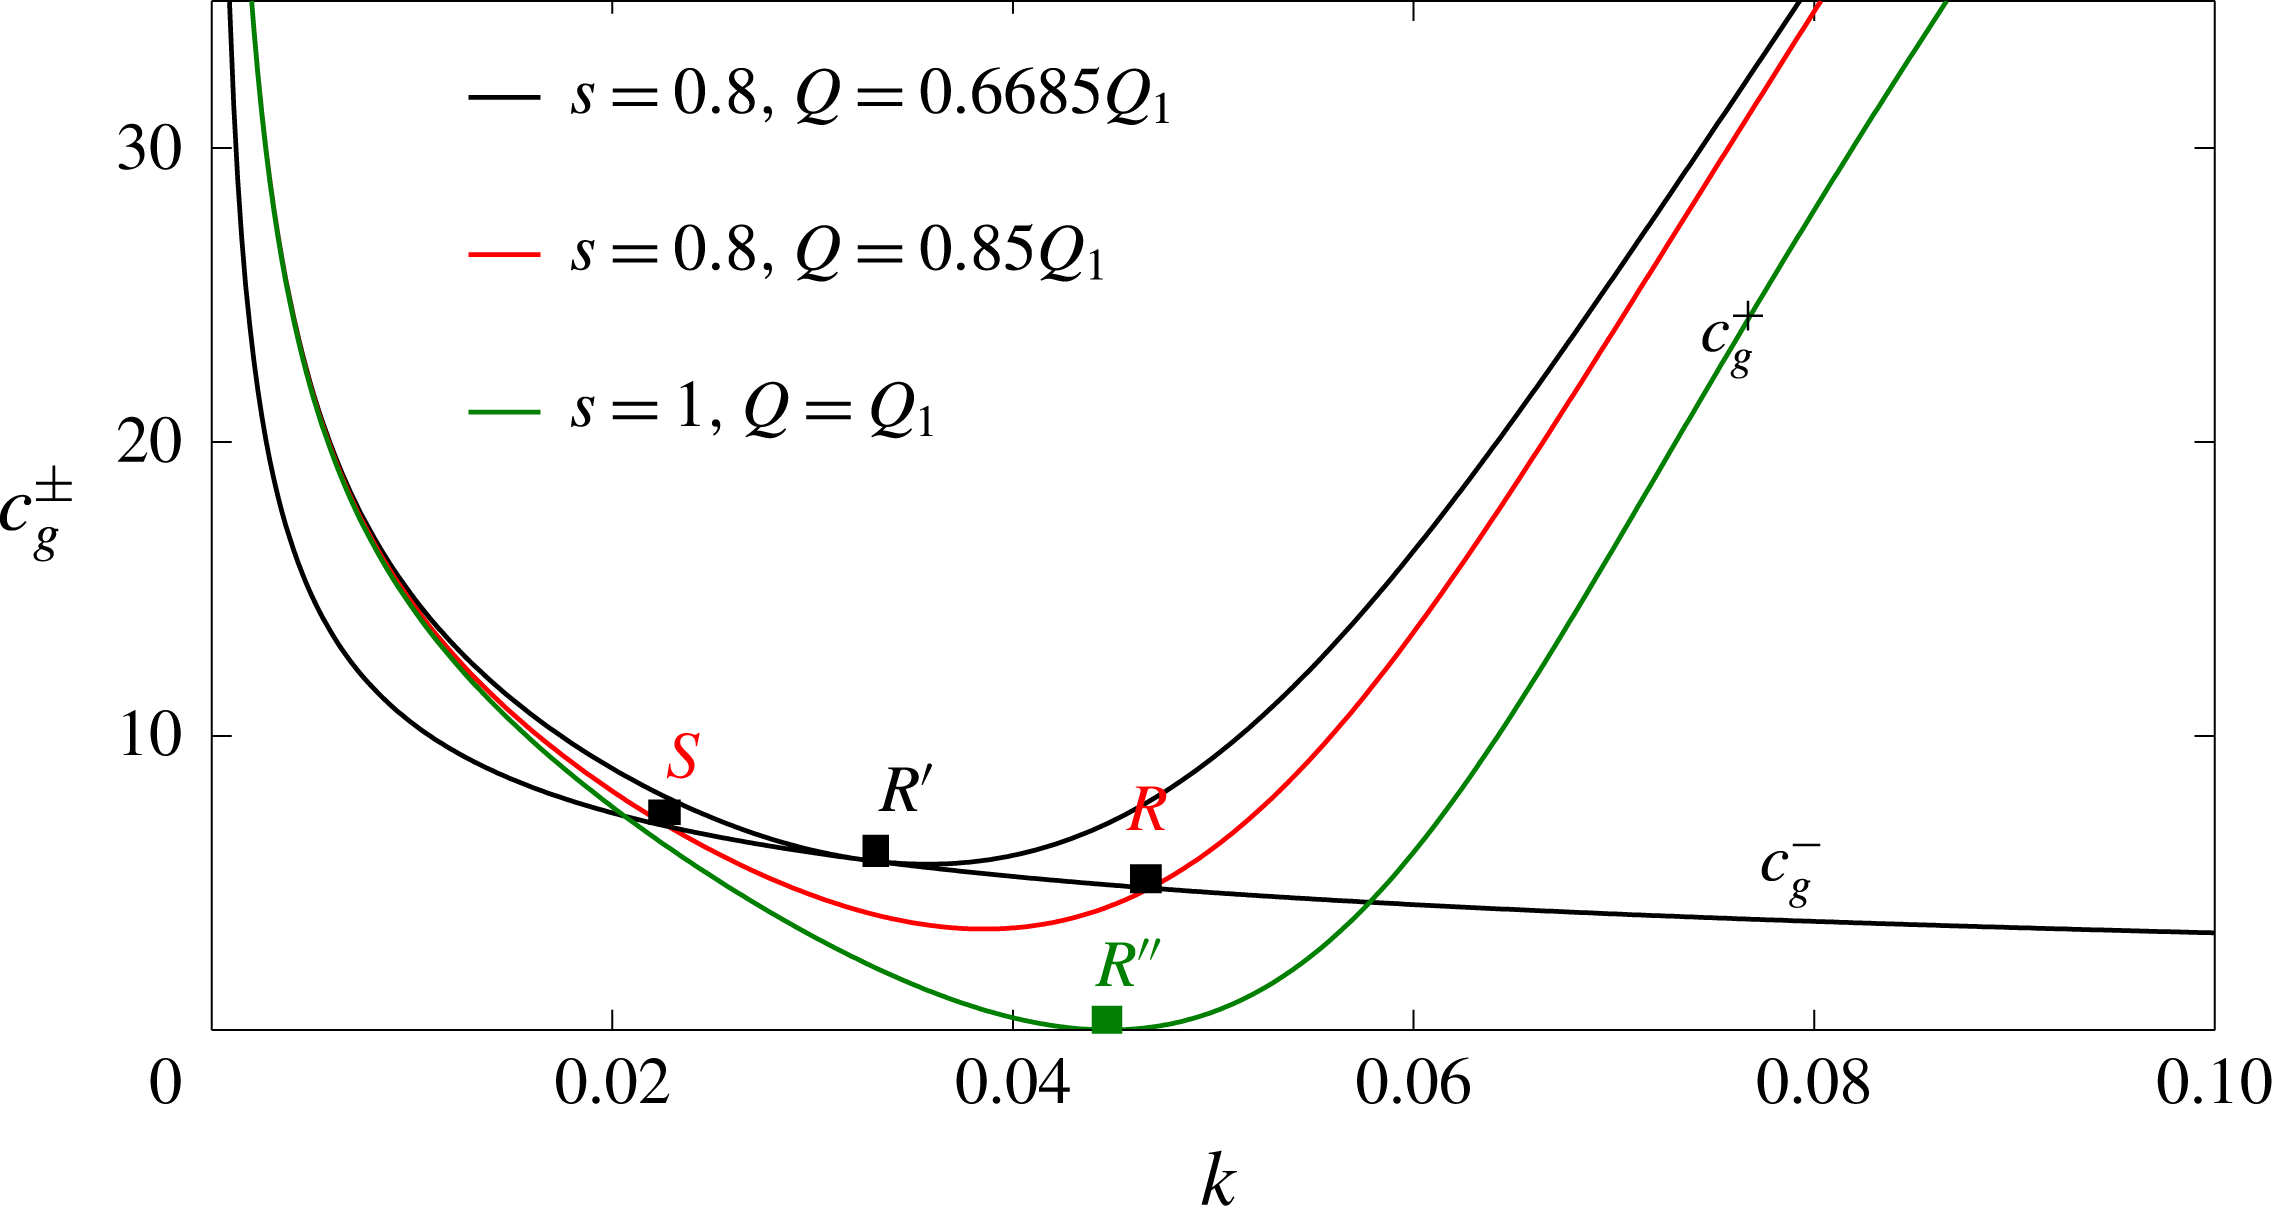
The group velocity in the surface and the internal mode attains a zero minimum (
 $R^{\prime \prime }$
) and vanishes, respectively, for
 $Q=Q_{1}$
and
 $s=1$
. This provides the critical compressive force for a point of inflexion in a homogeneous fluid. However, in a two-layer fluid (
 $s\neq 1$
), multiple coalescence occurs for
 $Q=0.85Q_{1}$
(points
 $R$
and
 $S$
) and the internal wave energy propagates faster between these two corresponding wavenumbers than the surface waves. With a further decrease in compressive force, a single coalescence occurs for
 $Q=0.6685Q_{1}$
.

In figure 10, the group velocity attains a zero minimum at the point
 $P$
for
 $Q=1.5713\sqrt{2Ds/(1+s)}$
which is the critical compressive force
 $Q_{cg}$
for
 $s=0.9$
. Moreover,
 $A$
and
 $B$
are the two blocking points which occur for
 $Q=2\sqrt{2Ds/(1+s)}$
with
 $s=0.9$
. Further, equations (4.26) reveal that the group velocities of the surface and the internal modes coincide for
 $$\begin{eqnarray}5Dk^{4}-3Qk^{2}+\left[1-\frac{(1-s)c_{+}}{(1+s)c_{-}}\right]=0,\end{eqnarray}$$
which means that
 $c_{g+}$
and
 $c_{g-}$
coalesce for two positive and two negative wavenumbers. If the phase velocities are also the same, i.e.
 $c_{+}=c_{-}$
, a critical compressive force
 $Q_{1}=\sqrt{40Ds/(1+s)}/3$
is obtained. Here, for simplicity, only positive wavenumbers are considered for the study and they are located at
 $R$
and
 $S$
, as shown in figure 11. It is notable that, within the corresponding wavenumbers of these two points, the internal wave energy propagates faster than that of surface waves. Further, the curves for
 $c_{g+}$
and
 $c_{g-}$
are tangent to each other, located at
 $R^{\prime }$
in figure 11 for
 $$\begin{eqnarray}k=\left[\left.\left\{1-\frac{(1-s)c_{+}}{(1+s)c_{-}}\right\}\right/5D\right]^{1/4},\quad \text{which gives }Q=\frac{1}{3}\sqrt{20D\left\{1-\frac{(1-s)c_{+}}{(1+s)c_{-}}\right\}}.\quad\end{eqnarray}$$
Under such circumstances the pair of positive/negative roots coalesce, but blocking will not occur as the group velocity cannot be zero. This can be verified by computing
 $c_{g}^{+}$
from (4.26). However, both
 $c_{g+}=c_{g-}$
and
 $c_{+}=c_{-}$
are possible only for
 $s=1$
, and in such a situation the two-layer fluid reduces to a homogeneous fluid with
 $k_{cg}=(1/(5D))^{1/4}$
which is the point of inflexion located at
 $R^{\prime \prime }$
in figure 11, and the corresponding compressive force is given by
 $Q_{cg}=\sqrt{20D}/3$
as discussed in Das et al. (Reference Das, Sahoo and Meylan2018).
As a special case, the capillary–gravity wave motion in a two-layer fluid is studied by assuming
 $D=0$
and
 $Q=-M/(\unicode[STIX]{x1D70C}_{1}g)$
and the corresponding
 $\unicode[STIX]{x1D714}_{+}$
and
 $\unicode[STIX]{x1D714}_{-}$
are given by
 $$\begin{eqnarray}\unicode[STIX]{x1D714}_{+}^{2}=(1+Mk^{2})gk\quad \text{and}\quad \unicode[STIX]{x1D714}_{-}^{2}=\frac{(1-s)gk}{1+s},\end{eqnarray}$$
with
 $M$
being the surface tension of the upper layer fluid. Equation (4.32) reveals that the phase and group velocities of the surface and the internal modes will never become zero for real values of wavenumber
 $k$
. Thus, blocking will not occur for capillary–gravity waves, and distinct wavenumbers of the surface and the internal modes will exist. Moreover, the wave frequency in the surface mode will not coalesce with that of the internal mode for capillary–gravity waves. Note that Maissa et al. (Reference Maissa, Rousseaux and Stepanyants2013) observed the occurrence of wave blocking in capillary–gravity waves only in the presence of an opposing current.
5 Flexural-gravity analogue of dead water
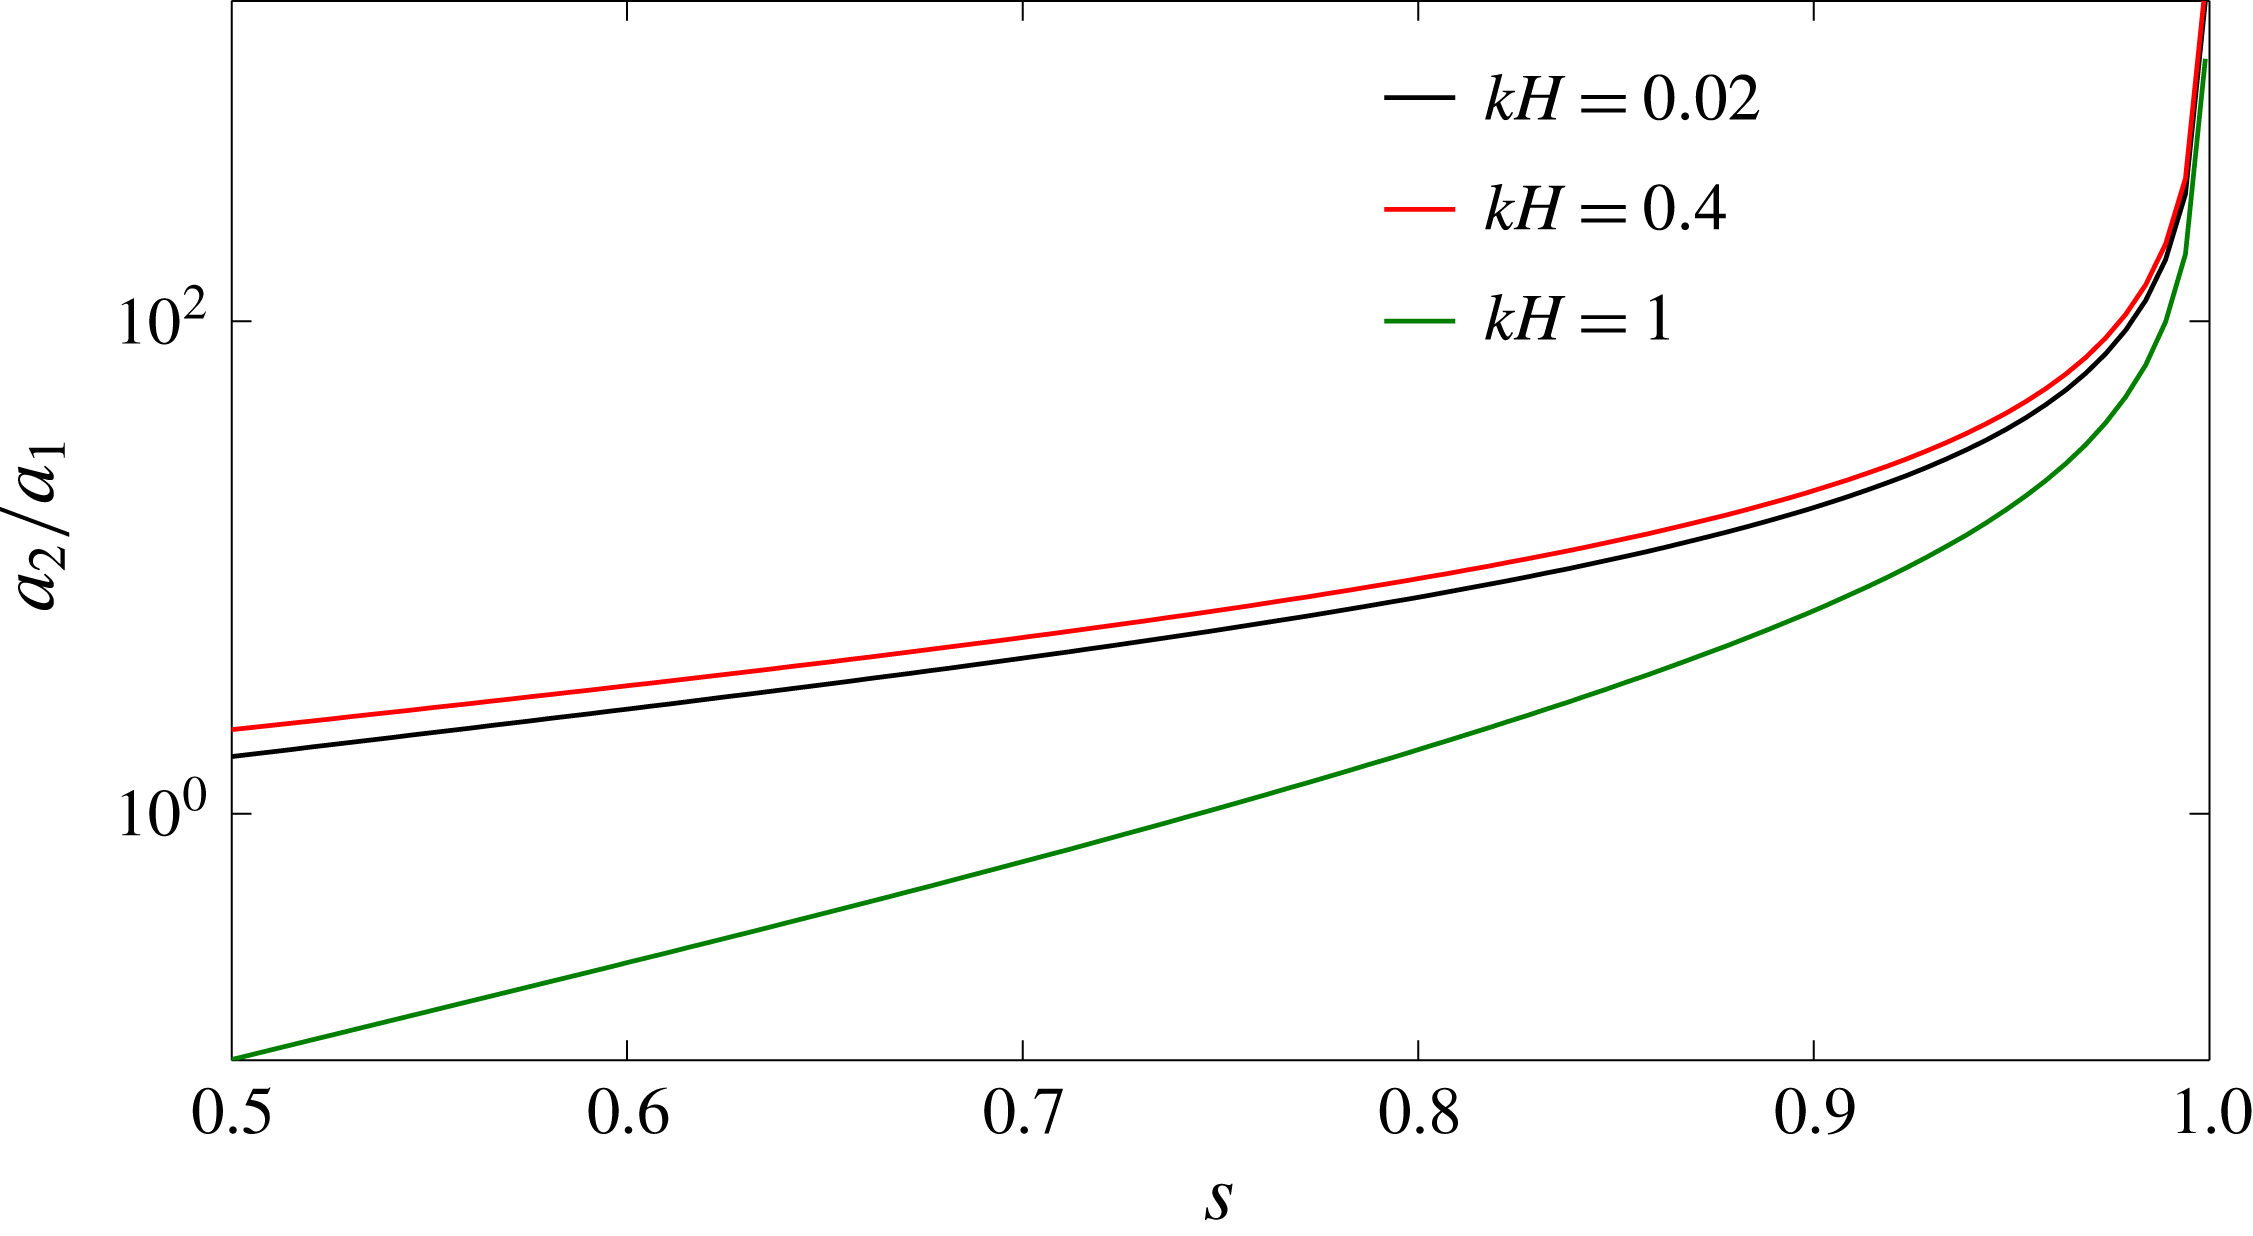
When the densities of the two fluids are close to each other, i.e.
 $\unicode[STIX]{x1D70C}_{1}\rightarrow \unicode[STIX]{x1D70C}_{2}$
, the amplitude ratio in (3.8) reveals that
 $$\begin{eqnarray}\lim _{s\rightarrow 1}r^{-}\rightarrow \infty .\quad \text{for }\unicode[STIX]{x1D714}=\unicode[STIX]{x1D714}_{-},\end{eqnarray}$$
which demonstrates that the amplitude of the internal wave increases significantly as the densities of the two fluids become very close to each other. The following fixed values are considered in this section for computational purposes, unless otherwise mentioned:
 $Q=1.95\sqrt{D}$
,
 $s=0.95$
and
 $h/H=0.5$
. Figure 12 illustrates this situation. As
 $s\rightarrow 1$
, the amplitude ratio is very high for
 $\unicode[STIX]{x1D714}=\unicode[STIX]{x1D714}_{-}$
. This phenomenon is analogous to the dead water effect of surface gravity waves in a stratified fluid where the internal wave amplitude becomes very large. Further, equation (3.13) depicts that when the densities of both of the layers are very close to each other, the energy concentration at the interface will be extremely high compared to that on the plate surface.
Dead water analogue is observed for three different values of the dimensionless wavenumber
 $kH$
when
 $s\rightarrow 1$
. The amplitude ratio is very high for
 $\unicode[STIX]{x1D714}=\unicode[STIX]{x1D714}_{-}$
as the densities of the two layers are very close to each other.

6 Applicability of the theory
The role and importance of the compressive force for wave propagation in an ice pack was recognized by Mollo-Christensen (Reference Mollo-Christensen1983). Subsequently, inspired by the reports that the R/V Polarstern had encountered surface waves of large amplitude hundreds of kilometres inside the ice pack in Weddell sea, Liu & Mollo-Christensen (Reference Liu and Mollo-Christensen1988) performed a buckling analysis of a floating ice sheet in the presence of compressive force. A recent study of Collins, Rogers & Lund (Reference Collins, Rogers and Lund2017) revealed that, during strong on-ice storms, the ice edge becomes compact enough to provide a very high compressive force. Ice cover with ocean stratification can be observed in Antarctica (Sigman, Jaccard & Haug Reference Sigman, Jaccard and Haug2004). Another major area of application of floating elastic plate theory is to vlfs (very large floating structures), which are large thin structures designed to utilize ocean space for various purposes, such as a floating airport. Squire (Reference Squire2007) provided a detailed review of the synergies between vlfs and a floating ice sheet. Especially in tropical regions where salinity and temperature difference stratify the water (Yuan, Li & Cheng Reference Yuan, Li and Cheng2007), this theory would be applicable to mathematically model vlfs. Although these structures are usually placed on calm water, during extreme storm events wind forcing can generate very high compressive forces on the structure.
7 Time-dependent motion
We can simulate the motion of the two-layer fluid in the time domain. We consider the case where the lower layer is infinite, so (4.1) gives the two solutions of the dispersion equation and (4.2), and we assume that the depth of the upper layer is
 $h=10~\text{m}$
. We chose
 $EI=5\times 10^{8}~\text{N}~\text{m}^{-2}$
,
 $\unicode[STIX]{x1D70C}_{1}=1000~\text{kg}~\text{m}^{-3}$
,
 $g=9.81~\text{m}~\text{s}^{-2}$
and
 $s=0.9$
. We consider here only waves with positive phase velocity. The waves with negative phase velocity could be simulated by simply running time backwards.
We can write the displacement at the surface as the following Fourier integral:
 $$\begin{eqnarray}\displaystyle \unicode[STIX]{x1D702}_{1}(x,t) & = & \displaystyle \text{Re}\left\{\int _{0}^{\infty }\hat{f}^{+}(k)\exp (\text{i}(kx-\unicode[STIX]{x1D714}^{+}(k)t))\,\text{d}k\right\}\nonumber\\ \displaystyle & & \displaystyle +\,\text{Re}\left\{\int _{0}^{\infty }\hat{f}^{-}(k)\exp (\text{i}(kx-\unicode[STIX]{x1D714}^{-}(k)t))\,\text{d}k\right\}.\end{eqnarray}$$
We think of
 $\unicode[STIX]{x1D714}^{\pm }$
as a function of
 $k$
given by (4.1) and (4.2). We define the ratio of the lower to upper layer displacement
 $r^{\pm }(k)$
, given by (3.8), as
 $$\begin{eqnarray}r^{\pm }(k)=\frac{s}{\sinh kh\{s\coth kh+\coth k(H-h)-(1-s)gk/(\unicode[STIX]{x1D714}^{\pm }(k))^{2}\}}.\end{eqnarray}$$
The equation for the lower layer displacement is given by
 $$\begin{eqnarray}\displaystyle \unicode[STIX]{x1D702}_{2}(x,t) & = & \displaystyle \text{Re}\left\{\int _{0}^{\infty }r^{+}(k)\hat{f}^{+}(k)\exp (\text{i}(kx-\unicode[STIX]{x1D714}^{+}(k)t))\,\text{d}k\right\}\nonumber\\ \displaystyle & & \displaystyle +\,\text{Re}\left\{\int _{0}^{\infty }r^{-}(k)\hat{f}^{-}(k)\exp (\text{i}(kx-\unicode[STIX]{x1D714}^{-}(k)t))\,\text{d}k\right\}.\end{eqnarray}$$
The reason for writing it this way is that we obtain a very simple expression for the displacement at
 $t=0$
which we consider to be the equation which defines the functions
 $f^{\pm }$
. The displacement of the upper layer at
 $t=0$
is given by
 $$\begin{eqnarray}\unicode[STIX]{x1D702}_{1}(x,0)=\text{Re}\left\{\int _{0}^{\infty }\hat{f}^{+}(k)\exp (\text{i}kx)\text{d}k\right\}+\text{Re}\left\{\int _{0}^{\infty }\hat{f}^{-}(k)\exp (\text{i}kx)\text{d}k\right\}.\end{eqnarray}$$
The displacement of the lower layer at
 $t=0$
is given by
 $$\begin{eqnarray}\unicode[STIX]{x1D702}_{2}(x,0)=\text{Re}\left\{\int _{0}^{\infty }r^{+}(k)\hat{f}^{+}(k)\exp (\text{i}kx)\text{d}k\right\}+\text{Re}\left\{\int _{0}^{\infty }r^{-}(k)\hat{f}^{-}(k)\exp (\text{i}kx)\text{d}k\right\}.\end{eqnarray}$$
Since there are two wave packets we can impose a further condition, e.g. that the surface or interface displacement is zero at
 $t=0$
. For the calculations, we consider the condition that the surface displacement is zero at
 $t=0$
, so that
 $\hat{f}^{-}=-\hat{f}^{+}$
.
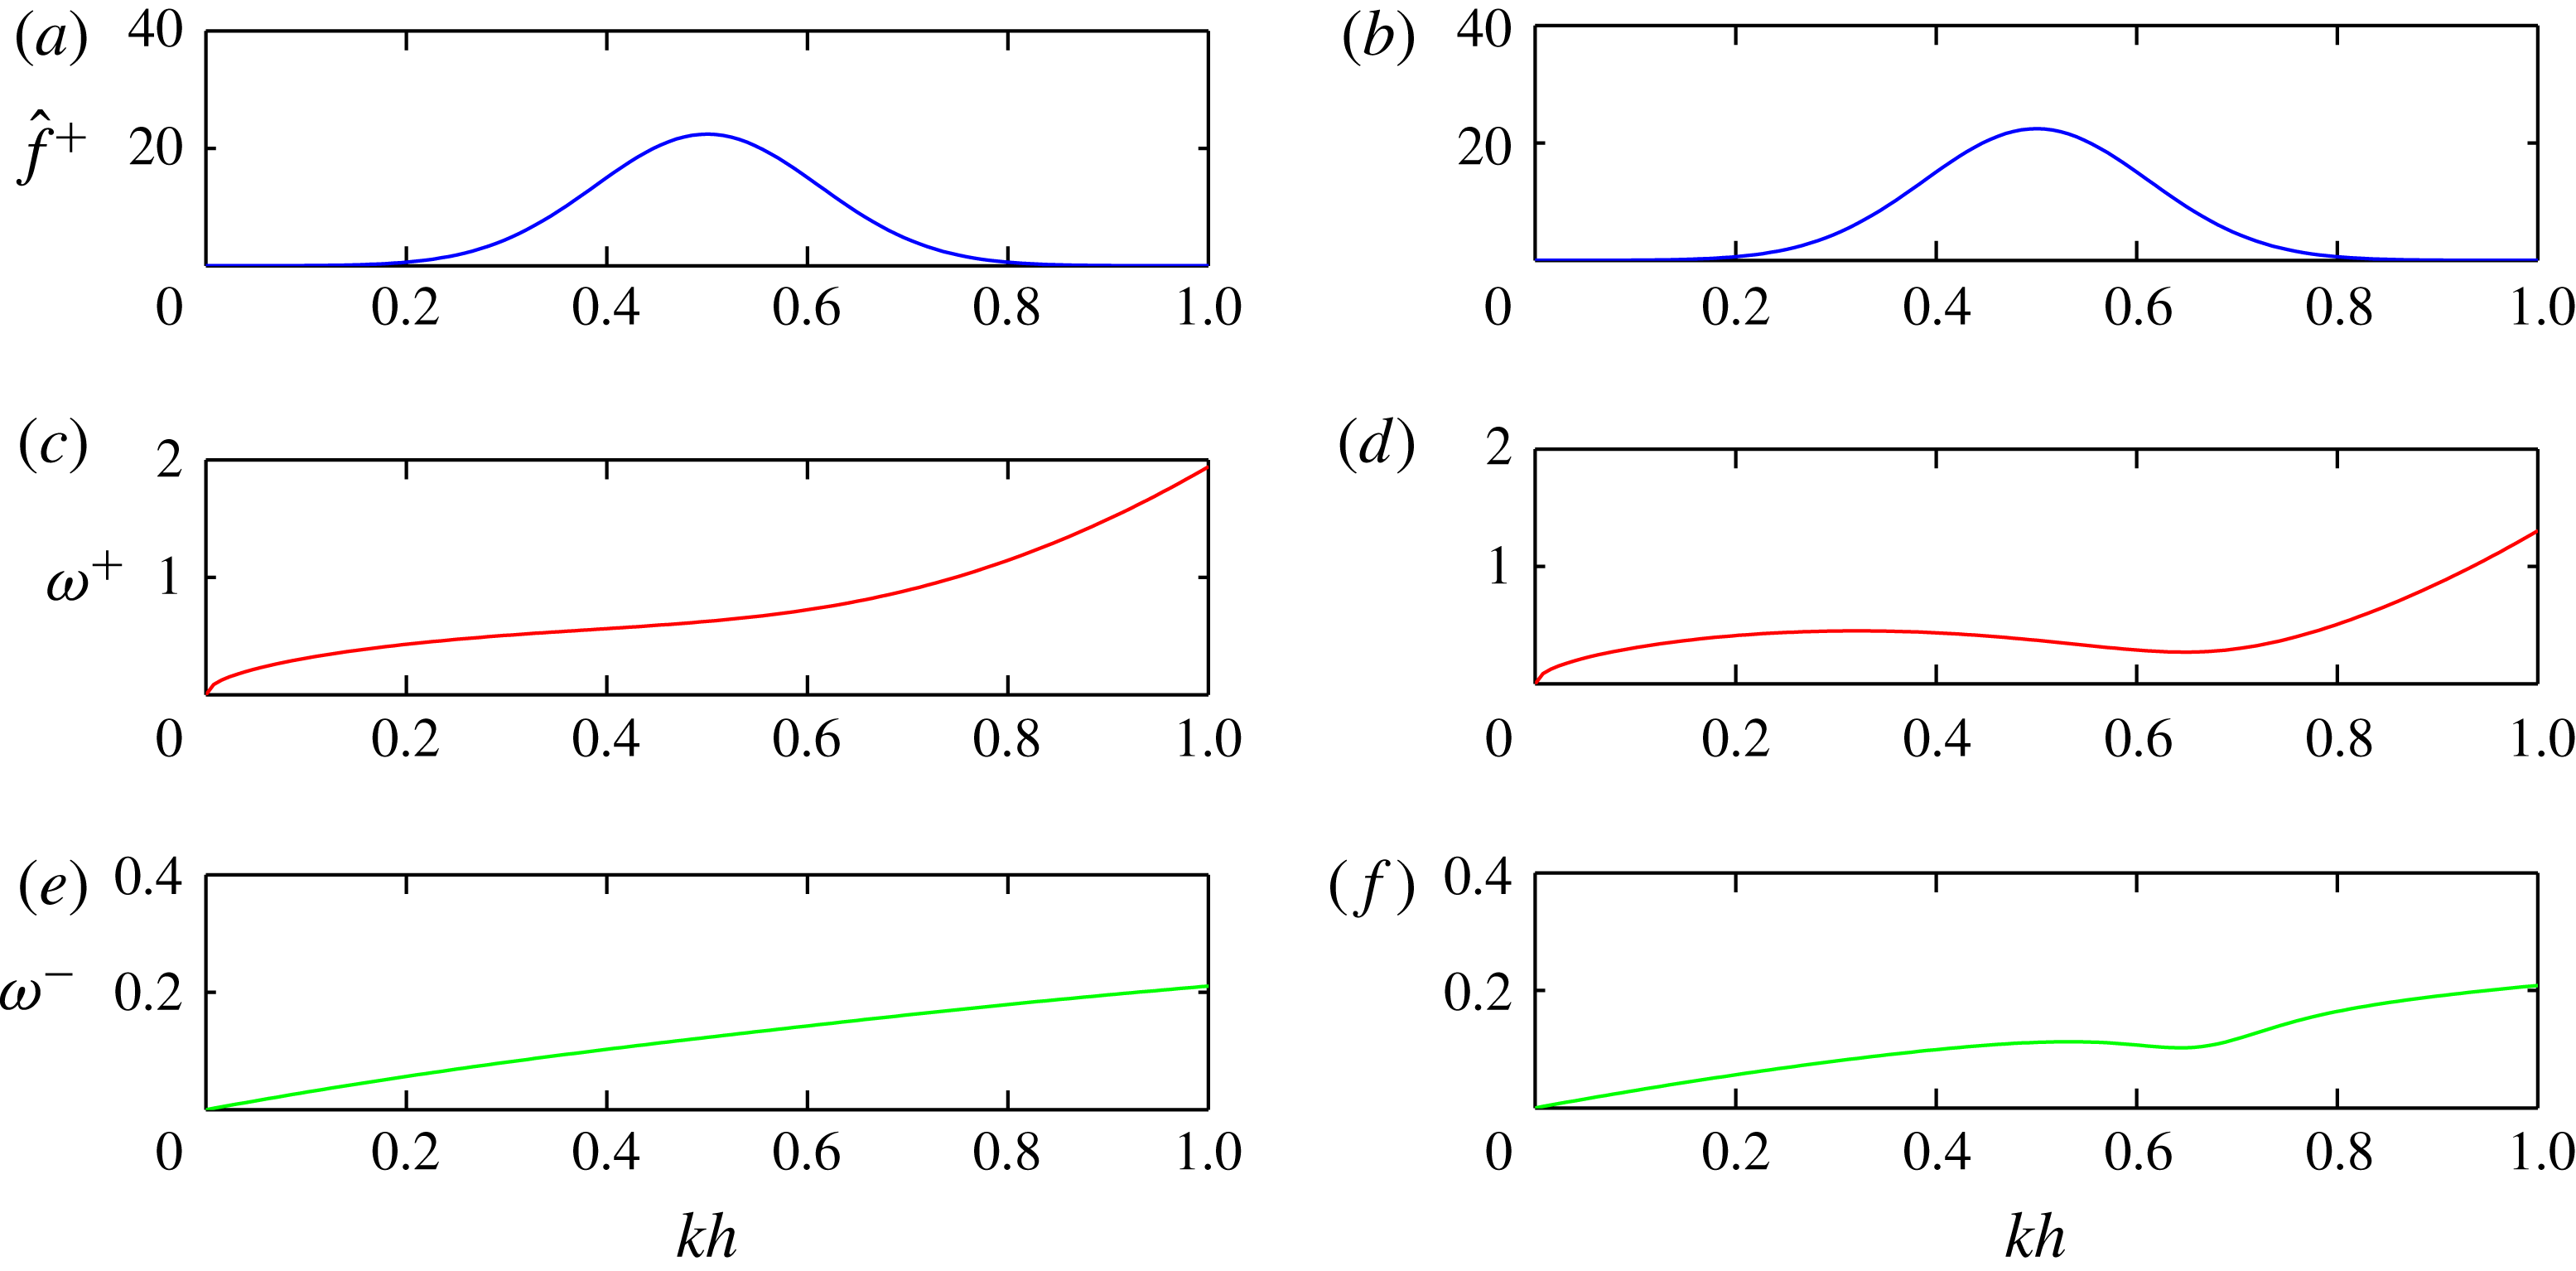
The Fourier transform
 $\hat{f}(k)$
as given in (7.6) (a,b) and
 $\unicode[STIX]{x1D714}_{+}$
and
 $\unicode[STIX]{x1D714}_{1}$
(c,d and e,f), versus
 $kh$
. (a,c,e)
 $Q=\sqrt{D}$
where there is neither blocking nor negative energy waves; (b,d,f)
 $Q=1.95\sqrt{D}$
where there is blocking and negative energy waves.

We consider Gaussian wave packets which we write in the transform space as
 $$\begin{eqnarray}\hat{f}^{+}(k)=2A\sqrt{\unicode[STIX]{x03C0}b}\exp (-b(k-k_{a})^{2}),\end{eqnarray}$$
where
 $k_{a}=5\times 10^{-2}$
is the centre frequency,
 $A=0.1$
is amplitude and
 $b=4\times 10^{3}$
is the spreading function. We consider two values for
 $Q$
,
 $Q=\sqrt{D}$
and
 $Q=1.95\sqrt{D}$
. Figure 13 shows why we have chosen these two values for
 $Q$
, with (a,c,e) showing the case for
 $Q=\sqrt{D}$
, plotting
 $\hat{f}^{+}(k)$
and
 $\unicode[STIX]{x1D714}^{+}$
and
 $\unicode[STIX]{x1D714}_{-}$
. Both
 $\unicode[STIX]{x1D714}^{+}$
and
 $\unicode[STIX]{x1D714}_{-}$
are monotonic functions of
 $kh$
. We will obtain a dispersive wave packet which propagates to the right. For the case when
 $Q=1.95\sqrt{D}$
shown in (b,d,f) we have two points of blocking and negative energy waves for both
 $\unicode[STIX]{x1D714}^{+}$
and
 $\unicode[STIX]{x1D714}_{-}$
. We can also see that the frequencies for which
 $\hat{f}^{+}(k)$
is non-negligible but small lie largely between the two blocking points for
 $\unicode[STIX]{x1D714}^{+}$
. This means that the surface waves excited will largely be negative energy waves, i.e. waves with positive phase velocity and negative group velocity. For
 $\unicode[STIX]{x1D714}^{-}$
the range of
 $\hat{f}^{+}(k)$
extends above and below the blocking points. This means that the internal wave excited will consist of both positive and negative energy waves.
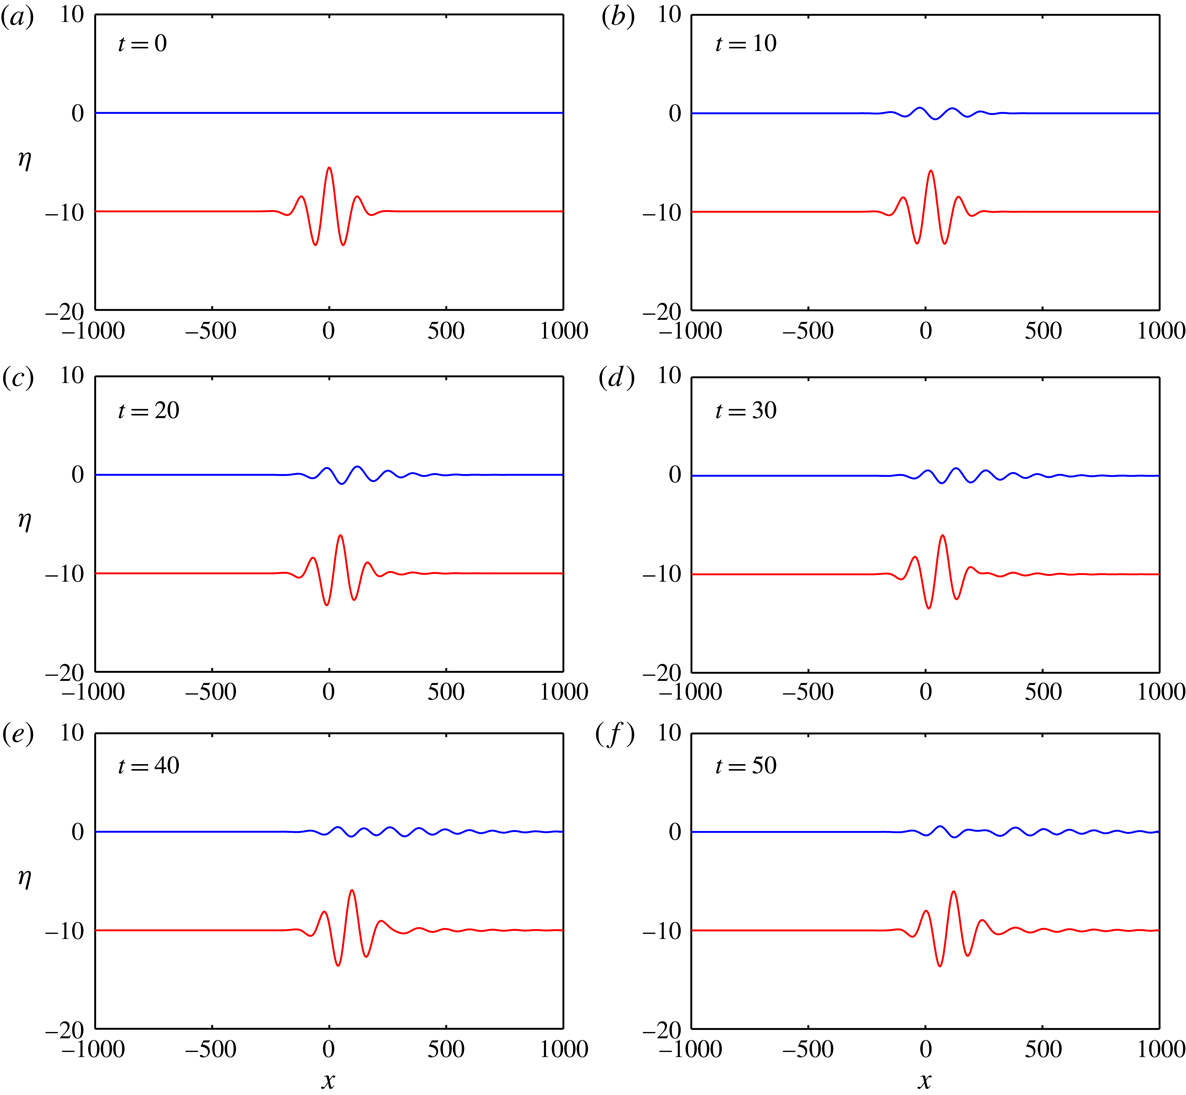
Time-domain simulation of waves for the case of
 $\hat{f}^{+}(k)$
given by (7.6) for the times shown. The top blue curve is the wave at the surface and the lower red curve is the wave at the interface. In this case
 $Q=\sqrt{D}$
. These figures are taken from Movie 1.

Figures 14 and 15 show the time-domain simulations for the cases of figures 13(a,c,e) and 13(b,d,f) respectively. These figures are taken from Movie 1 and Movie 2 respectively, available at https://doi.org/10.1017/jfm.2018.617; the supplementary material also contains a file to generate these time-domain simulations. We show the wave at the surface in blue and the wave at the interface in red. Note that the amplitude should be considered exaggerated as we are considering only the linear case. For the case in figure 14 the wave packet progresses to the right. The solution consists of surface and internal waves which exactly cancel at
 $t=0$
at the surface. The group speed of the surface wave is higher than that of the internal wave. Also, note that the amplitude of the internal wave at the interface must necessarily be large so that it can cancel the wave at the surface. Figure 15 is the equivalent plot except
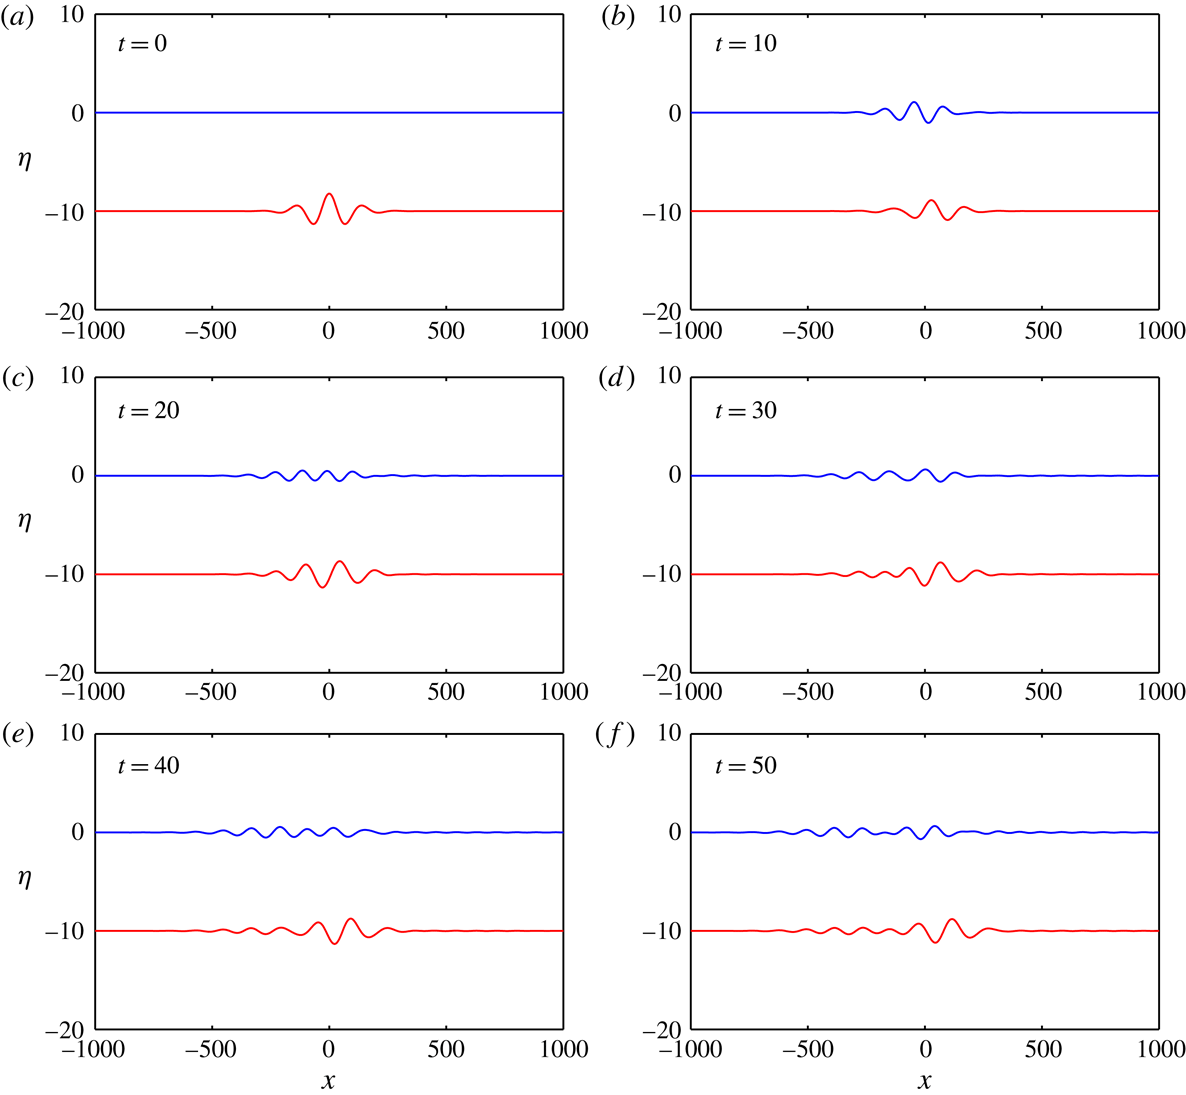
 $Q=1.95\sqrt{D}$
. In this case, the behaviour is much more complicated and interesting. We see strong negative energy waves which propagate to the left, even though they have positive phase speed and the wave crests move to the right. The effect of blocking is clear, and a significant part of the wave packet remains localized. We can also see that the surface wave is dominated by negative energy waves as expected, while the internal wave has both positive and negative energy waves.
As in figure 14 except that
 $Q=1.95\sqrt{D}$
and the figures come from Movie 2.

8 Conclusion
In the present study, the dynamics of blocking, associated with flexural-gravity wave motion in a two-layer fluid having an ice/plate covered surface and an interface in the presence of a compressive force, is investigated. Within the trapped energy zone, wave blocking occurs in both the surface and internal modes, and the corresponding dispersion relations have three positive roots, two of which coalesce at the point of blocking, whereas all three roots coalesce at the point of inflexion, which is contrary to the earlier assumption of two distinct positive roots. Moreover, the conditions for coalescence of the frequency in the surface and the internal modes are obtained under the deep water approximation. Furthermore, the conditions on the frequency and the group velocity for coalescence are obtained, and the existence of higher phase velocity and rate of energy propagation in the internal mode is shown under certain conditions. Under the shallow water approximation, when the interface is located approximately in the middle of the water depth, the phase speed in the surface and the internal modes attain minima and maxima respectively. The analysis of the amplitude ratio of waves in the interface to that of the surface modes reveals the dead water analogue in flexural-gravity waves in a two-layer fluid when the density ratio approaches unity. The present study will supplement the understanding of the stability/failure mechanism of very large floating structures and the process of ice breaking in a stratified marine environment.
Acknowledgements
M.H.M. acknowledges the Indian Institute of Technology Kharagpur for inviting him to offer a short-term course (Course Id. 16IWT10) under the Global Initiative of Academic Networks (GIAN) at IIT Kharagpur, that initiated the collaborative work. M.H.M. would also like to thank the Isaac Newton Institute for Mathematical Sciences, Cambridge, for support and hospitality during the programme ‘Mathematics of Sea Ice Phenomena’, when part of the work on this paper was undertaken. This work was supported by EPSRC grant number EP/K032208/1 and was also partially supported by a grant from the Simons Foundation. This material is based upon research supported by, or in part by, the US Office of Naval Research under award number N0001415-12611. T.S. acknowledges the partial support from Department of Science and Technology, Government of India, through grant number DST/CCP/CoE/79/2017(G). M.H.M. and S.D. were also supported by the ARC Training Centre for Advanced Technologies in Rail Track Infrastructure IC17010006. S.D. acknowledges the support received from IIT Kharagpur, India, as a Post-Doctoral Fellow during which the work was initiated, and the support received from SRM University AP – Amaravati, India, as a faculty during which a part of the research work was pursued.
Supplementary movies
Supplementary movies are available at https://doi.org/10.1017/jfm.2018.617.