Introduction
One challenge for the environmental assessment of agricultural systems is to progress from estimating whether one farming system has fewer impacts than another to estimating whether or not it can be considered environmentally sustainable. Although the concept of sustainability has many definitionsReference Bosshard1–Reference Mebratu3, it has been accepted as humanity's goal to pursue since the Brundtland Commission report4.
Sustainable development of agriculture is of great importance not only because agriculture frequently is associated with resource depletion and environmental impacts but also because agriculture has been recognized as key to the conservation of certain vital ecosystems and the promotion of sustainability5. This study focuses on the environmental sustainability of farming systems, particularly as defined and applied in existing impact assessment methods; few of these methods, however, quantitatively define environmental sustainabilityReference van der Werf and Petit6. For example, life-cycle assessment (LCA) is a widely used indicator-based method that compiles and evaluates the inputs, outputs and potential environmental impacts of a production system. One advantage of using LCA for environmental analysis is that it considers global and local emissions linked to a service or a productReference Jolliet, Saadé and Crettaz7. It is used most often to compare production systems, identifying those that appear environmentally ‘better’ because they have less impact, but it does not indicate whether these systems are environmentally sustainable (e.g., if their ‘polluting emissions and … use of natural resources can be supported in the long term by the natural environment’Reference Payraudeau and van der Werf8). As environmental sustainability remains such an important future-oriented conceptReference Goeminne and Paredis9, methods to define thresholds for it have been the subject of several previous studiesReference Groffman, Baron, Blett, Gold, Goodman, Gunderson, Levinson, Palmer, Paerl, Peterson, Poff, Rejeski, Reynolds, Turner, Weathers and Wiens10–Reference Brink, Miller, Kettunen, Ramsak, Farmer, Hjerp and Anderson12. However, no common definition of environmental sustainability has come to the fore in sustainability assessment.
In this paper, we propose, estimate and apply ‘reference values’ (RVs)Reference Acosta-Alba and van der Werf13, which explicitly define threshold levels of emissions or energy use that farming systems must not exceed to be considered environmentally sustainable. Unlike other methods, RVs can quantify the conceptual ‘distance’ to sustainability by allowing multiple targets and evaluating the influence of farm characteristics on this distance. We applied RVs to potential environmental impacts of dairy farms in Brittany, France, to assess to what extent these farms comply with the goals defined by the RVs and, more generally, to explore how RVs can be used to identify characteristics of farming systems with lower environmental impact. We also discuss potential trade-offs between environmental sustainability and food production.
Materials and Methods
Impact assessment
We used the EDEN-E toolReference van der Werf, Kanyarushoki and Corson14, based on LCA methodology, to evaluate the environmental interventions (i.e., resource extractions, pollutant emissions and land use) and potential environmental impacts of dairy farms. According to the International Organization for Standards, LCA ‘addresses the environmental aspects and potential environmental impacts (e.g., use of resources and environmental consequences of releases) throughout a product's life cycle from raw material acquisition through production, use, end-of-life treatment, recycling and final disposal (i.e., cradle-to-grave)’15. EDEN-E assesses the impacts of climate change, eutrophication, acidification, terrestrial ecotoxicity, land occupation and non-renewable energy (NRE) use from the acquisition of raw materials to the exit gate of the farm. Traditionally, LCA is a site- and time-independent tool that does not consider where and when environmental interventions take place, mainly because it is difficult to gather site-specific information for all sites included in an LCAReference Finnveden and Nilsson16. Site dependence in EDEN-E was introduced by distinguishing ‘direct’ (on the farm site) environmental interventions from ‘indirect’ (associated with production and supply of inputs used on the farm) environmental interventions. The method thus distinguishes an ‘on-farm’ component and an ‘off-farm’ component for each impact considered. Potential impacts are expressed per each of three functional units: 1000 litres of milk sold, 1 ‘global’ hectare of land occupied (on- and off-farm) and 1000 € of gross farm income. In LCA, functional units address the primary functions fulfilled by a production systemReference Guinée, Gorrée, Heijungs, Huppes, Kleijn, Koning, de Oers, Wegener, Suh, Udo de Haes, Bruijn, Duin and Huijbregts17; for EDEN-E, these functional units represent agricultural production, land use and revenue generation, respectively. On-farm hectares correspond to a farm's usable agricultural area (UAA), whereas off-farm hectares correspond to the estimated amount of land needed to produce a farm's crop-based inputs (e.g., concentrated feed, fodder and bedding). For example, the off-farm area required to produce 1 kg of concentrated feed elsewhere than on the farm is a sum of the area necessary to produce the given quantity of each of its agricultural ingredients, which itself is a function of the ingredient's yield per hectare and post-yield processing (e.g., soybean area divided between soybean oil and soybean meal). EDEN-E contains a questionnaire to collect data about farm inputs and outputs, housing and manure-management systems, manure application techniques, crops grown, and grazing and feeding strategies. Additional data come from documents such as accounting or record books for fertilization, pest treatments and milk production. EDEN-E estimates on-farm emissions from farm-gate balances and off-farm emissions from public data18–Reference Davis and Haglund21 and unpublished data from the French National Institute for Agronomic Research (INRA) in Rennes. Total emissions are aggregated into impact categories using characterization methodsReference Guinée, Gorrée, Heijungs, Huppes, Kleijn, Koning, de Oers, Wegener, Suh, Udo de Haes, Bruijn, Duin and Huijbregts17.
Selection of environmental impacts and their indicators
In this study, we focused exclusively on environmental impacts per hectare of land. As mentioned, one implicit function of agricultural systems is land use via the occupation of surface area. Expressing impacts per hectare rather than per unit mass of agricultural product better reflects the assumption that sustainability of agricultural systems depends on the Earth's area-limited capacity to support their emissions and use of resources. Although production efficiency is an important goal of agricultureReference Haas, Wetterich and Geier22, agricultural production ultimately remains more limited by the surface area available than by production capacity.
We chose to focus on three major environmental impacts of dairy farms: climate change (CC), a global impact; water-quality degradation (WQ), a regional impact; and NRE use, a resource-depletion impact. For these impacts, societal objectives have been expressed in science-based policy documents, as detailed below. CC and WQ influence important ecosystem functions, such as climate regulation, water supply and nutrient cyclingReference De Groot, Wilson and Boumans23. Although farming systems focus on transforming solar energy into biomass, they currently depend greatly on direct and indirect inputs of NRE. Depletion of NRE sources to a point that would restrict the supply of inputs therefore could have a dramatic impact on farming systems.
CC is defined as the impact of emissions on the radiation absorption of the atmosphereReference van der Werf, Kanyarushoki and Corson14. Methane (CH4) from enteric fermentation and manure management were calculated according to the Tier 2 method proposed by the Intergovernmental Panel on Climate Change (IPCC)24 as a function of animal subcategories, milk production and manure-management systems. Nitrous oxide (N2O) emissions were estimated by emission factors from the IPCC25. Gaseous N emissions from farms vary according to factors such as the total quantity of N excreted by livestock, excretion on pasture or in a building, type of manure, storage conditions and technology used in manure application on fields. Following the recommendations of other LCA studiesReference Guinée, Gorrée, Heijungs, Huppes, Kleijn, Koning, de Oers, Wegener, Suh, Udo de Haes, Bruijn, Duin and Huijbregts17, the indicator for a farm's global warming potential over a 100-year time horizon (GWP100) was calculated as its annual greenhouse-gas (GHG) emissions expressed in kg of carbon-dioxide (CO2) equivalents, based on the most recent characterization factors from the IPCCReference Forster, Ramaswamy, Artaxo, Berntsen, Betts, Fahey, Haywood, Lean, Lowe, Myhre, Nganga, Prinn, Raga and Van Dorland26 in kg of CO2 equivalents: CO2:1, N2O:298, CH4:25.
NRE represents the annual quantity of NRE used by a farm, calculated in an indicator that sums in a single unit (GJ) the lower heating values of energy carriers used. All on- and off-farm processes (e.g., input manufacture and agricultural production) that used NRE sources (e.g., petroleum, coal and natural gas) were included in this calculation. For CC and NRE, both global concerns, we expressed impacts per ‘global’ hectare (on- and off-farm), which represents each farm's direct and indirect potential impacts.
WQ focuses on nitrate emissions, calculated as an indicator of the annual quantity of nitrogen leached as nitrate (kg N-NO3) per hectare of on-farm area (excluding off-farm area, since impacts of a farm's nitrate emissions are more regional than global). We assumed that the annual quantity of nitrate-N that a farm leached into groundwater equaled its annual farm-gate N balance after subtracting gaseous N emissions (i.e., the difference between input from NH3 atmospheric deposition, purchased feed and fertilizers and outputs of crops and gaseous emissions of NH3, NO, N2O and N2). Although this method for estimating nitrate leaching risks oversimplification and accumulation of uncertainties, previous works based on field measuresReference Payraudeau, van der Werf and Vertès27 in the area and a Monte Carlo analysisReference Payraudeau, van der Werf and Vertès28 confirm its robustness.
RV specification
Environmental analyses often exclude setting indicator RVs, an important stepReference Basset-Mens, Small, Paragahawewa, Lagevin and Blackett29–Reference von Wiren-Lehr31. Among methods that include them, the Framework for Evaluating Sustainable Land Management (FESLM) method recommended setting criteria and threshold valuesReference Smyth and Dumanski32. Thresholds indicate points at which significant changes in a system may occur. More recently, authors have set RVs according to policy targets that describe a maximum critical flowReference Frischknecht, Steiner, Braunschweig, Egli and Hildesheimer33 or to science-based objectives, both of which can demonstrate sustainability ‘gaps’Reference Ekins and Simon34. The main concerns, however, remain how to estimate RVs and how to use them to identify and recommend changes that could move systems closer to sustainability.
The RVs we propose fall into two categories: ‘relative’ and ‘normative’Reference Acosta-Alba and van der Werf13. Relative RVs are based on the average value of an indicator for a group, a region or industrial sector (at one point or over time), while normative RVs are based on target values and thresholds. Target values represent desirable conditions, while thresholds are minimum or maximum levels or ranges of acceptable values that should not be exceededReference van Cauwenbergh, Biala, Bielders, Brouckaert, Franchois, Garcia Cidad, Hermy, Mathijs, Muys, Reijnders, Sauvenier, Valckx, Vanclooster, Van der Veken, Wauters and Peeters35. Thresholds can also be defined as values for which a minor quantitative variation would have relatively large effects on the qualitative state of the system. Relative RVs are derived from indicator values of a given population (here, a set of farms) or from a sub-population (e.g., farms having lower impacts). In contrast, normative RVs are determined either based on scientific knowledge or government policies (which are expected to have a scientific basis) or derived from values for pristine nature, a past state or the current natural environment.
We set relative and normative RVs for the three impacts considered in this study. We defined relative RVs as the lower quartile of GHG emissions (CCrel), nitrate emissions (WQrel) and non-renewable energy use (NRErel) of a sample of farms for CC, WQ and NRE impacts, respectively. Lower quartile values are familiar to farmers because extension personnel use them to define target values for technical parameters (e.g., animal growth rate and crop yield)Reference Ondersteijn, Harsh, Beldman and Huirne36. In contrast, we based normative RVs on several science- and policy-based sources, sometimes resulting in several RVs for the same impact, as described below.
Climate change
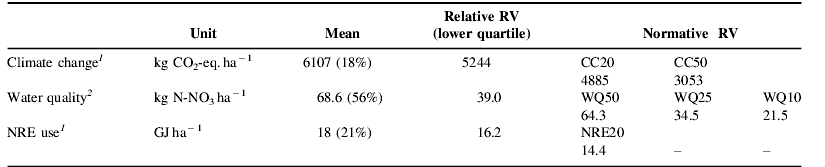
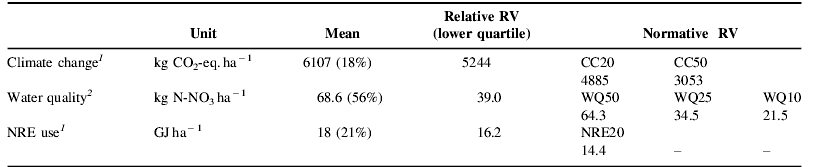
For CC, two normative RVs were based on European Union (EU) commitments37, in which France pledged to reduce its total GHG emissions by 20% by 2020 (CC20) and by 50% by 2050 (CC50). We calculated the value of these normative RVs by subtracting the percentage decrease in total or gas-specific emissions from the mean annual GHG emissions of the sample of dairy farms under consideration (Table 1).
Mean impact values (and CV) for the 45 dairy farms and relative and normative RVs. Normative RVs for climate change: CC20 and CC50. Normative RVs for water quality: WQ50, WQ25 and WQ10. Normative RV for NRE use: NRE20.
1 Per on- and off-farm hectare.
2 Per on-farm hectare.
Water quality
The impact of water quality on human and ecosystem health is a function of its nitrate concentration, among other characteristics38. In Brittany, nitrate emissions to surface water can render drinking water non-potableReference Merot, Aurousseau, Gascuel-Odoux and Durand39 and, once transferred to rivers, cause significant coastal eutrophicationReference Ménesguen40. The EU's Drinking Water Abstraction Directive41 and Nitrates Directive42 recommend a surface-water nitrate concentration less than or equal to 25 mg NO3 l−1 and mandate a maximum concentration of 50 mg NO3 l−1, which we adopted as two normative RVs (WQ25 and WQ50, respectively). We based a third normative RV, focused on ecosystem health, on research by MénesguenReference Ménesguen40 in Lannion Bay, one of the sites most affected by coastal algal blooms in Brittany, where greatly reducing algal blooms would require a maximum concentration of 10 mg NO3 l−1 in surface waters (WQ10).
To estimate the per-hectare amounts of farm nitrate leaching that would lead to reaching these three nitrate-concentration limits, we reversed a method, proposed by Payraudeau et al.Reference Payraudeau, van der Werf and Vertès27, that estimated the mean annual nitrate concentration of water draining from agricultural fields in Brittany as a function of annual effective rainfall (precipitation minus evapotranspiration) and farm nitrate. Transforming these limits of nitrate concentration in regional surface waters into per-hectare RVs of farm nitrate losses first required considering the influence of wetlands and non-agricultural land uses. Since we were interested in coastal eutrophication, denitrification was considered at a scale larger than the farm. At watershed scales and above, wetland denitrification can decrease nitrate concentrations by approximately 1 mg l−1 per percent of wetland surface presentReference Montreuil and Merot43 (P. Merot, personal communication). In Brittany, wetlands represent 10% of the surface area. Next, we assumed that 20% of Brittany's surface area does not leach nitrates (e.g., forests and fallow agricultural land); thus, water flowing from this area would dilute surface-water nitrate concentrations (P. Durand, personal communication). Consequently, the three nitrate concentration limits were increased by 10 mg l−1 to account for eventual wetland denitrification, then divided by 0.8 to estimate nitrate limits only for the land from which nitrate leaches. To represent long-term temporal variability, mean annual effective rainfall over the past decade in Brittany was used as input data44. We did not consider denitrification at the farm scale and assumed that the mineral N content of the soil remained constant over the long term. Based on these assumptions, nitrate concentrations of 50, 25 and 10 mg NO3 l−1 for normative RVs corresponded to 64.3, 37.5 and 21.5 kg of nitrate-N leached per on-farm hectare, respectively (Table 1).
NRE use
The EU proposed a target of 20% of gross inland energy consumption coming from renewable sources by 202045 to reduce GHG emissions and slow climate change. In consequence, we estimated a normative RV (NRE20) equal to 80% of the mean annual NRE use of the sample of dairy farms under consideration (Table 1).
Application to dairy farms
We calculated RVs for this study based on the estimated emissions and NRE use of 45 dairy farms in Brittany. The 39 conventional and six organic farms belong to the ETRE and BIO dairy-farm networks in Brittany, respectively, which consist of farms selected for above-average economic performance. These networks aim to share the data necessary to analyze and characterize the functioning and management of these farms and draw lessons for economically challenged dairy farms (F. Roger, personal communication). These farms represent a subset of the 47 farms analyzed in van der Werf et al.Reference van der Werf, Kanyarushoki and Corson14 for which sufficient data were available regarding crop rotations, land use for animal and crop production, and quantities of crops sold. In Brittany, most dairy farms produce both crops and animal products, except for dairy farms based solely on pastures. Management of the milk-production system thus depends on crop production, which either can be fed to cattle on the farm or sold. We decided not to exclude non-dairy production because the dairy farms studied relied on interactions between animal and crop production. Thus, to aggregate milk with other products that could be consumed by humans, we calculated the nutritional energy and protein contents of the plant and animal products soldReference Souci, Scherz, Fachmann, Kraut and Senser46, Reference Sauvant, Perez and Tran47 and summed each set to estimate total production of energy and protein. Both were expressed per ha of on- and off-farm area occupied because milk production required crop input from off-farm fields.
For each impact category and RV, we placed farms into two groups: those whose potential impact per ha exceeded the RV (‘above’) and those for which it did not (‘below’). Results of this step led us to continue the analysis with only the most severe RV for each impact category for which at least six farms qualified: CC20, WQ25 and NRE20. We calculated and compared mean characteristics, inputs, outputs and potential impacts for each group, identifying significant (P<0.05) differences with the non-parametric Mann–Whitney test.
Results
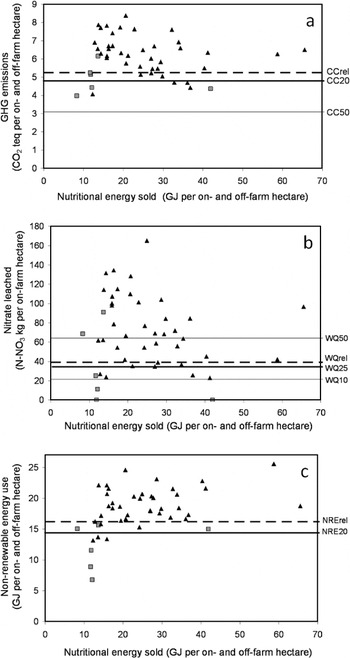
Variability among farms was large for the impacts considered and for nutritional energy production, with coefficients of variation ranging from 18% for CC to 56% for WQ (Table 1, Fig. 1). GHG emissions per hectare (on- and off-farm) varied from 3979 to 8380 kg CO2 eq., N-NO3 emissions per on-farm hectare varied from 0 to 165 kg, NRE per hectare (on- and off-farm) varied from 6.7 to 25.6 GJ and nutritional energy production per hectare (on- and off-farm) varied from 8.3 to 65.5 GJ (Fig. 1). Organic farms had lower mean impacts and nutritional energy production than conventional farms (Fig. 1). Values for the three impacts were significantly but weakly correlated with each other (r 2=0.13–0.19), while total protein and nutritional energy production each were significantly, but weakly, correlated with NRE (r 2=0.14 and 0.18, respectively). The strongest correlation observed (r 2=0.49) was that between NRE and total protein production.
Relative (dashed lines) and normative (solid lines) RVs superimposed on estimates from the 45-farm sample of organic (squares) and conventional (triangles) dairy farms for (a) GHG emissions, (b) nitrates leached and (c) NRE use, all expressed by nutritional energy sold.

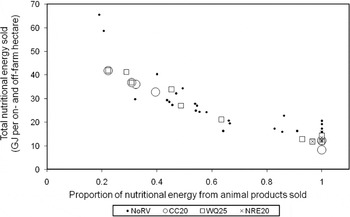
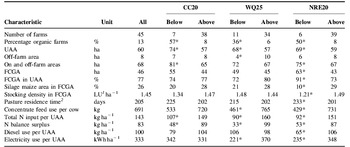
By definition (i.e., lower quartile of the population), 11 farms were below each of the relative RVs (Fig. 1). For normative RVs, seven farms were below CC20, whereas none was below CC50. For WQ, 22 farms were below WQ50, 11 below WQ25 and three below WQ10. For NRE, six farms were below NRE20 (Table 2). Compared to farm groups above the normative RVs CC20, WQ25 and NRE20, groups below each of them had a higher percentage of organic farms, larger mean UAAs, longer mean pasture residence time and usually a lower input level, especially of concentrate feed and nitrogen (Table 3). The mean percentage of fodder crops and grass area (FCGA) in the UAA was significantly larger for the group below NRE20, whereas the percentage of silage maize area in the FCGA was significantly smaller for this group (Table 3). The contribution of animal products to total nutritional energy produced per hectare varied from 19 to 100%, with total nutritional energy decreasing exponentially as the fraction provided by animal products increased (Fig. 2).
Distribution of farms according to the proportion of total nutritional energy sold that came from animal products (milk and meat). Circles, squares and crosses represent farms below the CC, WQ and NRE use RVs, respectively, while black dots represent farms above all three RVs. Certain farms are represented by two symbols.

Number of farms in a sample of 45 below relative and normative RVs for CC, WQ and NRE use impacts.

1 Per on- and off-farm hectare.
2 Per on-farm hectare.
Annual mean values of characteristics of the 45 farms (All) and subgroups whose impacts were below or above RVs for CC20, WQ25 and NRE20 use. Differences between farms below or above RVs are significant at P<0.05 (*).

1 LU: French livestock unit48.
2 Pasture residence time per day with at least 8 h of pasture, summed and converted to days.
FCGA, fodder crops and grass area; UAA, usable agricultural area.
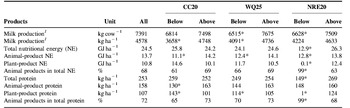
A farm group below a given RV tended to have lower mean milk production per cow and per hectare; consequently, it produced significantly less mean nutritional energy per hectare from animal products than the group above the same RV, but only the group below CC20 produced significantly less protein per hectare from animal products (Table 4). As for mean total nutritional energy and protein, only the group below NRE20 produced significantly less than the group above it, due to its near-zero mean production of plant products (Table 4). Farms below WQ25 and CC20 were found across the range of animal-product share in total nutritional energy produced, whereas, as mentioned, farms below NRE20 produced almost exclusively animal products (Fig. 2).
Annual mean production values per hectare of on- and off-farm areas for all farms (All) and subgroups whose impacts were below or above RVs for CC20, WQ25 and NRE20 use. Differences between farms below or above RVs are significant at P<0.05 (*).

1 Fat- and protein-corrected milk, i.e., 0.337+0.116×fat+0.06×protein×kg milk producedReference Thomassen and de Boer49.
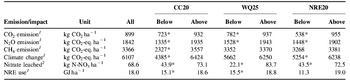
Nearly all groups below a given RV had significantly lower mean CO2, N2O and total GHG emissions than the group above the corresponding RV (Table 5). The difference in mean total GHG emissions between groups below and above a given RV was largest for CC20 (2039 kg CO2-eq. ha−1), mainly due to the difference in mean CH4 emission. For WQ25, lower (but non-significant) GHG emissions resulted mainly from significantly lower mean emission of N2O, whereas for NRE20 they resulted from significantly lower mean emissions of CO2 and N2O. The difference in nitrate leached between groups below and above a given RV was larger for WQ25 (61.6 kg ha−1) than for CC20 (29.2 kg ha−1) or NRE20 (29 kg ha−1). The difference in NRE between groups below and above a given RV was larger for NRE20 (7.7 GJ ha−1) than for CC20 (3.5 GJ ha−1) or WQ25 (3.3 GJ ha−1) (Table 5).
Estimated annual mean GHG emissions, nitrate leached and energy use per hectare for the 45 farms (All) and subgroups whose impacts were below or above RVs for climate change (CC20), water quality (WQ25) and non-renewable energy use (NRE20) use. Differences between farms below or above RVs are significant at P<0.05 (*).

1 Per on- and off-farm hectare.
2 Per on-farm hectare.
Discussion
Correlations among impacts and production
The significant correlation between each pair of impacts indicates the existence of a positive relation between them (i.e., lower impacts in one category did not necessarily come at the cost of higher impacts in another category), but their low strength reflects the high inter-farm variability. In contrast, the relatively strong correlation between NRE and total protein production indicates the high dependence of food production on external fossil-energy inputs (e.g., diesel, machinery and fertilizers).
Differences between farm groups
Groups of farms below RVs used fewer inputs per unit area, resulting in less undesired output (e.g., GHGs and nitrate); however, the group below NRE20 also produced significantly less food per unit area. These farms (half of them organic), with the longest pasture residence time, the lowest stocking density, the lowest concentrate feed use per cow and the lowest diesel use per ha of UAA, focused fully on low-input grazing-based milk production, thereby producing significantly less nutritional energy and protein per hectare due to the lack of crop production.
Attaining the WQ25 RV was a feasible objective for organic (4/11) and conventional farms (7/11), since a small surplus N balance, important for ensuring sufficient N availability for crops, was conserved. These farms have the lowest off-farm area used, and a relatively low proportion (70%) of protein produced from animal products. In French dairy systems, some reduction in WQ impacts can be reached without major changes by optimizing feed strategies and pasture management or reducing stocking ratesReference Chambaut, Le Gall, Pflimlin and Ménard50.
Farms below the CC20 RV produced significantly less nutritional energy and protein from animal products and more from plant products than the farms above this RV. The CC20 RV was attained mainly not only by organic systems (4/7) but also by some highly intensive conventional systems. For the organic systems, lower emissions per hectare were explained by their larger size and relatively low use of inputs. For intensive conventional systems, it was closely linked to increased milk production per cow, which can reduce GHG emissions by producing the same quantity of milk with fewer cowsReference Casey and Holden51.
Variability among farms within each production mode makes analysis of differences between organic and conventional farms difficult. Results seem to indicate, however, that all systems may move toward environmental sustainability even though, according to production mode and intensity, some potential impacts are easer to reduce than others. For instance, more conventional farms attained the WQ RV than attained the CC RV, while the conventional farms attaining NRE RV were exclusively grass-based systems.
Defining RVs
Fortunately, legislative norms and policy objectives were available to help define normative RVs. The difference in the dates of origin of these objectives reflects longstanding concern over WQ and more recent worries about CC. For simplicity, we assumed a reduction target of the normative RVs for dairy farms equal to the overall reduction target (e.g., 20% fewer GHG emissions by 2020). One can, however, define RVs based on sector-specific targets, which may require, for example, the transportation sector of an economy to reduce emissions or energy use more than the agricultural sector. Interestingly, the two strictest WQ RVs (WQ25 and WQ10) represented relative reductions (56 and 69%, respectively) similar to that for the strictest CC RV, CC50 (50%). Despite this relative similarity, no farms attained CC50, whereas three farms (all organic) attained WQ10; the lower variability of CC than WQ impacts reflects the greater difficulty in reducing GHG emissions on farms than nitrogen losses. Although the relatively modest reduction (20%) of the NRE normative RV (NRE20) placed it within reach for six farms, farms that attained it produced hardly any plant products, unlike those that attained other RVs.
The fact that dairy farms in the sample had above-average economic performance (implying better farm management) suggests that our relative RVs may be lower than those that would be calculated for a larger, more representative sample of French dairy farms. In addition, the ratio of organic to conventional farms in the sample of 6:39 (15%) is larger than that found among all dairy farms in Brittany (2%), which may have influenced the values of relative and certain normative RVs. Also, our normative RVs for CC and NRE were not independent of the values in the farm sample. Thus, given the influence of sample means on RVs, it appears more appropriate to calculate them using larger and more representative sample sizes, such as region- or country-level means of a given type of farm.
More accurate RVs may be established by fate modeling, especially for regional impacts such as water quality, where landscape plays an important role. For instance, WQ was complicated to estimate due to its local nature. Although using farm-gate N balance (including deposition and volatilization) to estimate nitrate pollution may be an interesting means-based indicator of the N-management efficiency of farmsReference Schröder, Scholefield, Cabral and Hofman52, it does not consider the influence of environmental factors such as soil and climate on pollutant fate. We suggested a simple method to estimate denitrification and dilution processes at the watershed scale to set the WQ RV, converting a stream nitrate concentration into an equivalent amount of nitrogen leached from fields.
Although systems should be evaluated periodically to chart their progression toward sustainabilityReference Lopez-Ridaura53, RVs must be established for the long term. Thus, whenever possible, annual variability in potential impacts should be taken into account when defining RVs. In the case of WQ, according to previous studies in BrittanyReference Chardon54, inter-annual variation in nitrate leaching can be explained mainly by two factors: soil-N stocks at the beginning of winter and annual mean rainfall. The first depends on crops, crop management and soil, which were assumed in our study not to vary over the long term. The second was included by using the mean annual effective rainfall during the past decade in the region44. To improve estimation of this RV, these factors could be represented better with simulation models such as MelodieReference Chardon54, a whole-farm model, or TNT2Reference Beaujouan, Durand, Ruiz, Aurousseau and Cotteret55, which simulates nitrogen dynamics in watersheds.
All hypotheses and assumptions made to define an RV must be explained clearly to refine RVs in the future. Developing RVs based on ecological thresholds could be an interesting future goalReference Groffman, Baron, Blett, Gold, Goodman, Gunderson, Levinson, Palmer, Paerl, Peterson, Poff, Rejeski, Reynolds, Turner, Weathers and Wiens10. Priority should be given to normative RVs when enough data exist to set them. Multiple RVs are consistent not only with multiple sources of knowledge but also with graduated stages toward sustainability goals. FrickerReference Fricker2 and Fischer et al.Reference Fischer, Manning, Steffen, Rose, Daniell, Felton, Garnett, Gilna, Heinsohn, Lindenmayer, MacDonald, Mills, Newell, Reid, Robin, Sherren and Wade56 introduced a temporal scale to attain sustainability that varies over time. Thus, while we have objectives to attain in the next 20 years, we should keep in mind objectives needed to maintain sustainability in 50 or 100 years. Reaching long-term objectives may require more drastic changes in farming systems and society than reaching short- or medium-term objectives.
Other, more ambitious, goals could be used to define normative RVs. An earlier French objective, suggested by a workshop of experts from several fields (e.g., academia, industry and NGOs), aimed to reduce GHG emissions by 75% by 2050Reference De Boissieu57. This goal, however, does not consider what proportion of the overall reduction should come from reducing emissions of each of the three main GHGs (CH4, N2O and CO2). In contrast, Anderson and BowsReference Anderson and Bows58 argue that, specifically, CO2 emissions from fossil-energy use and deforestation should be eliminated to avoid dangerous CC (i.e., increasing mean global temperature >2°C). Since emissions of the other two GHGs (CH4 and N2O) are associated with agriculture (and therefore impossible to eliminate), they proposed reducing them by 50% by 2050Reference Anderson and Bows58. Dairy systems evaluated in our study, however, could reduce, but not halve, their CH4 emissions if they want to maintain the same milk-production level.
Applying RVs
Relative RVs may be easier to implement in policies because farmers may prefer being evaluated in relation to their current performance and that of their peers. They also may prefer, however, to be evaluated according to RVs for their mode of production (e.g., organic). For example, conventional farmers may balk at RVs that were calculated with emission values per hectare from organic farms. Similarly, pig farmers may not wish to follow the same RVs as dairy farmers, and vice versa. Complicating things further, the number and type of farms in a given area (e.g., watershed) may influence the RV that each of them has to follow (e.g., areas with more forest and areas with more pig farmers). Plus, when farm-site characteristics such as groundwater depth or climate influence local impacts, farmers may call for methods of RV calculation that explicitly consider these site characteristics.
Sustainable agricultural systems and food production
There is no single path to sustainability of any farm type. Analysis of technical and management changes is an important step toward sustainable systemsReference von Wiren-Lehr31. The characteristics of low-impact dairy farms identified in this study (low energy and N input for organic systems, high milk production per cow for intensive conventional systems) could be adopted by other dairy farms to reduce the potential CC and WQ impacts of milk production without necessarily decreasing the total amount of nutritional energy or protein produced. Other management options for decreasing CC and WQ impacts exist, however, such as producing more total nutritional energy by decreasing milk production and increasing crop production for human consumption. As our results indicated, however, reducing NRE while maintaining milk- and especially crop-production levels is more difficult due to the relatively strong correlation between farm inputs and productivity.
Expressing farm production by total nutritional energy considers all farm products and responds to the desire to connect agricultural research with nutritional sciencesReference Peters, Wilkins and Fick59–Reference Kratochvil, Kaltenecker and Freyer62, especially now that CC threatens the ability to feed an increasing population with limited natural resources. According to our results, management options that would decrease milk production in favor of crop production would not require a major transformation of systems for dairy farms that already produce and sell crops. Alternative production scenarios may be more limited for pasture-based dairy farms that have no crop production. These farms may explore other options, such as optimizing pasture management and continuing to reduce inputs.
Currently, reconciling human food security and environmental sustainability may depend on the ability to adapt farming systems to produce the same amount of nutritional energy with a larger proportion of crops and less animal production. In environmental assessment, quantifying nutritional energy and having the surface area used (on- and off-farm) as the unit of environmental assessment help identify low-impact farms without focusing on a particular agricultural product. This is especially important for farming systems that produce several products (e.g., milk, meat and crops).
Per hectare RVs can supply complementary information to stakeholders involved in environmental assessment of agricultural products. Currently, many countries are in the process of placing carbon labels on their agricultural products. As carbon labels express CC impacts per unit of mass, potentially favoring highly productive systems, the impact-per-area approach of defining low-impact systems that RVs provide may serve as an appropriate complement.
Conclusion
RVs are an attempt to measure environmental sustainability by accounting for environmental requirements and selecting systems that respect those requirements, in contrast to current evaluation methods, which merely identify systems that pollute less. RVs are a useful approach to quantify and represent how far systems may lie from sustainability policies, regulations or goals. They can be used in an iterative process to guide farming systems to environmental sustainability. RVs can be used at the farm scale as demonstrated in this paper; they also can be used at a regional scale to explore scenarios of sustainable development. Although RVs may be difficult to establish, they render sustainability goals more concrete and operational.
The use of RVs has several advantages: (i) clearly expressing which sustainability objectives have been chosen; (ii) quantifying the conceptual ‘distance’ between current systems and those objectives; (iii) identifying technical and management practices to improve in existing systems; and (iv) working with common existing indicators. Once RVs have been defined, they can be adapted to a variety of environmental assessment methods since they are established for individual indicators.
Reconciling human food security and environmental sustainability may depend on the ability to adapt farming systems to produce the same amount of nutritional energy with a larger proportion of crop products and fewer animal products. The distance between normative RVs and indicator values of dairy farms suggest that production and consumption of agricultural products will need to change if sustainability goals do not.
Acknowledgement
This research was supported by the French National Research Agency, project SPA/DD ‘Animal Production Systems and Sustainable Development’ (ANR-06-PADD-017).