1 Introduction
1.1 Context
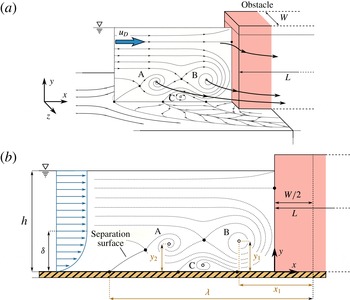
An obstacle placed in a developing boundary layer over a flat plate creates an adverse pressure gradient which, if sufficiently strong, makes the boundary layer detach. The boundary layer separation creates a shear layer, separating the main (upper) flow and the back (bottom) flow, which can contain a succession of vortices (Greco Reference Greco1990). Those vortices do not appear in the most upstream part of the shear layer, called the separation surface in figure 1 (Younis et al. Reference Younis, Zhang, Hu and Mehmood2014), but can exhibit complex dynamics (oscillating motion, merging by pairs, diffusion, turbulent behaviour) in the downstream part (Lin, Ho & Dey Reference Lin, Ho and Dey2008). The resulting set of vortices wraps around the obstacle with a particular shape, giving to the whole structure the name ‘horseshoe vortex’ (HSV). Depending on the obstacle shape and on the flow velocity, recirculation zones can also appear at the sides of the obstacle and behind it (Larousse, Martinuzzi & Tropea Reference Larousse, Martinuzzi, Tropea, Durst, Friedrich, Launder, Schmidt, Schumann and Whitelaw1993).
The HSV has been extensively studied since 1962 (Schwind Reference Schwind1962) for its numerous applications. (i) The HSV influences the amount of turbulence released in the downstream boundary layer, impacting the aerodynamic properties. (ii) The shear stress at the bottom wall and at the obstacle are affected by the HSV, modifying both the thermal exchanges (Sabatino & Smith Reference Sabatino and Smith2008) and the scouring process in hydraulics with a bed (Euler & Herget Reference Euler and Herget2012). (iii) The HSV appears in transverse jets interacting with boundary layers (Kelso & Smits Reference Kelso and Smits1995) in flow control issues. (iv) Finally, the force applied by the flow on the obstacle, of interest in turbo-machinery (Eckerle & Langston Reference Eckerle and Langston1987) and hydraulics, is also affected by the HSV. Flow configurations vary in those studies, due to the variety of obstacle shapes (cylinders, prisms, foils) and emerging, immersed or traversing obstacles. The present work focuses on emerging long rectangular prisms (see figure 1).
1.2 State-of-the-art
In the case of a laminar boundary layer interacting with an (immersed or emerging) obstacle, different HSV dynamics typologies have been reported, based either on the number of vortices in the HSV and/or on their dynamics (Schwind Reference Schwind1962; Baker Reference Baker1978; Greco Reference Greco1990; Lin, Chiu & Shieh Reference Lin, Chiu and Shieh2002). The most complete and generally accepted typology is the one from Greco (Reference Greco1990), obtained through flow visualizations, who defined five HSV regimes based on the dynamics of the vortices, namely: (i) steady vortex system (stationary HSV), (ii) oscillating vortex system (periodic HSV, with streamwise vortex position oscillation), (iii) amalgamating vortex system (vortices creation in the upstream part of the HSV and periodic vortices merging by pairs in its downstream part), (iv) breakaway vortex system (periodic vortex shedding from the HSV, disappearing by diffusion near the obstacle foot), and (v) transitional vortex system (aperiodical vortex dynamics). This typology was later confirmed, partially or completely, by Khan, Ahmed & Trosper (Reference Khan, Ahmed and Trosper1995), Lin, Lai & Chang (Reference Lin, Lai and Chang2003), Khan & Ahmed (Reference Khan and Ahmed2005), Lin et al. (Reference Lin, Ho and Dey2008) for immersed obstacles and by Seal, Smith & Rockwell (Reference Seal, Smith and Rockwell1997), Escauriaza & Sotiropoulos (Reference Escauriaza and Sotiropoulos2011) for emerging obstacles, using either flow visualization, particle image velocimetry (PIV), numerical simulations and/or pointwise velocity measurements. However, studies devoted to understanding how those regimes evolve with the flow and obstacle parameters are rare in this context: for an immersed obstacle configuration, Lin et al. (Reference Lin, Ho and Dey2008) recently showed that the HSV regimes evolution mainly depends on the Reynolds number based on the obstacle width
 $\mathit{Re}_{W}$
and on the ratio of the boundary layer thickness over the obstacle width
 $\unicode[STIX]{x1D6FF}/W$
.
Schematic representation of a laminar horseshoe vortex (HSV), created by the interaction of a free-surface flow and an emerging obstacle of width
 $W$
: (a) three-dimensional illustration of the HSV system showing three vortices (A, B, C). (b) Side mid-plane view of the HSV system showing the control parameters (boundary layer thickness
 $\unicode[STIX]{x1D6FF}$
, water level
 $h$
, bulk velocity
 $u_{D}$
and obstacle width
 $W$
and length
 $L$
) along with the definition of the HSV main geometrical characteristics (streamwise elongation
 $\unicode[STIX]{x1D706}$
and vortex centre positions
 $x_{i}$
,
 $y_{i}$
).

Turbulent HSV are characterized by temporally non-coherent vortices and therefore do not allow a typology definition. The HSV is characterized by a bi-modal phenomenon: the time alternation between the so-called ‘zero-flow’ and ‘back-flow’, first described by Devenport & Simpson (Reference Devenport and Simpson1990) and later confirmed by Agui & Andreopoulos (Reference Agui and Andreopoulos1992), Larousse et al. (Reference Larousse, Martinuzzi, Tropea, Durst, Friedrich, Launder, Schmidt, Schumann and Whitelaw1993), Doligalski, Smith & Walker (Reference Doligalski, Smith and Walker1994), Escauriaza & Sotiropoulos (Reference Escauriaza and Sotiropoulos2011). Paik, Escauriaza & Sotiropoulos (Reference Paik, Escauriaza and Sotiropoulos2007) showed, using numerical simulations, that this bi-modal phenomenon was actually three-dimensional and linked to the Görtler instability developing under the most downstream vortex. As the transition to turbulence of the HSV has not been extensively studied, it is not known if a turbulent HSV can arise from laminar boundary layers.
Regarding immersed obstacles, Simpson (Reference Simpson2001) summarized the state-of-the-art concerning flows around blunt or streamlined obstacles. For laminar HSV, he compared the HSV dynamics regimes observed by different authors. For turbulent HSV, he summarized the different descriptions of the bimodality phenomenon. He also discussed the effect of the HSV on the scouring process and the ‘bluntness factor’ that makes it possible to take the obstacle geometry into account in the dimensional analysis. Ballio, Bettoni & Franzetti (Reference Ballio, Bettoni and Franzetti1998) collected existing data on the evolution of the HSV main geometrical characteristics (such as the separation distance
 $\unicode[STIX]{x1D706}$
and the vortex positions, see figure 1) for both laminar and turbulent HSV, using, inter alia, the works of Baker (Reference Baker1978, Reference Baker1979, Reference Baker1980, Reference Baker1985, Reference Baker1991). They indicated that the obstacle width
 $W$
is the main parameter for the HSV evolution, the obstacle height
 $\unicode[STIX]{x1D709}$
being significant only with low ratios of
 $\unicode[STIX]{x1D709}/W$
. They also concluded that the HSV increases significantly the bottom wall shear stress, making the HSV an important structure for the scouring process and thermal transfers.
The literature dedicated to emerging obstacles is far less exhaustive than for immersed obstacles. The specificity of the emerging obstacle configuration is that the flow cannot pass over the obstacle and is forced to skirt around the obstacle. When studying the effect of the obstacle submergence (with varying obstacle heights from immersed to emerging configurations) on turbulent HSV, Sadeque, Rajaratnam & Loewen (Reference Sadeque, Rajaratnam and Loewen2008) indicated that the separation distance
 $\unicode[STIX]{x1D706}$
and the shear stress below the HSV are more important in the case of emerging obstacles. In fact, most studies with emerging obstacles are dedicated to turbulent HSV (Dargahi Reference Dargahi1989; Graf & Yulistiyanto Reference Graf and Yulistiyanto1998; Johnson & Ting Reference Johnson and Ting2003; Roulund et al.
Reference Roulund, Sumer, Fredsoe and Michelsen2005; Ozturk, Akkoca & Sahin Reference Ozturk, Akkoca and Sahin2008; Sadeque et al.
Reference Sadeque, Rajaratnam and Loewen2008), and draw similar qualitative conclusions regarding the turbulent HSV dynamics than in the immersed obstacle configuration. Seal et al. (Reference Seal, Smith and Rockwell1997) examined the laminar HSV upstream of an emerging obstacles, but they focused only on the breakaway vortex system regime. Indeed, to the authors’ knowledge, no studies in laminar HSV around an emerging obstacle provide a comprehensive description of the HSV dynamics and its geometrical properties as a function of the flow and obstacle parameters.
To summarize, the HSV in immersed obstacle configuration is well documented thanks to numerous studies (see Ballio et al. Reference Ballio, Bettoni and Franzetti1998 survey). This is, nonetheless, not the case for the emerging obstacle configuration subjected to a laminar boundary layer. While some characteristics, such as the HSV regimes or some parametric dependencies, seem to be qualitatively similar for both emerging and immersed configurations, the evolution of the HSV properties with the dimensionless parameters of the flow remains poorly known for emerging obstacles. In addition, it is not clear yet how the confinement of the free surface, which should strongly influence the HSV, affects its geometrical and dynamical properties.
In this context, this work aims at characterizing the evolution of the HSV with the dimensionless flow parameters, in the case of a long obstacle emerging from a laminar free-surface flow. The studied HSV characteristics are separated into two main parts in the following: (i) the HSV vortex dynamics, based on a dynamics typology and a semi-empirical model and (ii) the HSV geometrical properties (size, number of vortex and vortex average position).
1.3 Dimensional analysis
Any property of the HSV that forms in a laminar boundary layer facing an emerging rectangular obstacle can be expressed as a function of the fluid, flow and geometrical parameters, as:
 $$\begin{eqnarray}X=f(\unicode[STIX]{x1D708},\unicode[STIX]{x1D70C},\unicode[STIX]{x1D70E},u_{D},\unicode[STIX]{x1D6FF},H,W,L,h,k_{s},g),\end{eqnarray}$$
with
 $\unicode[STIX]{x1D708}$
the kinematic viscosity,
 $\unicode[STIX]{x1D70C}$
the fluid density,
 $\unicode[STIX]{x1D70E}$
the surface tension,
 $u_{D}$
the bulk velocity,
 $\unicode[STIX]{x1D6FF}$
and
 $H=\unicode[STIX]{x1D6FF}^{\ast }/\unicode[STIX]{x1D703}$
respectively the boundary layer thickness and shape factor at the obstacle face location before introducing it (with
 $\unicode[STIX]{x1D6FF}^{\ast }$
the boundary layer displacement thickness and
 $\unicode[STIX]{x1D703}$
the boundary layer momentum thickness),
 $W$
the obstacle width (along
 $z$
),
 $L$
the obstacle length (along
 $x$
),
 $h$
the water level at the obstacle location before introducing it,
 $k_{s}$
the bed and obstacle roughness and
 $g$
the gravitational acceleration (see figures 1 and 2). These 11 parameters involve three scales. Using
 $h$
as length scale,
 $h/u_{D}$
as time scale and
 $\unicode[STIX]{x1D70C}h^{3}$
as mass scale, Vaschy–Buckingham
 $\unicode[STIX]{x1D6F1}$
-theorem then allows us to reduce the dependency on the following eight dimensionless parameters:
 $$\begin{eqnarray}X^{\ast }=f\left(\mathit{Re}_{h}=\frac{4u_{D}h}{\unicode[STIX]{x1D708}},\frac{W}{h},\frac{h}{\unicode[STIX]{x1D6FF}},Fr=\frac{u_{D}}{\sqrt{gh}},\frac{W}{L},H,We=\frac{\unicode[STIX]{x1D70C}u_{D}^{2}h}{\unicode[STIX]{x1D70E}},\frac{k_{s}}{W}\right),\end{eqnarray}$$
with
 $X^{\ast }$
any flow property made dimensionless using the appropriate scale,
 $\mathit{Re}_{h}$
the Reynolds number based on the hydraulic diameter
 $D_{h}=4bh/(b+2h)\approx 4h$
herein, so that
 $\mathit{Re}_{h}\approx 4Q/b$
with
 $Q$
the total discharge and
 $b$
the channel width,
 $Fr$
the Froude number and
 $We$
the Weber number.
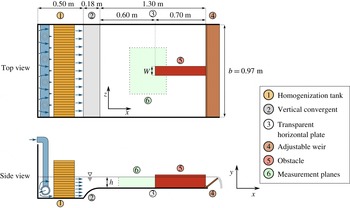
Experimental set-up consists of a feeding loop and an adjustable weir to control the flow parameters (
 $u_{D}$
and
 $h$
) and a transparent water tank to visualize and measure, in the vertical and horizontal planes, the HSV around a long emerging obstacle (width
 $W$
and length
 $L$
).

Previous works suggested that the obstacle length
 $L$
has no impact on the HSV when studied in the vertical upstream plane of symmetry (Dargahi Reference Dargahi1989; Ballio et al.
Reference Ballio, Bettoni and Franzetti1998). However, velocity measurements with increasing obstacle lengths showed that the boundary layer separation average position and its transverse oscillation (along
 $z$
) are affected by this parameter. In order to avoid the effect of the wake and to neglect the influence of the aspect ratio parameter
 $W/L$
, all obstacles considered in the following will be chosen sufficiently long with respect to the obstacle width (
 $W/L<0.3$
). The Froude number remains small enough throughout the present work (
 $Fr<0.3$
) to neglect its influence. Preliminary water level measurements showed that the flow remains in the hydraulic smooth regime for the studied flow parameter domain, allowing to neglect the influence of the roughness parameter
 $k_{s}/W$
. The shape factor
 $H$
remains fairly constant around a value of 2.68 in this study. The measured free-surface deformations are small (
 $\unicode[STIX]{x0394}h/h<0.13$
) throughout the experiment, and so, surface tension effects can be safely disregarded. Therefore, in the present work, any HSV dimensionless characteristic
 $X^{\ast }$
should depend only on three dimensionless parameters
 $$\begin{eqnarray}X^{\ast }=f\left(\mathit{Re}_{h},\frac{h}{\unicode[STIX]{x1D6FF}},\frac{W}{h}\right).\end{eqnarray}$$
2 Experimental methods
2.1 Experimental set-up
The water table schematized in figure 2 is used to generate an HSV at the foot of long, emerging, rectangular obstacles with varying dimensionless parameters
 $\mathit{Re}_{h}$
,
 $h/\unicode[STIX]{x1D6FF}$
and
 $W/h$
. The water tank is fed by a pumping loop which includes a valve for discharge control, an electromagnetic flowmeter (Promag W, of Endress+Hauser, uncertainty of
 $0.01L/s$
, i.e. a precision of 0.5 %–4 % depending on the discharge value), a homogenization tank composed of several grids and honeycombs (1) and a vertical convergent (2) to compress the boundary layer. The water then flows on a horizontal smooth plate (width
 $b=0.97~\text{m}$
and length 1.3 m) made of glass to allow optical access from the side and bottom walls (3). The water level can be controlled by an adjustable weir (4) and is measured by a mechanical water depth probe with digital display (uncertainty of 0.15 mm, according to Riviere et al.
Reference Riviere, Laïly, Mignot and Doppler2012). The obstacle (5) with adjustable width
 $W$
is placed at a distance of 0.6 m downstream the convergent end.
2.2 Measurement techniques
HSV measurements are obtained using either particle image velocimetry or trajectographies in the vertical plane of symmetry (
 $z=0$
). Trajectographies are applied to cases with high flow velocity, which are too challenging to measure by PIV. For § 2.6, PIV measurements are also made for some cases in a horizontal plane near the bed at the elevation
 $y/h=0.01$
(see marker 6 on the top view in figure 2).
For both techniques, a 532 nm, 4 W continuous laser with a Powell lens is used to illuminate
 $10~\unicode[STIX]{x03BC}\text{m}$
hollow glass spheres included as tracers in the flow. The displacement of these particles is recorded with a monochromatic, 12 bit,
 $2048\times 1088$
pixel camera. For trajectographies, time exposures are chosen in order to have: (i) long enough particle trails to visualize the flow direction, and (ii) short enough time exposure (shorter than the vortex motion characteristic time), so that the particle trails can be assimilated into instantaneous streamlines of the flow. For PIV measurements, double frames are taken at frequencies from 1 to 2 Hz, depending on the typical flow velocities and the frames spatial resolution. Image processing and PIV computations are performed under DaVis software (Lavision) and further velocity field analyses are performed using Python. Image processing includes ortho-rectification, background removal, intensity capping (Shavit, Lowe & Steinbuck Reference Shavit, Lowe and Steinbuck2006) and/or moving average. PIV computations are realized using cross-correlations with
 $50\,\%$
overlap and an adaptive square interrogation window size decreasing from
 $64$
to
 $16$
pixels, leading to a spatial resolution of approximately
 $0.01h$
. Measurement quality is ensured by following recommendations from Adrian & Westerweel (Reference Adrian and Westerweel2011) and others: (i) a thin laser sheet (1 mm thick), ensuring that particles displacements in the direction normal to the measurement plane do not influence the measured velocity, (ii) a small Stokes number for the seeding particles (maximum
 $St=0.012$
, leading to less than
 $1\,\%$
error according to Tropea, Yarin & Foss Reference Tropea, Yarin and Foss2007), (iii) a low sedimentation ratio (ratio between sedimentation velocity and typical flow velocity) of
 $0.004$
ensuring that sedimentation velocity of the particles is negligible in regard to the flow velocity, (iv) ortho-rectification of the obtained frames to avoid velocity errors due to optical deformations, (v) suitable particle concentration (at least 10 particles per interrogation windows), (vi) sufficiently large particle displacement between two frames (at least 10 pixels), leading to an approximate uncertainty on the velocity of
 $1\,\%$
, (vii) filtering of the obtained vectors in regard to the cross-correlation peak ratio (with a minimum of
 $1.5$
) to remove possibly wrong vectors (generally around
 $5\,\%$
of the vectors in the present case).
The measurement protocol for each case is the following: (i) values for the dimensionless parameters and associated dimensional parameters are selected and the experimental set-up is tuned accordingly, without obstacle, setting the desired bulk velocity
 $u_{D}$
along with the water level
 $h$
at
 $x=60~\text{cm}$
from the convergent end (i.e. at the future position of the obstacle upstream face). (ii) The boundary layer profile at the future position of the obstacle face is measured using PIV to access the boundary layer properties. (iii) An obstacle of given width
 $W$
is placed so that its upstream face is located at
 $x=60~\text{cm}$
, and its lateral faces are parallel to
 $x$
axis (figure 2). This creates the adverse pressure gradient responsible for the boundary layer separation and the HSV appearance. (iv) PIV measurements or trajectographies are performed, once the flow is established, in the vertical plane (
 $x,y$
) of symmetry upstream from the obstacle (or in a horizontal plane
 $x,z$
upstream from the obstacle for § 2.6).
2.3 Characteristics of the flow without the obstacle
The state of the laminar boundary layer as it interacts with the obstacle is a key parameter for the formation and the evolution of the HSV. It is then essential to ensure that the boundary layer is not polluted by experimental set-up biases. Firstly, PIV horizontal measurements are made for some cases, without obstacles and outside the boundary layer, to ensure that the flow is uniform in the transverse direction. Results show a relative standard deviation inferior to
 $1\,\%$
compared to the expected values of
 $u_{x}=u_{D}$
and
 $u_{y}=0$
, indicating a good horizontal uniformity. Secondly, without obstacle, the boundary layer should freely develop from the end of the convergent, where the velocity profile is uniform along a vertical profile. The vertical velocity profile at a given
 $x$
value can be fully characterized by: (i) the boundary layer thickness
 $\unicode[STIX]{x1D6FF}$
, defined as the vertical position where the velocity reaches 99 % of the maximum velocity, and (ii) the shape factor
 $H$
. The boundary layer thickness at the future position of the obstacle face depends on the bulk velocity
 $u_{D}$
, on the distance from the end of the convergent, but also, on the vertical confinement imposed by the free surface, i.e. on the water depth
 $h$
. The vertical profile of streamwise velocity in the boundary layer is expected to fit the laminar Blasius solution for high
 $h/\unicode[STIX]{x1D6FF}$
(unconfined situation) and the half-parabolic Poiseuille profile for low
 $h/\unicode[STIX]{x1D6FF}$
(highly confined situation), by analogy with closed channel flows.
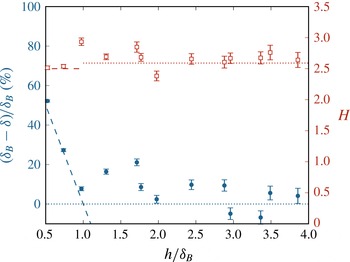
To confirm this statement, figure 3 shows the measured boundary layer thicknesses and shape factors for all boundary layers used in the study, compared to the corresponding values expected for Blasius (
 $\unicode[STIX]{x1D6FF}_{B}$
and
 $H_{B}=2.59$
) and Poiseuille (
 $\unicode[STIX]{x1D6FF}_{P}$
and
 $H_{P}=2.5$
) profiles. This figure confirms that the boundary layers match with Poiseuille profiles for highly confined flows and approach Blasius-like profiles as the confinement decreases. It should be noted that the shape factor
 $H$
remains fairly constant around an average value of 2.68, ensuring that the boundary layer does not undergo a turbulent transition in the present cases. This is also confirmed by the measured turbulent intensity (not shown here), remaining lower than
 ${<}3\,\%$
for all flow configurations.
These results show that the experimental apparatus is able to produce laminar boundary layers (despite the high Reynolds number of up to
 $\mathit{Re}_{h}=8000$
) that are affected by the vertical free-surface confinement for
 $h/\unicode[STIX]{x1D6FF}_{B}<2$
.
Characteristics of the boundary layer before introducing the obstacle. Left axis: measured boundary layer thickness
 $\unicode[STIX]{x1D6FF}$
deviation from the Blasius solution
 $\unicode[STIX]{x1D6FF}_{B}$
(blue filled circles) and analytic solution for a parabolic profile (dash line). Right axis: evolution of the measured shape factor
 $H$
(red open square symbol), with dotted and dashed lines representing respectively the Blasius shape factor (
 $H_{B}=2.59$
) and the parabolic shape factor (
 $H_{P}=2.5$
). Uncertainties on
 $(\unicode[STIX]{x1D6FF}_{B}-\unicode[STIX]{x1D6FF})/\unicode[STIX]{x1D6FF}_{B}$
and
 $H$
are calculated with an estimated uncertainty of
 $0.03h$
on the measured values of
 $\unicode[STIX]{x1D6FF}$
. As expected, the boundary layer fits a laminar Blasius profile and tends to a Poiseuille profile for important free-surface confinements.

2.4 Experiment plan
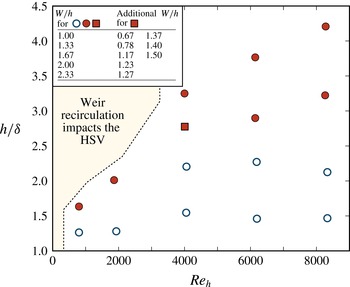
In order to have a good insight on how the three dimensionless flow parameters affect the HSV structure and dynamics, the dimensionless parameter space (
 $\mathit{Re}_{h}$
,
 $h/\unicode[STIX]{x1D6FF}$
,
 $W/h$
) is mapped as presented in figure 4. The corresponding dimensional parameter ranges are
 $u_{D}\in [0.00467,0.177]~\text{m}~\text{s}^{-1}$
,
 $h\in [1.00,8.00]~\text{cm}$
,
 $W\in [1,18.6]~\text{cm}$
and
 $\unicode[STIX]{x1D6FF}\in [0.692,3.84]~\text{cm}$
.
 $\mathit{Re}_{h}$
and
 $W/h$
are well controlled (respectively by the discharge
 $Q$
and the obstacle width
 $W$
) and allow homogeneous mapping, avoiding interdependencies. Tuning
 $h/\unicode[STIX]{x1D6FF}$
, however, is more difficult, as the boundary layer thickness
 $\unicode[STIX]{x1D6FF}$
depends on the bulk velocity
 $u_{D}$
, the water level
 $h$
and the distance between the convergent and the obstacle, which has a very limited variation range in the present experimental set-up.
Measurements duration always exceeds at least
 $20$
periods (in case of periodic HSV behaviours) for the
 $75$
cases of the parametric study, and at least
 $200$
periods for the
 $13$
cases of the detailed transition study (square symbol in figure 4). Time resolutions of the measurements ensure at least
 $15$
velocity fields per period. The free surface was examined for some cases to ensure that: (i) its elevation at the obstacle upstream face is close to the expected value of
 $u_{D}^{2}/2g$
(maximum relative difference of 5 %), that is due to the presence of a stopping point at the obstacle. (ii) The free surface does not exhibit significant oscillations that could possibly interact with the HSV periodic behaviour.
Experiment plan used to study the HSV geometrical and dynamical properties evolution. Blue open symbols represent cases investigated by trajectography and red filled symbols cases investigated by PIV. For each circle symbol (hollow or filled), five different values of
 $W/h$
are considered. For the red square symbol, 13 values of
 $W/h$
have been measured in order to study the HSV regime transitions in detail. The left zone is inaccessible to measurement, as the experimental set-up weir creates a recirculation impacting the HSV.

2.5 Horseshoe vortex properties
This section presents the methods used to measure the HSV geometrical and dynamical properties from the acquired PIV velocity fields and trajectographies.
2.5.1 Horseshoe properties measurement
One first main characteristic of interest is the vortex centre position (see figure 1
b). The vortices sharing the boundary layer vorticity sign are designated as
 $V_{i}$
, with
 $i$
the number of the vortex, starting with the most downstream one, and (
 $x_{i},y_{i}$
) their positions. In the following,
 $V_{1}$
and
 $V_{2}$
will also be referred to as ‘main vortex’ and ‘secondary vortex’. The counter-rotating vortices, located near the bed and just upstream from the previously defined vortices are designated as
 $V_{ci}$
with
 $i$
the number of the associated vortex
 $V_{i}$
. The vortex centre positions are extracted automatically on PIV fields by detecting the zero-velocity points (see the critical points definition in the sequel) and by hand on trajectographies, based on the curvature of the particle trails. A second characteristic of the HSV is the location of the boundary layer separation, defined as the upstream-most
 $x$
position where the shear stress along
 $x$
equals zero. Its distance to the obstacle is noted
 $\unicode[STIX]{x1D706}$
(see figure 1
b). The separation position is obtained by extrapolating the zero-velocity line of the shear layer down to the bottom wall (as an information on the velocity is rarely available in the very vicinity of the bottom wall), on both PIV and trajectography measurements. As proposed by Ballio et al. (Reference Ballio, Bettoni and Franzetti1998) in order to enhance the comparison between obstacles of different shapes, the reference points for streamwise distances (
 $\unicode[STIX]{x1D706}$
and
 $x_{i}$
) is not the obstacle face but rather a point located at
 $W/2$
behind it (see figure 1
b). Uncertainties regarding those properties are estimated by computing the noise over signal ratio on their evolution in time. This method gives uncertainties of
 $0.05h$
for trajectographies and
 $0.02h$
for PIV measurements (as the measurements spatial resolution and accuracy depend on
 $h$
).
The vortex circulation, which is also an interesting property, can be computed by integrating the vorticity on the vortex area in the vertical plane of symmetry. This area is, however, quite challenging to define in the vicinity of a strong shear layer (the boundary layer in this case). Indeed, the classical method for estimating the vortex region, consisting of defining a vorticity threshold, can be rendered inoperable by the intense boundary layer vorticity due to the shear. The residual vorticity (Kolář Reference Kolář2007), known to be the vorticity associated with rotation, is in place used herein to get the vortex region.
2.5.2 HSV dynamics characterization
In order to have quantitative data on the HSV dynamics and to establish a clear typology, vortex positions need to be followed in time. The HSV dynamics is characterized by hand on trajectographies, as it is challenging to extract automatically, and in a robust way, the vortex position on such data. For PIV measurements, critical points of the velocity field in the vertical plane of symmetry are automatically detected and tracked in time, summarizing efficiently the HSV structure evolution.
Critical points are Lagrangian dependant and, as such, are unable to detect vortices advected at high velocities. In those cases, gradient-based criteria such as the
 $\unicode[STIX]{x1D706}_{2}$
-criterion (Jeong & Hussain Reference Jeong and Hussain1995) or the residual vorticity (Kolář Reference Kolář2007) can be used to detect and track vortices. However, as the present vortex advection velocities (velocities of their centres) remain small compared to the velocities they induce, and regarding the valuable additional topological information brought by the critical points, they are used below to characterize the HSV dynamics.
The method for vortex detection and tracking, inspired by Graftieaux, Michard & Grosjean (Reference Graftieaux, Michard and Grosjean2001), Depardon et al. (Reference Depardon, Lasserre, Brizzi and Borée2007) and Effenberger & Weiskopf (Reference Effenberger and Weiskopf2010), consists of six steps: (i) pre-filtering of the time-resolved velocity fields, using proper orthogonal decomposition (POD) reconstruction on a truncated modal base. POD modes are not filtered using the classical energy criterion (Peltier et al.
Reference Peltier, Erpicum, Archambeau, Pirotton and Dewals2014), but according to the dispersion of their spatial spectra, which is representative of the presence of large-scale structures. This step aims at reducing the measurements noise, removing the small-scale fluctuations to promote the large-scale structures and replacing the missing velocity vectors by spatially and timely interpolated ones. (ii) Detection, on each instantaneous velocity field, of the measured vector grid cells susceptible to containing a critical point using a scan of the Poincarré–Bendixson index (see Hunt et al.
Reference Hunt, Abell, Peterka and Woo1978, for more detail on this index). (iii) Detection of the sub-grid position of the critical points, using Effenberger & Weiskopf (Reference Effenberger and Weiskopf2010) method. (iv) Determination of the critical points type (saddle point, stable or unstable node, stable rotating or counter-rotating vortex centre) based on the local Jacobian matrix eigenvalues. (v) Optional topological simplification using the
 $\unicode[STIX]{x1D6E4}$
criterion of Graftieaux et al. (Reference Graftieaux, Michard and Grosjean2001). This step allows us to select only large-scale bounded critical points. (vi) Trajectory reconstruction using distance sum minimization.
For a more synthetic visualization of the HSV vortex motion for a particular configuration, the vortex centres’ trajectories are averaged by group according to their similarities: (i) for each couple of trajectories, the normalized integral of the squared difference is computed:
 $$\begin{eqnarray}\unicode[STIX]{x1D716}_{mn}=\frac{1}{2}\frac{\displaystyle \int [x_{m}(t)-x_{n}(t)]^{2}\text{d}t}{\displaystyle \frac{1}{2}\int \left[x_{m}(t)+x_{n}(t)\right]^{2}\text{d}t}+\frac{1}{2}\frac{\displaystyle \int [y_{m}(t)-y_{n}(t)]^{2}\text{d}t}{\displaystyle \frac{1}{2}\int \left[y_{m}(t)+y_{n}(t)\right]^{2}\text{d}t},\end{eqnarray}$$
where
 $(x_{m}(t),y_{m}(t))$
is the position of the trajectory
 $m$
at time
 $t$
and
 $\unicode[STIX]{x1D716}$
is representative of the difference between the two trajectories (small for close trajectories, large for different trajectories). (ii) The maximum difference between two trajectories considered similar is arbitrarily defined (here to
 $\unicode[STIX]{x1D716}_{crit}=0.07$
, based on the obtained results). (iii) Trajectories are distributed in groups, ensuring that no group includes couples of trajectories with
 $\unicode[STIX]{x1D716}>\unicode[STIX]{x1D716}_{crit}$
. (iv) Groups of similar trajectories are averaged to obtain mean trajectories.
One can finally associate instantaneous velocity fields to each of those mean trajectories and so perform a conditional averaging of the velocity fields on the vortex centre position.
2.6 Horizontal view of the HSV
The main HSV geometrical and dynamical properties can be observed from measurements in the vertical plane of symmetry. Nonetheless, the HSV does not remain necessarily symmetric with respect to this plane at all time, and Eckerle & Langston (Reference Eckerle and Langston1987) pointed out that the vortex filament maximal radii and intensities can be located outside of the symmetry plane. In this context, measurements in a horizontal plane near the bed are mandatory to ensure that the HSV driven phenomena can be deducted from two-dimensional PIV measurements in the vertical plane of symmetry.
Instantaneous velocity field in the horizontal plane near the bed (
 $y=0.01h$
) for a laminar flow around an obstacle for
 $\mathit{Re}_{h}=4272,h/\unicode[STIX]{x1D6FF}=2.70$
,
 $W/h=1.67$
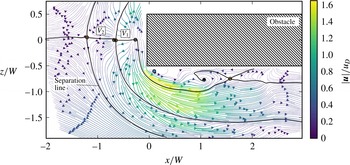
. Streamlines are coloured with velocity magnitude. Circles represent detected critical points: saddle points (yellow), unstable nodes (grey) and vortex centres (blue). Plain thick lines are streamlines coming from and going to saddle points and delimit the vortices within the HSV.
 $V_{1}$
and
 $V_{2}$
are the main and secondary vortices. The topology of the flow and the velocity distribution show that the properties of the HSV vortices do not evolve drastically when rolling around the obstacle in the upstream part of the HSV (before
 $x=0$
).

Figure 5 presents a velocity field in the horizontal plane near the bed (
 $y/h=0.01$
). The evolution of the main and secondary vortex (
 $V_{1}$
and
 $V_{2}$
) filaments location while bypassing the obstacle can be evaluated on this figure with the help of the critical points and their associated lines. Vortices do not undergo strong modifications in size and velocity while wrapping around the obstacle, until they interact with the complex lateral separation bubble on the sides of the obstacle. Time-resolved measurements show that the position of the horizontal separation line (see figure 5) remains constant with time (not shown here), ensuring that shedding from the lateral recirculation bubbles are not strong enough to disrupt the HSV and the boundary layer separation. Those measurements also reveal that the dynamics of the HSV vortices does not evolve significantly along the filaments while rolling around the obstacle.
Conclusions can be drawn, on this configuration, that: (i) the instantaneous HSV symmetry plane coincides at each time with the obstacle symmetry plane, (ii) the vortex filaments remain approximately of the same size and keep the same dynamics while wrapping around the obstacle (contrary to the observations of Eckerle & Awad Reference Eckerle and Awad1991) and consequently, (iii) a measurement on the vertical symmetry plane of the HSV (
 $z=0$
) is an adapted and sufficient approach to characterize the HSV behaviour.
The same conclusions apply for all flows investigated with horizontal measurements, allowing the present work to be based solely on the study of measurements in the vertical plane of symmetry.
2.7 Comparison between various obstacle shapes and submergence
Most previous works concerning the HSV, in both immersed and emerged configurations, considered cylindrical obstacles, making the comparison with the present results with rectangular obstacles challenging.
Baker (Reference Baker1991) proposed, in order to solve this problem, to estimate that HSV from obstacles of different shapes are comparable if they have the same separation distance (method that requires to known the separation distance) while Ballio et al. (Reference Ballio, Bettoni and Franzetti1998) considered comparable HSV from square obstacles of width
 $W$
and HSV from cylindrical obstacles of diameter
 $W$
.
A more systematic method based on the estimated adverse pressure gradient is proposed herein. Because the whole HSV and notably the boundary layer separation is governed by the streamwise adverse pressure gradient, one can assume that two obstacles of different shapes creating the same adverse pressure gradient in the upstream symmetry plane should generate similar HSV. Based on this assumption, and using pressure profiles from potential flow computation, an equivalent obstacle width
 $W_{eq}$
can be computed for cylindrical obstacles of diameter
 $D$
, so that a quadrilateral obstacle of width
 $W_{eq}$
and infinite length and a cylindrical one with equivalent width
 $W_{eq}$
lead to nearly the same upstream pressure gradient and consequently, comparable HSV. This method can further be applied to obstacles with other shapes (such as quadrilateral obstacles with non-infinite length, foils, bevelled quadrilaterals, oblong obstacles,
 $\ldots$
). As the separation distance is linked to the adverse pressure gradient, this method is very similar to the one of Baker (Reference Baker1991), but does not necessitate prior knowledge of the separation distance
 $\unicode[STIX]{x1D706}$
.
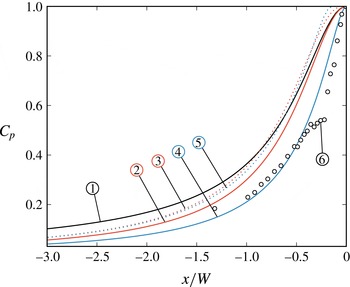
Figure 6 shows that pressure coefficients
 $C_{p}$
(from two-dimensional potential flow computation) upstream of cylindrical, square shaped and infinitely long rectangular obstacles can effectively be aggregated by adjusting their size (diameter
 $D$
or width
 $W$
). The optimal size coefficients, in a least squares sense, have been found to be:
 $$\begin{eqnarray}\displaystyle & \displaystyle W_{eq}=W & \displaystyle\end{eqnarray}$$
 $$\begin{eqnarray}\displaystyle & \displaystyle W_{eq}=\frac{W_{s}}{1.093}=0.915W_{s} & \displaystyle\end{eqnarray}$$
 $$\begin{eqnarray}\displaystyle & \displaystyle W_{eq}=\frac{D}{1.29}=0.775D, & \displaystyle\end{eqnarray}$$
with
 $W$
the width of an infinitely long rectangular obstacle and
 $W_{s}$
the width of a square-shaped obstacle. Moreover, the fair agreement between the potential flow computations and measurements from Baker (Reference Baker1978) shows that potential flow is effectively able to predict the pressure distribution. This equivalence will be used in the following to modify empirical correlations from the literature so that they use
 $W_{eq}$
instead of
 $D$
and
 $W_{s}$
(counting respectively
 $1.29W_{eq}$
and
 $1.093W_{eq}$
).
Pressure coefficients
 $C_{p}$
obtained using two-dimensional (in the horizontal plane) potential flow theory computations upstream of different obstacles: (1) quadrilateral obstacles of width
 $W_{eq}$
and infinite length, (2) square-shaped obstacles of width
 $W_{s}=W_{eq}$
, (3) square-shaped obstacles of width
 $W_{s}=1.093W_{eq}$
, (4) cylindrical obstacles of diameters
 $D=W_{eq}$
, and (5) cylindrical obstacles of diameters
 $D=1.29W_{eq}$
. (6) Measurements from Baker (Reference Baker1978) at the bed in front of a cylindrical immersed obstacle. These results show that the pressure gradients for different obstacles can be aggregated by adjusting their characteristic sizes.

To compare immersed and emerging obstacle data, the obstacle height
 $\unicode[STIX]{x1D709}$
for immersed obstacles will be said analogous to the water depth
 $h$
for emerging obstacles, as proposed by Ballio et al. (Reference Ballio, Bettoni and Franzetti1998), thus keeping the same wet portion of obstacle shape ratio (
 $\unicode[STIX]{x1D709}/W$
for immersed obstacles and
 $h/W$
for emerging ones).
3 Dynamic typology
Defining a typology categorizing the different observed behaviours is a convenient way of studying the HSV dynamics. Authors such as Baker (Reference Baker1978) established typologies using the number of vortices in the HSV. Nevertheless, as in Greco (Reference Greco1990) and Lin et al. (Reference Lin, Ho and Dey2008), the present typology is rather based on the vortex dynamics. The number of vortices will be discussed further on, in the section dedicated to the HSV geometrical properties.
For a given flow configuration, the HSV shows either large-scale, coherent and well-defined vortices (as in figure 1), and will be said to be in the ‘coherent regime’, or a non-stationary and aperiodical behaviour, with the presence of small-scale non-coherent structures and will be said to be in the ‘irregular regime’.
In coherent regimes, the HSV vortices can either be steady or follow a ‘pseudo-periodic’ motion, showing an alternation of elementary processes of same duration
 $T$
(HSV period) called ‘phases’ below. For one flow configuration, successive phases can be substantially different but always bring back the HSV to its initial state (and consequently, all phases share the same initial state).
The different observed phases are described in § 3.1.1 and are the base of the definition of coherent regimes, defined in § 3.1.2, and presented in details in § 3.2. The evolution from coherent to irregular regimes is presented in § 3.3. Finally, the evolution of all those regimes with the flow parameters is detailed in § 3.4.
3.1 Coherent regime definitions
3.1.1 Phase (elementary processes) definitions
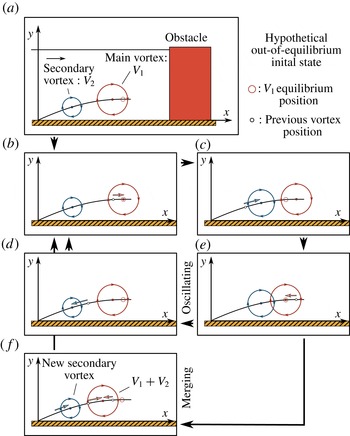
All observed phases can be classified in four categories: (i) the ‘oscillating phase’, where the displacement of each vortex is a horizontal ellipse that brings it back near its initial position at the end of the phase. (ii) The ‘merging phase’, where the main vortex (
 $V_{1}$
) follows the same pattern as in the oscillating phase, but merges with the secondary vortex (
 $V_{2}$
) at the end of the phase. The vortex merging is defined, from a ‘critical points’ view, as a bifurcation from a saddle point and two vortex centres to a single vortex centre. As it disappears in the merging,
 $V_{2}$
is replaced by the third vortex
 $V_{3}$
while a new vortex is created near the boundary layer separation point. (iii) The ‘diffusing phase’, analogous to the merging phase, but for which the main vortex circulation and size decrease along the phase, reaching the merging position with low circulation compared to the secondary vortex. A phase will be considered to be ‘diffusing’ if the main vortex circulation is less than
 $25\,\%$
of the secondary vortex circulation (this ratio can reach
 $0\,\%$
if the vortex fully diffuses before reaching the merging). (iv) The ‘breaking phase’, where the main vortex breaks (escapes) from the HSV, is advected further downstream and finally diffuses near the obstacle. The main vortex is considered to break from the HSV if the distance between
 $V_{1}$
and
 $V_{2}$
exceeds two times the diameter of the bigger vortex. From this time on, the breaking vortex is considered outside of the HSV,
 $V_{2}$
replaces
 $V_{1}$
and a new vortex arises near the boundary layer separation point.
3.1.2 Regime definitions
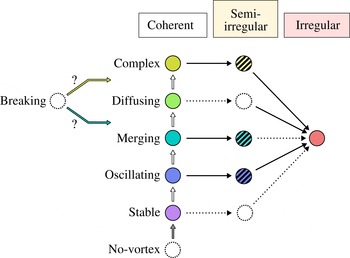
The definition of the four phases, observed in the experiments, allows us to classify the flow configurations in seven coherent regimes, represented in figure 7, plus two transitional regimes: (i) the ‘no-vortex regime’, where no vortex appears on the shear layer. This regime was not observed in the present study, but was reported by Schwind (Reference Schwind1962) for immersed obstacles, and is expected to exist in the present emerging obstacle configuration for
 $\mathit{Re}_{h}$
lower than those considered herein. (ii) The ‘stable regime’, where the location and the circulation of the vortices remain constant with time. In practice, a HSV is considered in stable regime if the mean amplitude of the vortex displacements does not exceed
 $0.03W$
. (iii) The ‘oscillating regime’, (iv) the ‘merging regime’ and (v) the ‘diffusing regime’, composed of a succession of similar associated phases (in practice at least
 $95\,\%$
of all phases). (vi) The ‘oscillating–merging transitional regime’, composed of non-regular alternations of oscillating and merging phases. (vii) The ‘merging–diffusing transitional regime’, composed of non-regular alternation of merging and diffusing phases. (viii) The ‘breaking regime’, composed of a succession of breaking phases. This regime was not observed in this study but was reported by Thomas (Reference Thomas1987) and Greco (Reference Greco1990) for the immersed obstacle configuration. Where this regime should be placed on the two-dimensional (2-D) typology (figure 7) remains unclear. (ix) The ‘complex regime’, composed of an apparently chaotic succession of oscillating, merging, diffusing and/or breaking phases. This regime is characterized by an important phase dispersion, i.e. successive phases notably differ from each others even if they have the same phase type, contrary to the previously defined transitional regimes. All regimes will be detailed in the next section.
The typology defined here is partially similar to the one presented by Greco (Reference Greco1990) for the immersed obstacle configuration: the present stable, oscillating, merging, breaking and irregular regimes can be, respectively, assimilated to Greco’s ‘steady vortex system’, ‘oscillating vortex system’, ‘amalgamating vortex system’, ‘breakaway vortex system’ and ‘transitional vortex system’. However, as the typology of Greco (Reference Greco1990) is based on flow visualization and does not precisely define the regimes boundaries, this terminology is not used herein. Complex regime was not reported (to the authors knowledge) in the immersed nor emerging obstacle literature.
HSV regime organization for a laminar flow around a long rectangular obstacle. Each circle represents an observed dynamics, categorized along the coherent evolution (vertically) and the irregular evolution (horizontally). White arrows represent the coherent transitions and black arrows the irregular transitions. Dotted circles and arrows correspond to regimes and transitions not observed herein, but expected to exist.

3.2 Coherent regimes
3.2.1 Stable regime
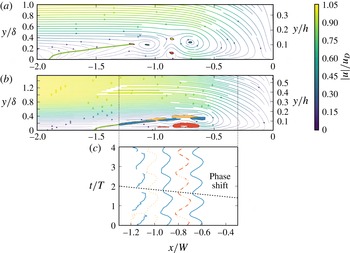
In stable regime, each vortex remains at the same spatial location at all time. Figure 8(a) shows an example of a HSV in stable regime where critical points detection indicates the presence of two vortices, confirmed by the streamlines pattern. The steadiness of the flow dynamics is visible through the small size of the critical points presence zones.
The classical stable HSV topology, as discussed for instance in Younis et al. (Reference Younis, Zhang, Hu and Mehmood2014), is well represented, with: (i) a boundary layer separation at
 $x/W=-1.9$
, (ii) a separation surface evolving from
 $x/W=-1.9$
to
 $x/W=-1.2$
, (iii) a succession of clockwise-rotating vortices (two in the present case), separated by saddle points, (iv) counter-clockwise rotating vortices (one in the present case) between the clockwise rotating ones and (v) the down-flow, visible through the streamlines curvature, that makes the flow reattach near the obstacle foot at
 $x/W\approx -0.1$
.
The three-dimensionality of the flow is clearly visible as the upper flow slows down while approaching the obstacle and as the HSV vortex streamlines are spiralling toward the vortex centres.
Mean velocity field (magnitude-coloured streamlines) in the vertical plane of symmetry for (a): a stable regime flow case (
 $\mathit{Re}_{h}=4271,h/\unicode[STIX]{x1D6FF}=2.70,W/h=0.79$
) and (b): an oscillating regime flow case (
 $\mathit{Re}_{h}=4271,h/\unicode[STIX]{x1D6FF}=2.70,W/h=1.23,T=21.01s$
). Zones where 99 % of the critical points are found are calculated using kernel density estimator and are shown as filled contour (blue for vortex centres, red for counter-rotating vortex centres and yellow for saddle points). Green lines are the separation surface section on the symmetry plane. (c) Time evolution of the critical points position along
 $x/W$
for the oscillating regime (b). Plain (blue) lines stand for vortices, dashed (red) lines for counter-rotating vortices and dotted (yellow) lines for saddle points. Critical points displacement exhibit a phase shift from the main vortex toward upstream at a velocity of
 $0.29u_{D}$
. Aspect ratio is conserved on velocity fields despite the use of dimensionless axes.

3.2.2 Oscillating regime
The oscillating regime is illustrated for one flow configuration in figure 8(b–c). The topology of the mean flow remains the same as for the stable regime (with an additional vortex in the present case). The vortex centres presence zones are elongated but do not collide with each other: vortices are sustainable in time. It is to be noted that vortex centres remain fairly on the shear layer originating from the separation point and ending at the main vortex
 $V_{1}$
position, and separating the upper flow (going towards downstream), and the backflow (going back upstream). Saddle points presence zones present the same behaviour as vortex centres, showing that the oscillating motion is shared by the whole HSV structure.
Figure 8(c) shows the evolution of each critical point streamwise location over the time during four consecutive periods. The periodic, quasi-sinusoidal streamwise displacement behaviour is shared by all critical points of the HSV. A phase shift is nevertheless present between those oscillations, and reveals that the oscillating dynamics source of the HSV is the main vortex
 $V_{1}$
, and the other vortices follow its motion.
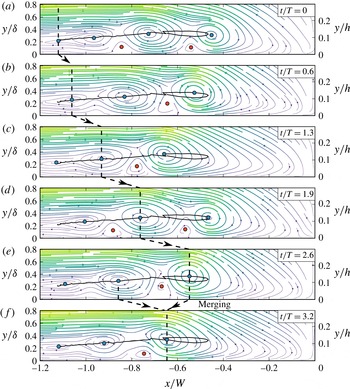
3.2.3 Merging regime
Figure 9 illustrates the evolution of the so-called merging regime during three periods. The global topology, already mentioned for the stable (figure 8
a) and oscillating regimes (figure 8
b) is also valid for the merging regime. The main difference is that a new vortex appears periodically at the end of the separation surface to replace the one disappearing by merging. Consequently, vortices have a life cycle: the highlighted vortex in figure 9 appears at
 $x/W=-1.15$
(and
 $y/\unicode[STIX]{x1D6FF}=0.22$
) at
 $t/T=0$
, is advected toward downstream while gaining in radius and circulation until
 $t/T=2.6$
, then slows down as its radius decreases and ends up going back upstream and merging with the previous vortex (
 $V_{2}$
) at
 $t/T=3.2$
.
Successive instantaneous velocity fields in the vertical plane of symmetry for a merging regime (
 $\mathit{Re}_{h}=6397,h/\unicode[STIX]{x1D6FF}=3.69,W/h=1.67,T=20.02s$
). Coloured symbols are detected critical points (same colour scheme as figure 8). The plain line is the highlighted vortex trajectory and dashed lines help follow the vortex of interest through presented instantaneous fields. Aspect ratio is conserved despite the use of dimensionless axes.

Successive instantaneous velocity fields in the vertical plane of symmetry for a diffusing regime (
 $\mathit{Re}_{h}=4250,h/\unicode[STIX]{x1D6FF}=2.7,W/h=2.36,T=16.5s$
).
 $t/T=0$
corresponds to the birth of the vortex of interest at the upstream end of the separation surface. See legend from figure 9 for the velocity fields. Right plot shows the evolution of the vortex of interest circulation with time.

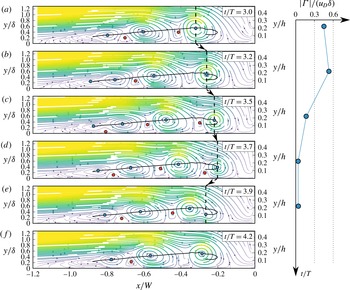
3.2.4 Diffusing regime
The diffusing regime is quite similar to the merging regime, but the main vortex radius and circulation drop before reaching the merging. The end of the life cycle of a vortex in this flow regime is shown on figure 10, from the moment when the main vortex
 $V_{1}$
starts to lose its circulation (
 $t/T=3.0$
) to its disappearance (
 $t/T=3.9$
). At the merging, the main vortex has a very low circulation and is absorbed by the secondary one without changing
 $V_{2}$
properties nor trajectory.
The evolution of the circulation and radius of the vortices is similar for all diffusing phases (see circulation evolution on figure 10): the vortices increase in size in the upstream part of the shear layer and decrease in size in the downstream part. This can be explained as vortex sizes and circulation evolutions are the result of the balance between: (i) the vertical gradient of streamwise velocity due to the boundary layer separation, strong in the upstream part of the HSV, feeding the vortices. (ii) The opposite-sign vorticity generated at the wall that rolls around the vortices and decreases their circulation by vorticity diffusion (Seal et al.
Reference Seal, Smith, Akin and Rockwell1995). It is to be noted that the main vortex disappearance (by diffusion) and the vortex creation at the end of the separation surface are not necessarily simultaneous, resulting in a varying instantaneous number of vortices (for instance three vortices at
 $t/T=3.0$
or 4 at
 $t/T=3.5$
in figure 10).
3.2.5 Note on the vortex merging
Vortex merging appears in the merging and diffusing phases and is thus an important mechanism for the HSV dynamics. Co-rotating vortex merging in uniform flows was described by Dritschel & Waugh (Reference Dritschel and Waugh1992), Trieling, Linssen & Van Heijst (Reference Trieling, Linssen and Van Heijst1998), Meunier, Le Dizès & Leweke (Reference Meunier, Le Dizès and Leweke2005), Josserand & Rossi (Reference Josserand and Rossi2007). Those studies showed that, for two identical vortices, vortex merging occurs when the ratio of the vortex radii over their separation distance exceeds a threshold value. For non-identical vortices, a general merging criterion is not established, as the merging has been shown to be governed by different processes (some of them leading to the destruction of the smaller/weaker vortex without increasing the larger vortex circulation, see Dritschel & Waugh Reference Dritschel and Waugh1992).
The situation is more complicated in the present study, as the vortices are not two-dimensional, and are surrounded by a complex flow. The vortex–vortex interaction match an elastic-like behaviour: two vortices start to interact as the distance separating them
 $\unicode[STIX]{x0394}x$
roughly equals the sum of their radii
 $\unicode[STIX]{x0394}x\approx R_{1}+R_{2}$
. When getting closer, they repel each other, as can be seen in the oscillating phases when
 $V_{1}$
travels upstream and pushes
 $V_{2}$
in figure 8(c). If they succeed in getting even closer, the two vortices merge, resulting in a briefly (regarding the time scale of the HSV oscillations) disrupted vortex. However, for vortices with very different sizes, as in the diffusing phases (see figure 10), the weaker vortex is simply absorbed by the larger one, without any elastic-like behaviour.
The appearance of this elastic-like behaviour can be attributed to the restriction of the vortex position along
 $y$
(due to the presence of the bed and the boundary layer) that prevents the vortices from rolling around each other, which is the typical behaviour for vortices in uniform flows (see Dritschel & Waugh Reference Dritschel and Waugh1992 for instance).
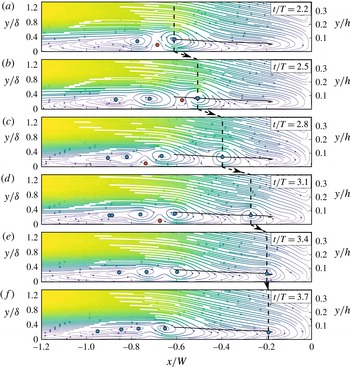
3.2.6 Breaking phase
The breaking regime was reported by Thomas (Reference Thomas1987) and Greco (Reference Greco1990), but was not observed in the present work. However, some complex regime configurations (that exhibit a succession of oscillating, merging, diffusing and/or breaking phases) show breaking phases, allowing to study the breaking mechanism. One of this breaking phase is presented in figure 11. This phase differs from a merging phase by the fact that the main vortex escapes from the HSV, travels toward downstream and diffuses near the obstacle. Figure 11 shows the end of a vortex life cycle in a breaking phase. The highlighted vortex (main vortex at
 $t/T>2.2$
) breaks from the HSV at
 $t/T\approx 2.8$
and is advected downstream at high velocity while losing in radius and circulation until disappearing at
 $t/T=3.7$
. Unlike observed by Doligalski et al. (Reference Doligalski, Smith and Walker1994), in this case no velocity eruption is at the origin of the breaking.
Successive instantaneous velocity fields in the vertical plane of symmetry for a breaking phase in a complex regime (
 $\mathit{Re}_{h}=6397,h/\unicode[STIX]{x1D6FF}=3.69,W/h=1.67,T=17.22s$
).
 $t/T=0$
(not shown here) corresponds to the birth of the vortex of interest at the upstream end of the separation surface at
 $x/W=-0.9$
. See legend from figure 9 for the velocity fields.

Evolution of some HSV characteristics for
 $\mathit{Re}_{h}=4272$
,
 $h/\unicode[STIX]{x1D6FF}=2.7$
and increasing
 $W/h$
values, corresponding to the square symbol in figure 4. (a) Percentage of merging or diffusing phase. (b) Blue circles: mean distance between the main and the second vortices
 $\unicode[STIX]{x0394}x_{avg}$
, red triangles: mean spatial oscillation amplitude of the main vortex
 $\unicode[STIX]{x1D6FF}x_{1}$
, yellow unversed triangles: mean spatial oscillation amplitude of the secondary vortex
 $\unicode[STIX]{x1D6FF}x_{2}$
. Those values are only defined, and consequently computed, for stable regimes and oscillating phases. (c) Strouhal number based on the boundary layer thickness
 $\unicode[STIX]{x1D6FF}$
. These plots illustrate well the continuous transition from the oscillating to the merging regimes.

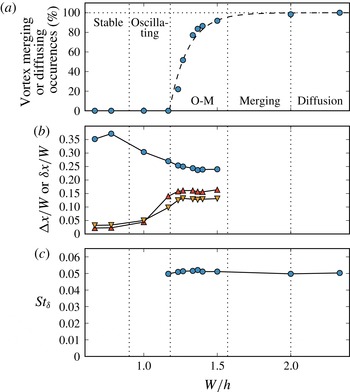
3.2.7 Oscillating–merging regime transition
While the transition from the stable to the oscillating regime is simply a continuous increase in vortex motion amplitude, the transition from the oscillating regime to the merging regime is more complex. This transition is investigated more in details in figure 12 for different cases with increasing
 $W/h$
but constant
 $\mathit{Re}_{h}$
and
 $h/\unicode[STIX]{x1D6FF}$
values (corresponding to the square symbol in figure 4).
For
 $W/h<0.9$
, the main and secondary vortices are far from each other and remain steady, the HSV being in stable regime. As
 $W/h$
increases (from
 $0.9$
to
 $1.2$
), the main vortex starts to oscillate and the average distance between the main and secondary vortices decreases. After a critical value of
 $W/h\approx 1.2$
,
 $V_{1}$
and
 $V_{2}$
begin to merge for some periods i.e. merging phases appear. Occurrences of merging phases increase with
 $W/h$
until reaching the merging regime (
 ${>}95\,\%$
merging phases) at
 $W/h=1.6$
. The transition from oscillating to merging regime (from
 $W/h=1.2$
to
 $W/h=1.6$
) is asymmetrical: the number of oscillation periods decreases rapidly for
 $W/h\approx 1.2$
and more slowly for
 $W/h\approx 1.6$
(see fitting in figure 12
a). This asymmetry is supposed to be linked to the variation introduced on the vortex trajectories by the merging occurrences, which can destabilize the whole HSV. The transition on the oscillating side (
 $W/h\approx 1.2$
in figure 12) is steep, as all successive vortex trajectories are similar to each other, and so, lead to mostly oscillating phases and sometimes a merging phase. The transition on the merging side (
 $W/h\approx 1.6$
) is more gradual, as successive vortex trajectories can be quite different, and so may lead to merging or oscillating phases.
Oscillations amplitudes can only be measured for oscillating phases, which explains the saturation of the vortex spatial amplitude (for
 $W/h=1.2$
to
 $1.5$
in figure 12
b): this saturation value
 $\unicode[STIX]{x1D6FF}x/W=0.16$
can be understood as the maximum possible oscillation amplitude before appearance of merging between
 $V_{1}$
and
 $V_{2}$
(note that the critical value
 $\unicode[STIX]{x1D6FF}x/W=0.16$
is expected to vary with
 $h/\unicode[STIX]{x1D6FF}$
and
 $\mathit{Re}_{h}$
). A general parameter governing the vortex merging occurrences is, in this situation, quite challenging to define.
It is to be noted that the Strouhal number, presented in figure 12(c), is directly proportional to the oscillation frequency
 $f$
(
 $\unicode[STIX]{x1D6FF}$
and
 $u_{D}$
being kept constant as
 $W/h$
increases). Consequently, figure 12(c) only indicates that the obstacle aspect ratio
 $W/h$
and the HSV regime have no influence on the HSV oscillation frequency.
3.2.8 Merging to diffusing regime transition
Contrary to the stable/oscillating/merging transition that is continuous, the merging to diffusing transition is more complex. Figure 13 shows the evolution of mean trajectories with increasing values of
 $W/h$
, while passing from a merging regime to a diffusing one.
Vortex centre mean trajectories in the
 $x,y$
plane of symmetry for three cases with
 $\mathit{Re}_{h}=4272,h/\unicode[STIX]{x1D6FF}=2.7$
and increasing
 $W/h$
(a: 1.51, b: 2.01, c: 2.45), corresponding to the square symbol in figure 4. Dashed contours represent the detected vortex centre envelopes. Each mean trajectory begins at the leftmost point. The legend indicates the percentage of trajectories used to compute each mean trajectories, the rest is not considered as it differs too much. Large circles are simultaneous vortex positions at a given arbitrary time. For visibility, aspect ratios are not conserved (trajectory representation is stretched along the
 $y/\unicode[STIX]{x1D6FF}$
axis). Mean trajectories are computed on approximately 200 single trajectories.

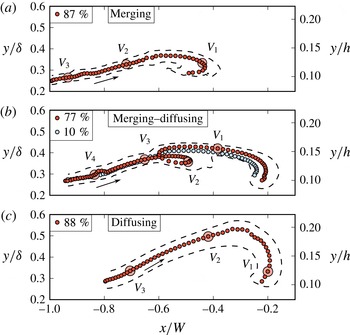
The mean trajectory shown in figure 13(a) is characteristic of a merging regime (see figure 9): a new vortex appears at the upstream end of the separation surface (
 $x/W\approx -1$
), is advected downstream while gaining in size and ends up going back upstream and merging with the secondary vortex. This last part of the trajectory is not well reconstructed, because of the main vortex high velocity.
Conversely, the trajectory shown in figure 13(c) is characteristic of a diffusing regime (see figure 10): the vortex is advected downstream, but diffuses at
 $x/W\approx -0.2$
instead of going back upstream and merging with the previous vortex.
For the transitional case in figure 13(b), the majority (
 $77\,\%$
, red trajectory) of the vortices merge with the previous vortex at
 $x/W\approx -0.6$
(merging phases). However, after this merging, these vortices are advected further downstream and diffuse at
 $x/W\approx 0.25$
(diffusing phases). Therefore, the HSV dynamics is
 $77\,\%$
of the time a regular alternation between merging and diffusing phases.
 $10\,\%$
of the vortices (blue trajectory) are simply diffusing-like. The remaining trajectories (
 $13\,\%$
) differ from those mean trajectories.
Nevertheless, the observation of this bi-modal transition does not exclude the possibility of a more simple and continuous transition: the main vortex being simply more and more diffused during a phase, as the transition from merging to diffusing regimes occurs.
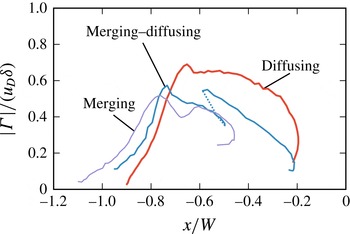
The circulation evolution for those three cases is presented on figure 14. For the merging–diffusing case, the abrupt circulation increase at
 $x/W\approx -0.6$
corresponds to the merging of the main vortex with the secondary one, which separates the vortex trajectory in two parts: (i) the first part, quite similar to the merging case: the vortex gains in circulation from
 $x/W\approx -1$
to
 $x/W\approx -0.8$
, and loses in circulation further downstream. (ii) The second part, quite similar to the diffusing case: the vortex circulation decreases while approaching the obstacle, reaching a very low circulation (
 $\unicode[STIX]{x1D6E4}/(u_{D}\unicode[STIX]{x1D6FF})\approx 0.1$
) at
 $x/W\approx -0.2$
. At the beginning of the second part, the circulation of the vortex is the same as at
 $x/W=-0.75$
, showing that the diffusing behaviour occurrences are not only related to high circulations.
Dimensionless vortex circulation evolution along the streamwise direction for the mean trajectories of figure 13. These evolutions show another aspect of the merging–diffusing transition linked to the increase of the vortex circulation.

3.2.9 Complex regime
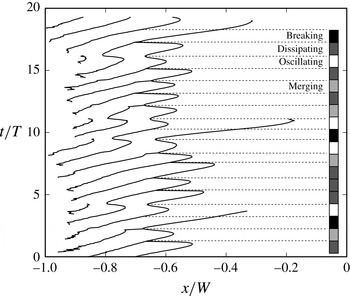
An example of vortex centre trajectory for a complex regime is presented in figure 15, where oscillating, merging, diffusing and breaking phases alternate during
 $20$
consecutive periods. It has been verified by additional measurements upstream of the obstacle (not shown here) that the phase alternation is not provoked by perturbations from outside the HSV. No particular order can be seen in the phases organization, or in the main vortex maximum and/or minimal positions.
In the case of oscillating, merging or diffusing regimes, the initial and final states of each phase are very close, i.e. each phase brings the HSV back in its initial state. The phase behaviour being governed by the initial state, successive phases have no particular reasons to differ from each other. In the case of the complex regime, each phase final state slightly differs from its initial state, leading to an alternation of different phase types.
With this point of view, the HSV dynamics can be considered as a dynamic system linking the next initial state to the current one:
 $$\begin{eqnarray}\unicode[STIX]{x1D719}_{n+1}=F(\unicode[STIX]{x1D719}_{n}),\end{eqnarray}$$
with
 $\unicode[STIX]{x1D719}_{n}$
the
 $n\text{th}$
initial state and
 $F$
the function representing the system dynamics. This system is expected to admit stable equilibrium positions for stable, oscillating, merging, diffusing and breaking regimes, to be chaotic for the complex regime and to undergo dynamic bifurcations leading to complex transitional behaviours, as it is the case for the transitional regime between the fusion and the diffusing regimes (figure 13
b). However, studying this dynamical system’s properties would require measuring at least 1000 consecutive phases, which represents approximately 20 000 instantaneous velocity fields and is out of the scope of the present study.
Time evolution of the streamwise vortex centre positions for a complex regime (
 $\mathit{Re}_{h}=6397,W/h=1.67,h/\unicode[STIX]{x1D6FF}=3.69,T=17.22s$
). Identified phase types are presented in the right bar. Dashed lines highlight the initial states, defined here as the most upstream position of the main vortex
 $V_{1}$
. The unordered phase succession illustrates the chaotic behaviour of the complex regime.

3.3 Irregular regimes
3.3.1 Coherent to irregular transition
From the previously defined coherent regimes, the HSV can evolve to an irregular, aperiodical, turbulent-like state, despite the boundary layer remaining in a laminar state. This transition is characterized by the appearance of small-scale non-coherent structures in the HSV. Transitional cases (between coherent and irregular regimes) will be said in ‘semi-irregular regime’, and consist of time intervals of coherent regime, punctually disturbed by eruptions of small-scale perturbations. Such transitions have been observed for oscillating, merging and complex regimes, as shown in figure 7. The fact that the irregular transition occurs for different coherent regimes makes necessary the two-dimensional typology presented on figure 7, separating the coherent and the irregular evolutions. This distinction was not included in any previous work (Schwind Reference Schwind1962; Baker Reference Baker1978; Greco Reference Greco1990; Lin et al. Reference Lin, Ho and Dey2008), where typologies remained strictly one-dimensional.
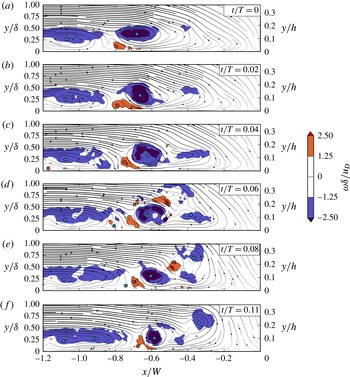
The eruptions of small-scale non-coherent structures are of two types. First-type eruptions are linked to the appearance of positive vorticity above the main vortex
 $V_{1}$
. Figure 16 illustrates this phenomenon and shows small-scale structures appearing above and downstream of the main vortex at
 $t/T=0.06$
, and provoking the appearance of positive vorticity of the same order of magnitude (but opposite sign) as the main vortex vorticity. This positive vorticity is then advected around the main vortex from
 $t/T=0.06$
to
 $0.08$
and ends up creating a new vortex downstream from
 $V_{1}$
at
 $t/T=0.11$
. Second-type eruptions are linked to the merging between two vortices, resulting in a destabilized main vortex (not shown here).
The bi-modal behaviour (Devenport & Simpson Reference Devenport and Simpson1990), previously reported for fully turbulent HSV, has not been clearly identified for irregular nor semi-irregular regimes, even if zero-flow and back-flow occurrences can be seen episodically. The conclusion may be that the bi-modal behaviour mainly occurs for higher Reynolds numbers, such as those used in studies devoted to this phenomenon (
 $\mathit{Re}_{W}=115\,000$
for Devenport & Simpson (Reference Devenport and Simpson1990) and Paik et al. (Reference Paik, Escauriaza and Sotiropoulos2007),
 $\mathit{Re}_{W}=20\,000$
and
 $39\,000$
for Escauriaza & Sotiropoulos (Reference Escauriaza and Sotiropoulos2011), while
 $\mathit{Re}_{W}<4950$
in the present study).
Successive instantaneous streamlines and vorticity contours in the vertical plane of symmetry for a semi-irregular complex regime (
 $\mathit{Re}_{h}=6395$
,
 $h/\unicode[STIX]{x1D6FF}=2.81$
,
 $W/h=1.36$
,
 $T=16.37s$
), illustrating the first-type eruption. Dotted iso-lines correspond to positive values of the vorticity. Circles represent detected critical points. This set of instantaneous flows illustrates well the first-type eruption, characterized by the appearance of negative vorticity above and downstream of the main vortex.

3.3.2 Instability origins
Several hypotheses can be put forward to explain the appearance of turbulent-like (small-scale and non-coherent) structures in the HSV and, consequently, its transition to an irregular regime. The first possible origin can be the boundary layer transition to turbulence. Turbulence bursts coming from the upstream boundary layer can certainly destabilize the HSV and break its periodicity. Yet, no perturbation in the upstream boundary layer could be observed herein, thus excluding this hypothesis.
Second, the interaction between proximate vortices can lead to the appearance of an elliptical instability (Kerswell Reference Kerswell2002) in the core region of the vortices. This interaction cannot be the origin of the first-type eruption (figure 16), where the instability originates from above the vortex, but is the best candidate to explain instabilities resulting from merging vortices (second-type eruption, not shown here).
Third, Escauriaza & Sotiropoulos (Reference Escauriaza and Sotiropoulos2011) show that eruptions of vorticity from the wall, responsible for the bi-modal behaviour of fully turbulent HSV, can be understood as three-dimensional Görtler instabilities (Floryan Reference Floryan1986). In such a scenario, the vorticity of the first counter-rotating vortex
 $V_{c1}$
punctually wraps around the main vortex
 $V_{1}$
and destabilizes it. While the first type eruption in figure 16 could agree with this definition, there is no evidence that the positive vorticity, appearing at
 $t/T=0.06$
, originates from the counter-rotating vortex. A definitive conclusion on the first-type eruption origin cannot, unfortunately, be drawn without proper 3-D information on the flow, out of the scope of the present work.
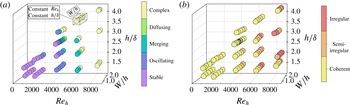
(a) Coherent regime evolution as a function of the three dimensionless parameters. Each circle, representing a measured flow, is coloured according to the observed HSV regime. (b) Irregular regime evolution. As coherent regimes cannot be defined on irregular regime configurations, irregular HSV flows are not represented on (a). These evolutions establish well the dependency of the HSV coherent regimes on the three dimensionless parameters, and the main dependency of the irregular regimes to the Reynolds number.

3.4 Regime evolution with flow parameters
The evolution of the flow regimes with the dimensionless flow parameters is presented in figure 17, separately for the coherent (a) and the irregular (b) evolutions.
Figure 17(a) clearly shows that the coherent regimes depend on the three dimensionless parameters
 $h/\unicode[STIX]{x1D6FF}$
,
 $W/h$
and
 $\mathit{Re}_{h}$
: an increase of any one of them leads to a destabilization of the HSV, potentially modifying the regime toward the complex one (toward the top in figure 7). The influence of
 $\mathit{Re}_{h}$
is the most obvious for the studied domain.
The interpretation of the parametric dependencies for the irregular evolution (figure 17
b) is more challenging. The influence of the Reynolds number
 $\mathit{Re}_{h}$
and the aspect ratio
 $W/h$
are clearly visible, but the influence of
 $h/\unicode[STIX]{x1D6FF}$
remains unclear.
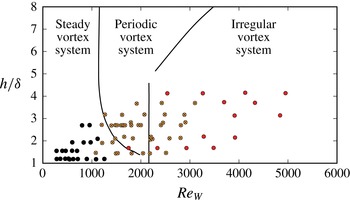
Figure 18 compares the evolution of the HSV regimes between an immersed obstacle configuration from Lin et al. (Reference Lin, Ho and Dey2008) and the present emerging obstacle configuration. This figure shows an overall agreement with the regimes boundaries of Lin et al. (Reference Lin, Ho and Dey2008), with a main dependency on
 $\mathit{Re}_{W}$
. Nevertheless, the boundary between steady and periodic vortex system is not well reproduced, and the transition from periodic to irregular regimes appears at higher
 $\mathit{Re}_{W}$
in the emerging obstacle configuration. As the periodic and irregular regimes overlap, the couple of dimensionless parameters used by Lin et al. (Reference Lin, Ho and Dey2008) (
 $\mathit{Re}_{W}$
and
 $h/\unicode[STIX]{x1D6FF}$
) should not be the best leading parameters of the regime evolution, at least for the emerging obstacle configuration.
HSV regime evolution comparison with typology from Lin et al. (Reference Lin, Ho and Dey2008). Each point represents a flow of the present study, classified according to Lin et al. (Reference Lin, Ho and Dey2008) typology: filled symbols for the steady vortex system (equivalent to the stable regime), cross-filled (yellow) symbols for periodic vortex system (equivalent to the oscillating, merging and diffusing regimes) and hollow symbols (red) for irregular vortex system (equivalent to the irregular regime). Lines represent regime boundaries reported by Lin et al. (Reference Lin, Ho and Dey2008) for immersed obstacles, and adapted with the equivalent diameter method (§ 2.7).

4 Mechanisms behind the horseshoe vortex dynamics
The previous section presented the dependency of the HSV dynamics on the flow dimensionless parameters, but little is known concerning the physical mechanisms at the origin of these transitions. This section proposes a model which purpose is to identify the main mechanisms behind the HSV periodic motion detailed in the previous section. After a brief note on the HSV vortex appearance in § 4.1, a semi-empirical correlation for the main vortex velocity is proposed in § 4.2 and on top of this, a model for the HSV dynamics is proposed in § 4.3. Results obtained with this model are presented in § 4.4 and allow us to draw conclusions on the leading mechanisms of the HSV dynamics. The reader is reminded that the presented model is not a predictive model for the HSV dynamics, but rather aims at gaining information on the HSV dynamics main mechanisms.
4.1 Vortex creation
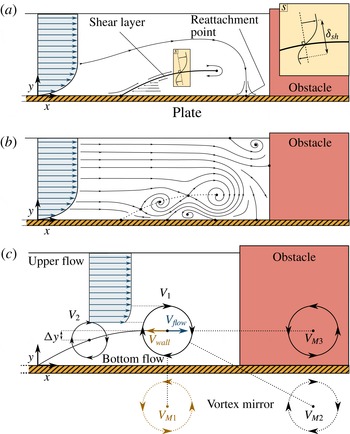
Because of its curvature and the strong three-dimensionality of the flow, the shear layer differs from the classical straight shear layer (see for instance Wygnanski & Fiedler Reference Wygnanski and Fiedler1970). Assumption can be made that it still behaves qualitatively like a classical shear layer and that its stability is governed by the shear-layer Reynolds number:
 $$\begin{eqnarray}\mathit{Re}_{sh}=\frac{\unicode[STIX]{x0394}U\unicode[STIX]{x1D6FF}_{sh}}{\unicode[STIX]{x1D708}},\end{eqnarray}$$
with
 $\unicode[STIX]{x0394}U$
the velocity difference between the outer flow on both sides of the shear layer and
 $\unicode[STIX]{x1D6FF}_{sh}$
the shear-layer thickness. For the present shear layer (see figure 19
a), one can estimate an upper bound for the associated Reynolds number as:
 $$\begin{eqnarray}\mathit{Re}_{sh,max}=\frac{2u_{D}y_{sh}}{\unicode[STIX]{x1D708}},\end{eqnarray}$$
where
 $y_{sh}$
is the elevation of the downstream end of the shear layer. In the present study,
 $\mathit{Re}_{sh,max}$
ranges from
 $105$
to
 $1363$
.
(a) Schematic representation of the boundary layer separation in the vertical plane of symmetry and the resulting shear layer at low
 $\mathit{Re}_{sh}$
(i.e. in no-vortex regime). (b) Diagram showing the vortex formation on the shear layer at moderate
 $\mathit{Re}_{sh}$
(here in stable regime). (c) Illustrative diagram for the model on the main vortex velocity
 $v_{adv}$
, detailed in § 4.3.

By analogy with classical shear layers, different dynamics behaviours are expected depending on the
 $\mathit{Re}_{sh}$
values: (i) for low
 $\mathit{Re}_{sh}$
(
 $\mathit{Re}_{sh}<55$
for classical shear layers), the shear layer should be stable and laminar (Bhattacharya et al.
Reference Bhattacharya, Manoharan, Govindarajan and Narasimha2006), and the HSV should exhibit no vortex, leading to the no-vortex regime (see figures 7 and 19
a). Schwind (Reference Schwind1962) observed this no-vortex regime for
 $\mathit{Re}_{sh,max}=78$
. (ii) For high Reynolds numbers (
 $\mathit{Re}_{sh}>10^{4}$
for classical shear layers), the shear layer and the HSV should be fully turbulent (Dimotakis Reference Dimotakis2000). This has not been observed in this study, as other instabilities appeared before reaching such
 $\mathit{Re}_{sh}$
values. (iii) For moderate Reynolds numbers (
 $55<\mathit{Re}_{sh}<10^{4}$
for classical shear layers), coherent, large-scale vortices should be generated periodically in the shear layer and advected downstream (see Loucks & Wallace (Reference Loucks and Wallace2012) and Mignot et al. (Reference Mignot, Cai, Launay, Riviere and Escauriaza2016) for
 $\mathit{Re}_{sh}$
equal to respectively
 $9700$
and
 $5000$
). This range is in fair agreement with the present measured configurations (
 $Re_{sh,max}\in [105,1363]$
). One main difference between the classical shear layer and the present curved shear layer is the fact that the HSV can exhibit steady vortices (stable regime) instead of continuously advected downstream vortices.
Nevertheless, no correlation could be obtained between the estimated
 $\mathit{Re}_{sh,max}$
and the HSV typology, promoting the hypothesis that the vortex dynamics and periodical behaviour are not directly linked to the shear-layer vortex shedding.
4.2 Vortex motion
The velocity of a vortex along the shear layer depends on the surrounding flow. For the main vortex
 $V_{1}$
, which is supposed to govern the HSV dynamics, its advection velocity will depend on: (i) the wall influence, whose induced velocity on
 $V_{1}$
can be estimated using the vortex mirror concept (Doligalski et al.
Reference Doligalski, Smith and Walker1994, see figure 19
c) as:
 $$\begin{eqnarray}v_{wall}=-\frac{\unicode[STIX]{x1D6E4}}{4\unicode[STIX]{x03C0}\overline{y_{1}}u_{D}},\end{eqnarray}$$
with
 $\unicode[STIX]{x1D6E4}$
the main vortex circulation and
 $\overline{y_{1}}$
the average location of the main vortex along
 $y$
. Note that only the bed mirror vortex (
 $V_{M1}$
in figure 19
c) is taken into account, as the two others (
 $V_{M2}$
and
 $V_{M3}$
) are much further and have negligible influences on
 $V_{1}$
. (ii) The secondary vortex
 $V_{2}$
influence, which depends on the relative position of the two vortices (
 $\unicode[STIX]{x0394}x$
,
 $\unicode[STIX]{x0394}y$
). (iii) The global state of the surrounding flow induced by the boundary layer separation, which should be constant for a given configuration and depend only of the dimensionless parameters
 $\mathit{Re}_{h}$
,
 $h/\unicode[STIX]{x1D6FF}$
and
 $W/h$
.
An empirical correlation for the main vortex (
 $V_{1}$
) velocity
 $v_{adv}$
can finally be found by using measurements of all these parameters instantaneous values over stable and oscillating regimes (using mean trajectories and their associated velocity fields):
 $$\begin{eqnarray}\frac{v_{adv}}{u_{D}}=\underbrace{-\frac{\unicode[STIX]{x1D6E4}}{4\unicode[STIX]{x03C0}\overline{y_{1}}u_{D}}}_{v_{wall}}+\underbrace{\left[1.19\frac{\unicode[STIX]{x0394}y}{\overline{y_{1}}}-1.15\left(\frac{\unicode[STIX]{x0394}y}{\overline{y_{1}}}\right)^{2}\right]\left(\frac{h}{\unicode[STIX]{x1D6FF}}\right)^{3.73}\left(\frac{\overline{y_{1}}}{h}\right)^{2}}_{v_{flow}},\end{eqnarray}$$
with
 $R^{2}=0.89$
and
 $v_{flow}$
the influence of
 $V_{2}$
and the surrounding flow, aggregating previous items (ii) and (iii). The effect of
 $\overline{y_{1}}/h$
on the main vortex velocity can be explained by the upper flow contraction caused by the HSV, which provokes an increased
 $v_{adv}$
. The effect of
 $h/\unicode[STIX]{x1D6FF}$
accounts for the impact of the shear-layer shape (governed by
 $\unicode[STIX]{x1D6FF}$
and the down-flow). Note that for a given flow configuration, the only time-varying parameters are
 $\unicode[STIX]{x0394}y$
and
 $\unicode[STIX]{x1D6E4}$
.
This correlation is illustrated in figure 20 for the oscillating regime previously presented in § 3.2.2. Figure 20(a) presents the strong correlation between the main vortex velocity
 $v_{adv}$
and the difference of altitude between the main and the secondary vortex
 $\unicode[STIX]{x0394}y$
, confirming the necessity to take this parameter into account in relation (4.4). Figure 20(b) presents the comparison between the measured main vortex velocity
 $v_{adv}$
and its prediction using the correlation (4.4), along with the two components of the predicted main vortex velocity:
 $v_{flow}$
and
 $v_{wall}$
. The good agreement allows us to pass to the next step.
Evolution of different components of the correlation (4.4) on one selected period of the oscillating case presented in figure 8. (a) Comparison between the measured main vortex velocity
 $v_{adv}$
and the measured difference of altitude between the main and the secondary vortex
 $\unicode[STIX]{x0394}y$
proves the strong correlation existing between these two parameters. (b) Comparison between the two components of correlation (4.4) (
 $v_{flow}$
and
 $v_{wall}$
) and the resulting main vortex measured velocity
 $v_{adv}$
shows the good agreement obtained for the main vortex velocity correlation. It is to be noted that for a given flow, the sole time-dependant parameters in the correlation (4.4) are
 $\unicode[STIX]{x0394}y$
and
 $\unicode[STIX]{x1D6E4}$
.

4.3 Vortex dynamics reproduction
To identify the physical phenomenon at the origin of the HSV dynamics, a numerical model is established based on the following hypotheses: (i) the vortices can travel upstream and downstream but remain along the shear layer, which shape is taken from measurements. (ii) The main vortex (
 $V_{1}$
) instantaneous velocity
 $v_{adv}$
is estimated by (4.4). (iii) The secondary vortex velocity
 $v_{2,adv}$
is equal to the velocity of the main one
 $v_{adv}$
. (iv) The initial vortex locations are their measured equilibrium (or mean positions) plus a perturbation. (v) The vortices velocity are initially set to zero.
Numerical simulations using this first model succeed in replicating the vortex equilibrium position for stable regime configurations but do not exhibit a periodic behaviour for the oscillating regime configurations (not shown here). One missing characteristic of the HSV dynamics that may explain the lack of periodicity is the delay
 $\unicode[STIX]{x0394}t$
between
 $V_{1}$
and
 $V_{2}$
motion, previously discussed in § 3.2.2, and presented in figure 8.
Figure 21 shows a scenario that illustrates how the complexity added by this delay can lead to a periodic behaviour: (a) vortices are placed on the shear layer, the main vortex
 $V_{1}$
being placed upstream of its equilibrium position. (b) The main vortex naturally goes towards its position of equilibrium, according to (4.4) while the secondary vortex remains in place, due to the delay (exaggerated for the sake of this demonstration). (c) The secondary vortex, after a delay of
 $\unicode[STIX]{x0394}t$
, moves downstream, decreasing the
 $\unicode[STIX]{x0394}y$
magnitude and thus moving upstream the main vortex equilibrium position. (d) The main vortex moves towards its new equilibrium position while the secondary vortex stays still due to the delay. (e) The secondary vortex, after a delay
 $\unicode[STIX]{x0394}t$
, moves upstream, increasing the
 $\unicode[STIX]{x0394}y$
value, pushing downstream the equilibrium position and bringing the vortex system back to its initial state (similar to a). (f) If the main and the secondary vortices come close enough to each other in (d), they merge, the secondary vortex is replaced by a new one from upstream, and the vortex system recovers its initial state (similar to a).
Schematic illustration of how the motion delay
 $\unicode[STIX]{x0394}t$
between the main (
 $V_{1}$
) and the secondary (
 $V_{2}$
) vortices can lead to an oscillating behaviour (explained step by step in § 4.3).

The fact that the delay is at the origin of the oscillation process if further ensured by the strong correlation between measured delays
 $\unicode[STIX]{x0394}t$
and oscillation frequencies
 $f$
:
 $$\begin{eqnarray}f=\frac{0.154}{\unicode[STIX]{x0394}t},\end{eqnarray}$$
with
 $R^{2}=0.92$
on the dimensional correlation (see on figure 22). Unfortunately, no correlation could be obtained between the delay
 $\unicode[STIX]{x0394}t$
and the dimensionless parameters
 $\mathit{Re}_{h}$
,
 $h/\unicode[STIX]{x1D6FF}$
and
 $W/h$
. The delay is expected to result from vortex–vortex interactions, and so to depend on vortex properties (position, radius, circulation), themselves depending on the boundary layer shape, which depends on the dimensionless parameters. This dependency chain explains the difficulty to build direct correlations between the delay
 $\unicode[STIX]{x0394}t$
and the dimensionless parameters.
Evolution of the averaged measured delay
 $\unicode[STIX]{x0394}t$
between the motion of the main and secondary vortices according to the measured oscillation period
 $T$
for
 $15$
configurations (
 $\mathit{Re}_{h}\in [2113,6406]$
,
 $h/\unicode[STIX]{x1D6FF}\in [1.9,3.8]$
,
 $W/h\in [0.46,1.00]$
, in oscillating, merging and complex regimes). Dotted line is the best linear correlation (4.5), with a
 $R^{2}=0.92$
, indicating a strong link between the delay and the periodic behaviour of the HSV.

The following section aims at checking if taking this delay into account in the model is sufficient to retrieve a self-sustainable periodic behaviour for the selected oscillating regime flow i.e. if a small perturbation applied to the main vortex position while at its equilibrium position can lead to a stabilized oscillation amplitude. It is to be noted that the delay does not have to be constant during the oscillating phase but, as a result of the interaction between the main and the secondary vortices, should depend on the distance between the main and the secondary vortex and on their circulations.
This delay is added in the model by considering that
 $V_{2}$
velocity equals
 $V_{1}$
velocity, with a measured constant average delay
 $\unicode[STIX]{x0394}t$
:
 $$\begin{eqnarray}v_{2,adv}(t)=v_{adv}\left(t-\unicode[STIX]{x0394}t\right).\end{eqnarray}$$
As a lot of hypotheses have been put forward, an adjustment variable is necessary for the model to be able to reproduce the observed HSV behaviour. The most simple parameter to adjust is the delay
 $\unicode[STIX]{x0394}t$
, on which an empirical factor
 $\unicode[STIX]{x1D716}_{k}$
can be added:
 $$\begin{eqnarray}v_{2,adv}(t)=v_{adv}\left(t-\unicode[STIX]{x1D716}_{k}\unicode[STIX]{x0394}t\right).\end{eqnarray}$$
This factor is fitted on the experimental data so that the observed dynamics corresponds to the simulated one. This results in a value of
 $\unicode[STIX]{x1D716}_{k}=3$
, and gives:
 $$\begin{eqnarray}v_{2,adv}(t)=v_{adv}\left(t-3\unicode[STIX]{x0394}t\right).\end{eqnarray}$$
The necessity for this correction clearly shows that the model needs to be enhanced to properly predict the HSV behaviour. The potential enhancements are however challenging, and include: taking into account the vortex circulation and radius evolutions and removing the vortex position constraint on the shear layer. However, this model is not intended to be predictive, but rather aims at identifying the leading mechanisms at the origin of the HSV behaviour, a goal that can be fulfilled with this actual version of the model.
Numerical simulation results for the model presented in § 4.3, for: (a) a stable regime configuration (
 $\mathit{Re}_{h}=4271$
,
 $h/\unicode[STIX]{x1D6FF}=2.70$
,
 $W/h=0.79$
), (b) an oscillating regime configuration (
 $\mathit{Re}_{h}=4271$
,
 $h/\unicode[STIX]{x1D6FF}=2.70$
,
 $W/h=1.23$
) and (c) a merging regime configuration (
 $\mathit{Re}_{h}=4271$
,
 $h/\unicode[STIX]{x1D6FF}=2.70$
,
 $W/h=1.37$
). (a–c) The shear-layer measured shapes (black lines), the average measured vortex positions (dashed lines) and the computed extreme positions for the main vortex (black circles) and the secondary vortex (white circles). (d–f) The vortices’ streamwise trajectories with time (black lines). Insets show the time evolution of the main vortex oscillation amplitude. Those results are in good agreement with the observations, indicating that the mechanisms taken into account in the model are sufficient to reproduce the HSV dynamics.

4.4 Numerical simulations results
Figure 23 shows the results of simulations using the model presented in § 4.3 for a stable, an oscillating and a merging regime configurations. Firstly, regarding the simulation of the stable regime configuration,
 $V_{1}$
is initially introduced away from its equilibrium position (
 $x/W=-0.5$
instead of
 $x/W=-0.7$
). Vortices appear to rapidly reach their equilibrium positions at
 $t/T\approx 30$
(with
 $T$
the vortex position oscillation period), after a transitional damped oscillation. Then, regarding the oscillating regime configuration (figure 23
b), a small perturbation is applied to the position of the main vortex (
 $x/W=-0.62$
instead of
 $x/W=-0.61$
). The oscillation amplitude increases with time and reaches a stabilized value after
 $t/T\approx 100$
. Finally, regarding the merging regime configuration (figure 23
c), the same small perturbation is applied to the position of the main vortex. The oscillation amplitude increases but does not reach a stabilized position. The main and secondary vortices end up close to each other, in which case the simulation is stopped, as no vortex–vortex interaction model was implemented herein.
Despite the delay adjustment
 $\unicode[STIX]{x1D716}_{k}$
, the Strouhal number based on the delay
 $St_{\unicode[STIX]{x0394}t}=\unicode[STIX]{x0394}tf$
, shown to be nearly constant on experiments (
 $St_{\unicode[STIX]{x0394}t}=0.154$
), reaches a similar value of
 $St_{\unicode[STIX]{x0394}t}=0.146$
in the simulations. This shows that the relation between the delay
 $\unicode[STIX]{x0394}t$
and the periodic behaviour at frequency
 $f$
is well simulated by this model and that the proposed model is able to recreate the HSV dynamics for the stable, oscillating and merging regimes.
Conclusions can be drawn regarding the origin of the periodic motion of the HSV that: (i) the secondary vortex position has a strong influence on the velocity of the main one, represented by the parameter
 $\unicode[STIX]{x0394}y$
in the correlation (4.4). This effect may be explained by the feeding of the main vortex from the main flow (quantity of fluid ending in the main vortex), which is reduced when the secondary vortex arises. Younis et al. (Reference Younis, Zhang, Hu and Mehmood2014) linked, for stable HSV, this feeding and the vortex size, but a relation between the feeding and the vortex velocity has not been found yet; (ii) the delay
 $\unicode[STIX]{x0394}t$
between the motion of the main and the secondary vortices is strongly linked to the periodic behaviour of the HSV and is a necessary mechanism for the complex HSV dynamics.
4.5 Note on the vortex breaking
The breaking regime can also be approached using this model. For high delays
 $\unicode[STIX]{x0394}t$
and high
 $V_{1}$
advection velocities, the maximum distance
 $\unicode[STIX]{x0394}x$
between
 $V_{1}$
and
 $V_{2}$
is expected to increase. If
 $\unicode[STIX]{x0394}x$
exceeds a certain value (
 ${\approx}R_{1}+R_{2}$
according to the present observations), the main flow passes between the two vortices, cancelling the interaction between
 $V_{1}$
and
 $V_{2}$
. The main vortex motion then results in a competition between the wall influence
 $v_{wall}$
and the flow influence, reduced to a simple boundary layer (without effect of
 $V_{2}$
through
 $\unicode[STIX]{x0394}y$
). The resulting new equilibrium position is expected to be stable and located in the vicinity of the obstacle (where the flow influence is small enough to be balanced by the wall influence). The breaking vortex should, in these conditions, rapidly reach this position and disappear due to the strong stretching in the near obstacle zone.
However, an unknown critical value for
 $\unicode[STIX]{x0394}x$
, as well as a model for the vortex circulation decrease would be necessary to simulate the breaking regime.
5 Horseshoe vortex properties
This last section presents the evolution of the HSV geometrical characteristics with the dimensionless parameters of the flow and an in-depth comparison of these measurements with the well-documented immersed configurations.
5.1 Separation distance
 $\unicode[STIX]{x1D706}$

The separation distance
 $\unicode[STIX]{x1D706}$
(see figure 1) is a crucial parameter for the HSV, as it governs the shear-layer shape and the HSV streamwise dimension. Using all PIV and trajectography measurements, the following correlation was obtained:
 $$\begin{eqnarray}\frac{\unicode[STIX]{x1D706}}{W}=1.91,\end{eqnarray}$$
with a
 $R^{2}=0.95$
computed on the dimensional correlation:
 $\unicode[STIX]{x1D706}=1.91W$
. The boundary layer separation position indeed greatly depends on the adverse pressure gradient (Lighthill Reference Lighthill1963), which depends on the obstacle width, according to 2-D potential flow computations. It is interesting to see that the boundary layer separation position does not depend on
 $\unicode[STIX]{x1D6FF}$
, the boundary layer thickness measured before placing the obstacle.
Belik (Reference Belik1973) and Baker (Reference Baker1985) proposed two correlations for the separation distance
 $\unicode[STIX]{x1D706}$
for immersed cylindrical obstacles:
 $$\begin{eqnarray}\displaystyle & \displaystyle \frac{\unicode[STIX]{x1D706}_{Belik}}{D}=0.5+35.5Re_{D}^{-0.424} & \displaystyle\end{eqnarray}$$
 $$\begin{eqnarray}\displaystyle & \displaystyle \frac{\unicode[STIX]{x1D706}_{Baker}}{D}=0.5+0.338Re_{\unicode[STIX]{x1D6FF}^{\ast }}^{0.48}\left(\frac{\unicode[STIX]{x1D6FF}^{\ast }}{D}\right)^{0.48}\tanh \left(\frac{3h}{D}\right), & \displaystyle\end{eqnarray}$$
with
 $D$
the obstacle diameter. Application of these three correlations (5.1)–(5.3) are compared in figure 24 for present data and data from the literature for emerging obstacles. Both literature correlations, written for immersed obstacles, underestimate the separation distance
 $\unicode[STIX]{x1D706}$
, revealing that this distance is greater for emerging obstacles than for immersed ones. This difference can be explained by the fact that the flow cannot pass above emerging obstacles, resulting in a higher pressure gradient than for immersed obstacles, and then, a precocious boundary layer separation. Sadeque et al. (Reference Sadeque, Rajaratnam and Loewen2008) already noticed that the obstacle emergence increases the separation distance. Besides, application of (5.1) to data from the literature with emerging obstacles and turbulent boundary layers (figure 24) overestimates the separation distance
 $\unicode[STIX]{x1D706}$
. This can be explained by the fact that turbulent boundary layers separate for higher pressure gradient than laminar ones.
The apparent simplicity of correlation (5.1) compared to (5.3) and (5.2) is discussed here: (i) the boundary layer thickness
 $\unicode[STIX]{x1D6FF}$
is an important parameter for immersed obstacles, as it governs the position of the stagnation point on the face of the obstacle, and so, the down-flow and the adverse pressure gradient. For emerging obstacles, the down-flow is stronger (Sadeque et al.
Reference Sadeque, Rajaratnam and Loewen2008) and the stagnation point position always high on the obstacle face, resulting in a strong adverse pressure gradient that is not influenced by the boundary layer thickness
 $\unicode[STIX]{x1D6FF}$
. (ii) Correlations from literature are made more complex by the addition of
 $0.5D$
due to the method from Ballio et al. (Reference Ballio, Bettoni and Franzetti1998) (see § 2.5.1), and, for (5.3), by the last term (
 $\text{tanh}(3h/2D)$
) added afterwards to take into account the obstacle height.
Correlation quality for separation distance (
 $\unicode[STIX]{x1D706}$
) prediction. Black filled circle symbols stands for (5.1) applied to the present data, with dotted lines for
 $20\,\%$
confidence interval, hollow (red) squares the correlation of Belik (Reference Belik1973) (equation (5.2)) applied to the present data and hollow (blue) circles represent the correlation of Baker (Reference Baker1985) (equation (5.3)) applied to the present data. Crossed squares (yellow) represent (5.1) applied to data from the literature on emerging obstacles with turbulent boundary layers. Displayed maximum uncertainty only takes into account measurement uncertainties on PIV and trajectographies (see § 2.5.1).

5.2 Vortex position
The present section aims at proposing empirical correlations for the main vortex position along
 $x$
and
 $y$
i.e. the mean vortex position for the stable and oscillating regime configurations and the position of the vortex maximum circulation for the merging, diffusing and breaking regimes configurations. They read:
 $$\begin{eqnarray}\displaystyle & \displaystyle \frac{x_{1}}{W}=1.01, & \displaystyle\end{eqnarray}$$
 $$\begin{eqnarray}\displaystyle & \displaystyle \frac{y_{1}}{\unicode[STIX]{x1D6FF}}=0.2784+0.0229\left(\frac{W}{h}\right)^{2}, & \displaystyle\end{eqnarray}$$
with
 $R^{2}$
of respectively
 $0.96$
and
 $0.93$
on the dimensional forms of the correlations.
The main vortex position corresponds to the downstream end of the shear layer where the down-flow forces the reattachment of the boundary layer. This explains that the main vortex position is linked to the boundary layer thickness
 $\unicode[STIX]{x1D6FF}$
(governing the shear-layer shape) and the obstacle width
 $W$
(governing the down-flow), in the correlations (5.4) and (5.5).
Baker (Reference Baker1985) and Lin et al. (Reference Lin, Ho and Dey2008) correlations for the main vortex position in the case of immersed cylindrical obstacles read:
 $$\begin{eqnarray}\displaystyle & \displaystyle \frac{x_{1,Baker}}{D}=0.5+0.013Re_{\unicode[STIX]{x1D6FF}^{\ast }}^{0.67}\tanh \!\left(\frac{3h}{D}\right) & \displaystyle\end{eqnarray}$$
 $$\begin{eqnarray}\displaystyle & \displaystyle \frac{x_{1,Lin}}{\unicode[STIX]{x1D6FF}}=0.5\frac{D}{\unicode[STIX]{x1D6FF}}+0.518\left(\frac{h}{\unicode[STIX]{x1D6FF}}\right)^{0.87}\left(\frac{h}{D}\right)^{-0.34} & \displaystyle\end{eqnarray}$$
 $$\begin{eqnarray}\displaystyle & \displaystyle \frac{y_{1,Lin}}{\unicode[STIX]{x1D6FF}}=0.207\left(\frac{h}{\unicode[STIX]{x1D6FF}}\right)^{0.6}\left(\frac{h}{D}\right)^{-0.77}. & \displaystyle\end{eqnarray}$$
Application of these correlations to the present data is plotted in figures 25 and 26. Equations (5.6) and (5.7) fairly fit the present data, showing that, contrary to the separation distance
 $\unicode[STIX]{x1D706}$
, the streamwise position of the main vortex
 $x_{1}$
does not differ for immersed and emerging obstacles (and that it is not governed by the adverse pressure gradient). Moreover, figure 25 gives confidence to the equivalent diameter method described in § 2.7 and used herein.
Results for
 $y_{1}$
in figure 26 show more dispersion, due to the higher relative uncertainty in the measurement of the vortex vertical location. Correlations from the literature strongly overestimate
 $y_{1}$
. This effect may be due to the free surface, that confines the shear layer vertically.
Application of correlations for streamwise location of the main vortex (
 $x_{1}$
): black filled circles, equation (5.4) with dashed line for 10 % confidence interval; hollow (blue) circles, equation (5.6) from Baker (Reference Baker1985); and hollow (red) squares, equation (5.7) from Lin et al. (Reference Lin, Ho and Dey2008). Displayed maximum uncertainty only takes into account measurement uncertainties on PIV and trajectographies (see § 2.5.1).

Application of correlations for the vertical location of the vortex (
 $y_{1}$
): black filled circles, equation (5.5) with dashed line for 20 % confidence interval; hollow (red) squares, equation (5.8) from Lin et al. (Reference Lin, Ho and Dey2008). Displayed maximum uncertainty only takes into account measurement uncertainties on PIV or trajectographies (see § 2.5.1).

5.3 Frequency
The frequency
 $f$
associated with the HSV vortex motion (for oscillating, merging, diffusing and complex regimes) is of great importance to understand the HSV dynamics. No correlation could be found for Strouhal numbers generally used in the literature (
 $St_{\unicode[STIX]{x1D6FF}}$
and
 $St_{W}$
) nor for the Strouhal number based on the separation distance (
 $St_{\unicode[STIX]{x1D706}}$
) or on the distance between the main and the secondary vortices (
 $St_{\unicode[STIX]{x0394}x}$
). The frequency
 $f$
was however found to be mainly dependent on the bulk velocity
 $u_{D}$
as:
 $$\begin{eqnarray}f=211u_{D}^{2.33},\end{eqnarray}$$
with
 $R^{2}=0.96$
. The main conclusion of this correlation is that the obstacle width
 $W$
(see also figure 12
c) and the boundary layer thickness
 $\unicode[STIX]{x1D6FF}$
have no influence on the HSV frequency.
Thomas (Reference Thomas1987) measured the HSV oscillation frequency for immersed obstacles in a wind tunnel with increasing obstacle width and observed the linear correlation (for Reynolds
 $\mathit{Re}_{W}=u_{D}W/\unicode[STIX]{x1D708}$
ranging from 2320 to 10 800):
 $$\begin{eqnarray}St_{W}=2.47\times 10^{-5}\mathit{Re}_{W}\end{eqnarray}$$
that is:
 $$\begin{eqnarray}f=1.8u_{D}^{2},\end{eqnarray}$$
which confirms that the obstacle transverse dimension
 $W$
has no influence on the oscillating frequency. The order of magnitude difference between the factor of
 $1.8$
found by Thomas (Reference Thomas1987) and the present factor of
 $211$
can be explained by the difference of fluid used: air for Thomas (Reference Thomas1987) and water in the present study.
As seen in § 4.3, a correlation can still be found with the average delay
 $\unicode[STIX]{x0394}t$
between the motion of
 $V_{1}$
and
 $V_{2}$
(4.5).
5.4 Vortex number
At a given time, the vortices are detected using critical points on PIV measurements, and using particle trajectories on trajectography measurements. The average number of vortices (not including counter-rotating ones
 $V_{ci}$
) varies from
 $1$
to
 $3.5$
on the observed coherent regimes configurations.
The evolution of the vortex number should be strongly correlated to the shear-layer shape. Indeed, vortices follow each other along the shear layer at a distance from each other roughly equal to the sum of the vortex radii (which is correlated to their elevation
 $y_{i}$
). In such case, the vortex number is expected to increase with the streamwise extension of the shear layer (equal to
 $\unicode[STIX]{x1D706}-x_{1}$
) and decrease with the shear-layer elevation (because of the subsequent decrease of the vortex radii).
Figure 27 confirms this statement: (i) for a constant
 $\unicode[STIX]{x1D706}-x_{1}$
, the vortex number decreases as
 $y_{1}$
increases and (ii) for a constant
 $y_{1}$
, the vortex number increases as
 $\unicode[STIX]{x1D706}-x_{1}$
increases.
Comparison of the present data with the observations of Baker (Reference Baker1978) for immersed obstacles is presented in figure 28 and reveals that the vortex number (and so the shear layer shape evolution) differs greatly for the two emerging and immersed obstacles configurations.
Average vortex number evolution with the main vortex altitude
 $y_{1}$
and the shear-layer streamwise extension:
 $\unicode[STIX]{x1D706}-x_{1}$
for the coherent regime configurations. Non-integer values for the vortex number are associated with HSV with a non-constant number of vortices. The visible continuous evolution (despite the non-homogeneous mapping), indicates that the vortex number is governed by the shear-layer shape.

Comparison of the HSV number of vortices with the observations of Baker (Reference Baker1978). Circles represent data from the present study and are coloured according to the observed vortex number.
 $\unicode[STIX]{x1D6FF}^{\ast }$
is the boundary layer momentum thickness. Black lines represent the domain of constant vortex number observed by Baker (Reference Baker1978) (one vortex, two vortices, three vortices and unsteady system). The bad agreement illustrates the differences between the immersed and emerging configurations in terms of dynamics.

5.5 Conclusion on the impact of the emergence
The main difference between emerging and immersed obstacle configurations is the impossibility for the flow to pass over the obstacle in the first case. This has three main consequences: (i) the adverse pressure gradient is stronger in the case of an emerging obstacle, leading to a precocious boundary layer separation (longer
 $\unicode[STIX]{x1D706}$
, see figure 24). (ii) For an emerging obstacle, the whole flow facing the obstacle is deflected by the obstacle while for an immersed obstacle, the position of the flow stagnation point elevation along the upstream obstacle face (dependent on the boundary layer thickness) governs the quantity of fluid to be deflected. This lead to a larger dependency on the boundary layer thickness
 $\unicode[STIX]{x1D6FF}$
in the case of immersed obstacles. (iii) The difference of shear-layer shape leads to a different vortex number. Nevertheless, the two configurations (immersed and emerging) share similarities in terms of: (i) main vortex distance to the obstacle, (ii) frequency dependency on the bulk velocity
 $u_{D}$
, and (iii) dynamics regimes of the HSV vortices.
6 Conclusion
Trajectographies and PIV measurements to investigate the HSV developing at the toe of a rectangular obstacle emerging from a laminar free-surface flow. In this context, vortex tracking methods based on critical points detection appeared to be valuable tools to extract and summarize the HSV vortex motion patterns.
The HSV dynamics was categorized using a typology adapted from the existing ones for immersed obstacle, by adding the newly observed complex regime, separating the coherent and the irregular evolutions (leading to a two-dimensional typology) and giving clear definitions of the different regimes. The observations of the complex regime and the investigation of the transitions between the different regimes showed the importance of considering the HSV as a dynamical system built on quasi-similar phases and undergoing a chaotic transition. The coherent regime evolution was shown to depend on the three dimensionless parameters (
 $\mathit{Re}_{h}$
,
 $h/\unicode[STIX]{x1D6FF}$
and
 $W/h$
), in a continuous way from stable to complex regimes. The irregular evolution is more complex, as it is linked to local vortex instabilities, but showed a main dependency on the Reynolds number
 $\mathit{Re}_{h}$
.
A model for the main and secondary vortex motion was proposed and succeeded in reproducing the dynamics of the stable, oscillating and merging regimes. This result allowed to identify two mechanisms of importance for the HSV dynamics. Firstly the secondary vortex position has an influence on the main vortex velocity, certainly by modifying the quantity of fluid feeding it. And secondly, the phase shift existing between the main and secondary vortex motion allows the appearance of a periodic motion in the present model.
Besides, the extraction of the HSV geometrical parameters allowed to highlight their correlations with the dimensionless parameters of the flow in the case of an emerging obstacle, showing that: (i) the separation distance
 $\unicode[STIX]{x1D706}$
is mainly linked to the adverse pressure gradient, (ii) the main vortex position depends on the shear-layer shape and on the down-flow strength, (iii) the number of vortices composing the HSV is governed by the shear-layer shape, and (iv) the effect of the free-surface confinement on the HSV is mainly indirect, through the limitation of the boundary layer thickness
 $\unicode[STIX]{x1D6FF}$
.
Finally, the comparison with existing results for immersed obstacles indicated that the emerging configuration exhibits a higher adverse pressure gradient, due to a more important blocking effect, and a stronger down-flow, due to the impossibility for the flow to bypass the obstacle by the top. This implies a higher separation distance
 $\unicode[STIX]{x1D706}$
, a lower main vortex altitude
 $y_{1}$
, and consequently, a larger number of vortices in the HSV in the emerging obstacle configuration (Launay, Mignot & Riviere Reference Launay, Mignot and Riviere2017). The modification of these basic HSV properties is supposed to result in strong modifications of the HSV dynamics, making the comparison of the typology evolution for immersed and emerging configurations challenging.
In light of these results, some questions arise and should be the subject of future investigation on this topic. Firstly, the impact of the obstacle elongation (
 $L/W$
), kept very high in this study, on the HSV is being investigated by Launay et al. (Reference Launay, Mignot and Riviere2017). This parameter modifies the adverse pressure gradient, and, for sufficiently low
 $L/W$
, the wake should be able to influence the HSV dynamics. Secondly, the model presented in § 4 should be extended to reproduce the other coherent regimes (merging, diffusing, breaking and complex). This will only be possible by including additional ingredients in the model, such as the vortex circulation variation during a phase and the vortex merging, which are both challenging to handle. Thirdly, little is known on the effect of a free-surface confinement on a HSV borne of a turbulent boundary layer. Notably, the bi-modal behaviour (previously reported for non-confined flows) should be influenced by the vertical confinement, as the zero-flow mode will be strongly modified. Fourthly, experiments or numerical simulations on flows around emerging obstacles with rounded or streamlined upstream faces would make it possible to confirm the validity of the equivalent diameter method for more complex obstacle shapes. Finally, from a more application-oriented point of view, the effect of the HSV regime on the thermal exchanges, obstacle drag coefficient, wall shear stress and downstream boundary layer properties could be investigated.