Introduction
Maternal effect genes (MEG) regulate oocyte nuclear maturation, successful processing the sperm nucleus, the organization of the two pronuclei, first embryo cleavages and finally, activation of the embryonic genome (Heikinheimo & Gibbons, Reference Heikinheimo and Gibbons1998). Among these genes, zygote arrest 1 (ZAR-1) that encodes a transcription regulator, seems to play an essential role in oocyte to embryonic transition. Embryos were recovered from the Zar-1 knockout mice arrested before the 1- or 2-cell transition, which corresponds with the activation of embryonic transcription (Wu et al., Reference Wu, Viveiros, Eppig, Bai, Fitzpatrick and Matzuk2003). In the pig, mRNA expression for this gene was reported up to the 5- to 8-cell stage and then it declined sharply in the morulae and blastocysts (Uzbekova et al., Reference Uzbekova, Roy-Sabau, Dalbiès-Tran, Perreau, Papillier, Mompart, Thelie, Pennetier, Cognie, Cadoret, Royere, Monget and Mermillod2006). Nucleoplasmin 2 (NPM2) appears to be essential for proper histone deacetylation and heterochromatin formation surrounding nucleoli in oocytes/early embryos, and developmentally associated protein 3 (DPPA3) appears to be essential for maintaining the correct pattern of chromatin methylation after fertilization (Burns et al., Reference Burns, Viveiros, Ren, Wang, DeMayo, Frail, Eppig and Matzuk2003; Nakamura et al., Reference Nakamura, Arai, Umehara, Masuhara, Kimura, Taniguchi, Sekimoto, Ikawa, Yoneda, Okabe, Tanaka, Shiota and Nakano2007). Npm 2 knockout mice embryos failed preimplantation development resulting from improper nuclear and nucleolus organization (Burns et al., Reference Burns, Viveiros, Ren, Wang, DeMayo, Frail, Eppig and Matzuk2003; Lingenfelter et al., Reference Lingenfelter, Tripurani, Tejomurtula, Smith and Yao2011), whereas it was reported that Dppa3-deficient mice embryos are characterized by impaired DNA replication and abnormal segregation of maternal chromosomes (Nakatani et al., Reference Nakatani, Yamagata, Kimura, Oda, Nakashima, Hori, Sekita, Arakawa, Nakamura and Nakano2015). Nevertheless, no information is available concerning the expression of these genes during porcine oocyte maturation and embryo development.
One of the common practices for improving in vitro embryo production (IVP) efficiency is the introduction of supplements into the culture system (Neira et al., Reference Neira, Tainturier, Peña and Martal2010). Among the employed supplements, epidermal growth factor (EGF) has been reported mainly as a key mediator of gonadotropin-induced oocyte nuclear maturation and ovulation in vitro (Richani et al., Reference Richani, Wang, Zeng, Smitz, Thompson and Gilchrist2014). Moreover, EGF may also participate in post-fertilization embryonic development because the EGF receptor (EGFR) has been found in porcine embryos (Lee et al., 2005). However, the role of cytokines and their associated mechanisms of action has been explored less extensively, particularly regarding porcine IVP. IL-1 activity was found in the preovulatory porcine follicular fluid, and in vitro studies revealed that this factor is able to affect the growth and the main cellular functions of porcine granulosa cells (Yasuda et al., Reference Yasuda, Fukuoka, Taii, Takakura and Mori1990). The expression of IL-1β mRNA was also found in the pig oviduct and endometrium as early as 5 to 6 h after insemination, increasing significantly after 40 h by Jiwakanon et al. (Reference Jiwakanon, Berg, Persson, Fossum and Dalin2010; Reference Jiwakanon, Persson, Berg and Dalin2011), this observation suggests that IL-1β may act in oviductal transport and early preimplantation development of embryos in this species. Recently published papers also indicated a role of LIF in porcine ovary function. Ropka-Molik et al. (Reference Ropka-Molik, Oczkowicz, Mucha, Piórkowska and Piestrzyńska-Kajtoch2012) found that the mRNA for this gene was expressed in the prepubertal porcine ovary, and Dang-Nguyen et al. (Reference Dang-Nguyen, Haraguchi, Kikuchi, Somfai, Bodó and Nagai2014) suggested that LIF acts on porcine oocytes through the LIF/STAT3 pathway, furthermore providing in vitro-produced embryos with LIF increased blastocyst rates and blastomere numbers in pigs (Choi et al., Reference Choi, Kim, Park, Song, Moon and Lee2014).
Our previous studies have revealed that the application of different estrus stimulation protocols affected MEG transcripts utilization during porcine oocyte maturation in vivo (Bogacki et al., Reference Bogacki, Wasielak, Kitewska, Bogacka and Jalali2014). Therefore, we hypothesize that in vitro culture conditions may also affect MEG expression in porcine oocytes and throughout embryonic development. The present study was undertaken to determine, for the first time, whether EGF, IL-1β and LIF inclusion in the porcine IVP system may influence ZAR-1, NPM2 and DPPA3 mRNA level in oocytes matured and embryos cultured in vitro.
Materials and methods
Oocyte collection and maturation
Porcine ovaries were obtained at a local slaughterhouse and transported to the laboratory in phosphate-buffered saline (PBS) in a thermobox at 38°C. COCs were recovered from follicles with a diameter of 2 to 6 mm using an 18-gauge needle fixed to a 10-ml syringe. The medium used for COC collection was Medium 199 (Sigma-Aldrich, St. Louis, MO, USA) supplemented with 0.68 mM l-glutamine (Sigma-Aldrich), 20 mM HEPES (Sigma-Aldrich), penicillin–streptomycin solution (Sigma-Aldrich) (containing 100 IU/ml of penicillin and 0.1 mg/ml of streptomycin), amphotericin B (2.5 µg/ml) and 10% fetal bovine serum (FBS; Sigma-Aldrich). Following morphological evaluation, oocytes with a homogenous ooplasm surrounded by at least three compact cumulus cell layers were washed three times and then matured in 500 µl NCSU-37 medium containing 10% (v/v) porcine follicular fluid, 10 IU/ml of pregnant mare serum gonadotropin (PMSG) (Folligon®; Intervet, The Netherlands), 10 IU/ml of hCG (Chorulon®; Intervet, The Netherlands), 0.6 mM l-cysteine (Sigma-Aldrich), and 1 mM dibutyryl cAMP (Sigma-Aldrich). COCs were matured in four groups: without additional factors (control) or with the addition of 10 ng/ml of EGF or IL-1β or 50 ng/ml of LIF (Sigma-Aldrich) to the NCSU-37 medium. After 20 to 22 h, the COCs were transferred to NCSU-37 medium without hormones and dibutryl cAMP and cultured for the next 24 h under the same culture conditions. Maturation was performed in an atmosphere of 5% CO2 in air at 38°C. Then, the maturation stage of the oocytes was determined by checking the extrusion of the first polar body (PB1) under an inverted microscope. Cumulus cells were removed using a hyaluronidase solution (1000 IU/ml) by vortexing for 2 min. Only oocytes that achieved the metaphase II (MII) stage (with visible PB1) were collected and placed (10 oocytes per sample) in 20 µl of RNA extraction buffer (Arcturus PicoPure RNA Isolation Kit; Life Technologies, Carlsbad, CA, USA) and stored at −80°C until the time of RNA isolation.
In vitro fertilization and culture of embryos
In the second experiment, after 44 h of maturation in the above-described conditions (groups), the COCs were subjected to in vitro fertilization with fresh porcine semen from Large White boars of tested fertility. The semen was obtained from the Animal Insemination Centre in Bydgoszcz, Poland. Briefly, the semen was centrifuged to remove extender at 800 g for 15 min and then processed via purification in a Percoll gradient (90% and 45%; 1000 g for 10 min). Subsequently, the sperm was washed in 6 ml of Medium 199 supplemented with 0.68 mM l-glutamine, 20 mM HEPES, 100 U/ml of penicillin, 0.1 mg/ml of streptomycin, 2.5 µg/ml of amphotericin B, 0.91 mM sodium pyruvate, 4.12 mM calcium lactate, 3.0 mM glucose, and 10% FBS (Sigma-Aldrich) and centrifuged at 300 g for 8 min. The obtained pellet was resuspended in 0.5 ml of Medium 199, and the concentration and motility of the spermatozoa were determined by hemocytometer using a heated microscope stage. The COCs were washed and placed in 90 µl of fertilization drops covered with mineral oil (approximately 15 COCs per drop). Then, 10 µl of the sperm suspension were added to each fertilization drop to adjust the final concentration to 1 × 10⁷ sperm/ml. For fertilization, modified pig-fertilization medium was used. Modification included the addition of 8 mM CaCl2, 2 mM sodium pyruvate, 2 mM caffeine and 5 mg/ml of bovine serum albumin (BSA fraction V; Sigma-Aldrich) to the medium consisting of 90 mM NaCl, 12 mM KCl, 25 mM NaHCO3, 0.5 mM NaH2PO4, 0.5 mM MgSO4, 10 mM sodium lactate and 10 mM HEPES (Sigma-Aldrich) (Kikuchi et al., Reference Kikuchi, Onishi, Kashiwazaki, Iwamoto, Noguchi, Kaneko, Akita and Nagai2002).
Gametes were incubated together for 5 to 6 h at 38°C in an atmosphere of 5% CO2 in air. Following incubation, the cumulus cells were removed by pipetting in a hyaluronidase solution (1000 IU/ml), and putative zygotes were used for culture. Embryos were cultured in 70-µl drops (up to 30 putative zygotes per drop) under mineral oil. The basic medium for embryo culture was NCSU-37 with 4 mg/ml of BSA (BSA fraction V; Sigma-Aldrich) supplemented with 0.165 mM sodium pyruvate and 2.7 mM sodium lactate from Days 0 to 2 or 5.56 mM glucose from Days 2 to 7. The embryos were cultured in four groups: without additional factors (control) or with the addition of 10 ng/ml of EGF or IL-1β or 50 ng/ml of LIF (Sigma-Aldrich) to the NCSU-37 medium. Then, embryos at the following stages of development were collected: 2-cell embryos (~30 hours post-insemination (hpi)), 4- and 8-cell embryos (~48 hpi), morulae (5 days post-insemination (dpi)) and blastocysts (7 dpi). The collected embryos (five per sample for each developmental stage) were preserved in 20 µl of RNA extraction buffer (Arcturus PicoPure RNA Isolation Kit) and stored at −80°C until the time of RNA isolation. The developmental rates were calculated on Day 2 pi (cleaved embryos) and on Day 7 pi (blastocyst) as the percentage of cleaved embryos (Day 2) or blastocysts (Day 7) relative to the number of presumptive zygotes. Additionally, the percentages of particular developmental stages on Day 2 (2-, 4/8- and >8-cell embryos) and Day 7 (blastocysts and expanded blastocysts) were calculated.
Real-time polymerase chain reaction (PCR)
Prior to RNA isolation, 10 pg of luciferase control RNA per oocyte/embryo (Promega, Madison, WI, USA) was added to each sample as a reference for mRNA quantification during PCR analysis. Total RNA was isolated from oocytes and embryos using the Arcturus PicoPure RNA Isolation Kit (Life Technologies) and checked for quantity and quality using a NanoDrop® system (ND-1000; Thermo Scientific, Waltham, MA, USA). During the RNA isolation procedure, DNase treatment was performed using the RNase-free DNase Set (Qiagen, Germantown, MD, USA). Then, the RNA was reverse transcribed using a Transcriptor High Fidelity cDNA Synthesis Kit (Roche, Basel, Switzerland). The reaction was performed in a total volume of 20 µl, including RNA, water, 60 µM random hexamer primers, reaction buffer, 5 mM DTT, 20 U of Protector RNase inhibitor, 1 mM deoxynucleotide mix, and 10 U of reverse transcriptase. The template–primer mixture was first denatured by heating the tube for 10 min at 65°C in a thermocycler (SensoQuest GmbH, Göttingen, Germany). Then, after adding the remaining components of the mixture, the following thermal profile was applied for the reaction: 10 min at 29°C, then 1 h at 48°C followed by inactivation of the reverse transcriptase for 5 min at 85°C, with subsequent cooling to 4°C. The obtained cDNA was kept at −20°C until the time of qPCR analysis.
The SYBR Select Master Mix (Life Technologies) was used for PCR analysis. The primers used for PCR and the associated GenBank accession numbers or references are included in Table 1. The PCR mix consisted of 3 µl of cDNA equal to 0.035 oocyte/embryo for ZAR-1, NPM2 and DPPA3 analysis, 1 µl each of forward and reverse primers (0.2 µM each) and 5 µl of SYBR Select Master Mix. The 384-well plates were prepared using a Bravo Automated Liquid Handling Platform (Agilent Technologies, Inc., Santa Clara, CA, USA). The analysis was performed in duplicate for each sample, at a final volume of 10 µl, using the ViiA™ 7 system (Life Technologies). Each run included a non-template control (NTC). The following thermal profile was used for the amplification of the investigated genes: heat-labile uracil-DNA glycosylase (UDG) activation at 50°C for 2 min, AmpliTag® DNA Polymerase activation at 95°C for 2 min, followed by 45 cycles of denaturation at 95°C for 15 s, annealing at 55°C (for ZAR-1), 56°C (for NPM2), or 60°C (for DPPA3 and luciferase) for 15 s, and elongation at 72°C for 1 min. After the end of the last cycle, the melting curve was generated. The PCR efficiency for each gene was determined by analyzing the raw fluorescence data using Real-time PCR Miner software (Zhao and Fernald, Reference Zhao and Fernald2005). The final quantification was reported as the relative mRNA level (average value from duplicates; 0 when not detected) after normalization to luciferase mRNA level in the same samples. Due to the very particular regulation of gene expression throughout oocyte maturation and embryo development, an exogenous RNA is usually used as a reference (Romar et al., Reference Romar, De Santis, Papillier, Perreau, Thelie, Dell'Aquila, Mermillod and Dalbie2011; Kohata et al., Reference Kohata, Izquierdo-Rico, Romar and Funahashi2013).
Primers used for real-time PCR

Statistical analysis
The statistical analysis was carried out using GraphPad PRISM v.6.0 software (GraphPad Software, Inc., San Diego, CA, USA). In total, five or six experiment replicates were conducted for each treatment regarding oocyte maturation and embryo developmental rate, while for gene expression analysis four replicates per each developmental stage for each treatment were used. The normal distribution of the data and the equality of variances were tested before analysis. The data concerning the oocyte maturation rate, the cleavage rate on Day 2, the percentages of 2-, 4-/8-cell embryos on Day 2 and blastocyst and expanded blastocysts on Day 7 were normally distributed and analyzed using one-way analysis of variance (ANOVA) with Dunnett's post-test, comparing the mean of each treatment to the mean of the control. The data related to the percentage of >8-cell embryos on Day 2, the blastocyst rate on Day 7 and mRNA level of ZAR-1, NPM2 and DPPA3 in porcine MII oocytes and at particular stages of embryo development in vitro were not normally distributed and were analyzed using the non-parametric Kruskal–Wallis test with Dunn's post-test, comparing the mean of each treatment to the mean of the control. For determination of cleavage rate on Day 2, 4- or 8-cell embryos were considered together, while for the analysis of gene mRNA level, these two developmental stages were collected separately. Data are presented as mean ± standard error of the mean (SEM). Differences were considered to be significant at P < 0.05.
Results
Maturation of oocytes and development of porcine embryos in vitro: effect of EGF, IL-1β and LIF addition to the oocyte maturation and embryo culture medium
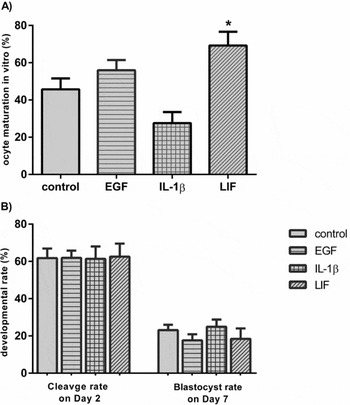
The maturation of porcine oocytes in medium supplemented with EGF (10 ng/mL) and IL-1β (10 ng/mL) did not significantly affect the percentage of MII oocytes after 44–46 h (P > 0.05; Fig. 1 A). However, the addition of LIF (50 ng/ml) to the in vitro maturation medium resulted in significantly increased rates of MII oocytes in comparison with the control group (P < 0.05; Fig. 1 A).
Porcine oocyte maturation and embryo development in vitro. The percentages of MII oocytes are expressed relative to the total number of oocytes subjected to in vitro maturation (A). The percentages of cleaved embryos on Day 2 and blastocysts on Day 7 of culture are expressed relative to the total number of presumptive zygotes used for in vitro culture (B). In total, five or six experiments were conducted for each treatment. Asterisk above the bars indicate statistically significant differences from the control group at P < 0.05.

With respect to the parameters characterizing the developmental rates of porcine embryos in vitro (i.e., cleavage rate on Day 2 and blastocyst rate on Day 7) we did not find any significant differences when comparing EGF, IL-1β and LIF treatment to the control (P > 0.05; Fig. 1 B). Moreover, the percentages of particular developmental stages (2- and 4⁄8-cell embryos on Day 2) were comparable in the case of all treatments versus the control group. However, we did not find any >8-cell embryos on Day 2 in the IL-1β- and LIF-treated groups. In addition, no significant differences in the percentages of blastocysts and expanded blastocysts on Day 7 were observed between the investigated groups and the control (P > 0.05).
ZAR-1, NPM2 and DPPA3 mRNA level in porcine MII oocytes matured and embryos produced in vitro: effect of EGF, IL-1β and LIF addition to the oocyte maturation and embryo culture medium
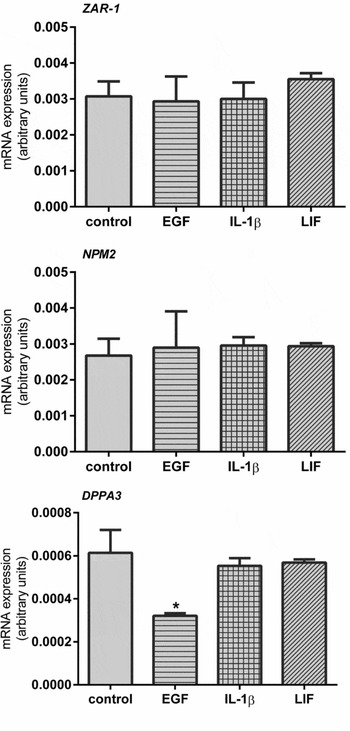
We found that the mRNA level of ZAR-1 and NPM2 in porcine MII oocytes obtained in vitro was not affected by in vitro maturation medium supplementation with EGF, IL-1β or LIF (P > 0.05; Fig. 2). In contrast with this observation, EGF addition to the in vitro maturation medium resulted in lower mRNA level of DPPA3 in porcine MII oocytes than in the control oocytes (P < 0.05; Fig. 2).
ZAR-1, NPM2 and DPPA3 mRNA levels in porcine MII oocytes obtained in vitro in NCSU-37 medium supplemented with 10 ng/ml of EGF, 10 ng/ml of IL-1β and 50 ng/ml of LIF. The data were normalized to the luciferase mRNA level and are presented in arbitrary units as the mean ± standard error of the mean (SEM). For each treatment four replicates were analyzed. Asterisks above the bars indicate statistically significant differences from the control group at P < 0.05.

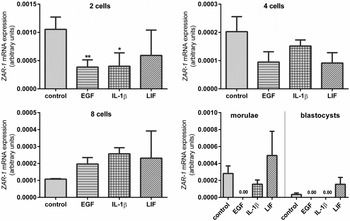
We found that ZAR-1 mRNA level was downregulated by EGF and IL-1β addition to the culture medium, but only in 2-cell porcine embryos (P < 0.05; Fig. 3). In addition, after EGF supplementation, ZAR-1 mRNA was not detected in porcine morulae and blastocysts obtained in vitro. Additionally, IL-1β also decreased ZAR-1 mRNA level to not detected values in porcine blastocysts (Fig. 3).
ZAR-1 mRNA level in porcine embryos (2-, 4-, and 8-cell embryos, morulae and blastocysts) produced in vitro in NCSU-37 medium supplemented with 10 ng/ml of EGF, 10 ng/ml of IL-1β and 50 ng/ml of LIF. The data were normalized to luciferase mRNA level and are presented in arbitrary units as the mean ± standard error of the mean (SEM). For each treatment four replicates per developmental stage were analyzed. Asterisks above the bars indicate statistically significant differences from the control group at P < 0.05.

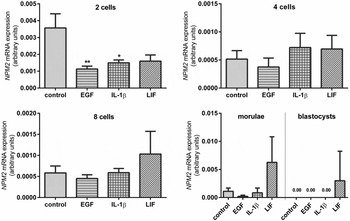
In porcine 2-cell embryos, we observed that supplementation of the medium with EGF and IL-1β decreased NPM2 mRNA level significantly compared with the mRNA level of this factor in the 2-cell embryos from the control group (P < 0.05; Fig. 4). However, this effect was not sustained at later stages (i.e., 4- and 8-cell embryos and morulae) (P > 0.05). We did not detect NPM2 mRNA in porcine blastocysts from the control, EGF- and IL-1β-treated groups (Fig. 4).
NPM2 mRNA level in porcine embryos (2-, 4-, and 8-cell embryos, morulae and blastocysts) produced in vitro in NCSU-37 medium supplemented with 10 ng/ml of EGF, 10 ng/ml of IL-1β and 50 ng/ml of LIF. The data were normalized to luciferase mRNA expression and are presented in arbitrary units as the mean ± standard error of the mean (SEM). For each treatment four replicates per developmental stage were analyzed. Asterisks above the bars indicate statistically significant differences from the control group at P < 0.05.

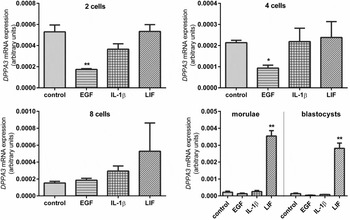
Treatment of embryos with EGF resulted in decreased mRNA level of DPPA3 in both 2- and 4-cell embryos produced in vitro (P < 0.05; Fig. 5). Nevertheless, we did not observe any effect of EGF or cytokines (IL-1β and LIF) on DPPA3 mRNA level in 8-cell embryos. Additionally, DPPA3 mRNA was expressed at higher levels in porcine morulae and blastocysts cultured with LIF supplementation than in morulae and blastocysts obtained under control conditions (P < 0.05; Fig. 5).
DPPA3 mRNA level in porcine embryos (2-, 4-, and 8-cell embryos, morulae and blastocysts) produced in vitro in NCSU-37 medium supplemented with 10 ng/ml of EGF, 10 ng/ml of IL-1β and 50 ng/ml of LIF. Data were normalized to luciferase mRNA level and are presented in arbitrary units as the mean ± standard error of the mean (SEM). For each treatment four replicates per developmental stage were analyzed. Asterisks above the bars indicate statistically significant differences from the control group at P < 0.05.

Discussion
We found that the nuclear maturation of oocytes was stimulated by LIF treatment. Similar results were obtained by Dang-Nguyen et al. (Reference Dang-Nguyen, Haraguchi, Kikuchi, Somfai, Bodó and Nagai2014) in pigs and Mo et al. (Reference Mo, Wu, Yuan, Jia, Liu, Zhu and Hou2014) in bovine. The potential mechanism of LIF action on the oocyte maturation may be dependent on the signal transducer and activator of transcription 3 (STAT3) pathway. It was found that LIF addition to the culture medium increased phosphorylation of STAT3 in porcine and bovine oocytes (Dang-Nguyen et al., Reference Dang-Nguyen, Haraguchi, Kikuchi, Somfai, Bodó and Nagai2014; Mo et al., Reference Mo, Wu, Yuan, Jia, Liu, Zhu and Hou2014). The mean oocyte maturation rate obtained after LIF treatment in our study was lower (~70%) comparing with the maturation rate (86.6%) presented by Dang-Nguyen et al. (Reference Dang-Nguyen, Haraguchi, Kikuchi, Somfai, Bodó and Nagai2014). This could results from the fact that we observed relatively low, although corresponding with the recent data of Jeung et al. (Reference Jeung, Jeon, Biswas, Choi, Jeung and Hyun2012) and Wu et al. (Reference Wu, Jia, Mo, Liu, Fu, Zhu and Hou2013), maturation rate in our control conditions.
The studies of Dang-Nguyen et al. (Reference Dang-Nguyen, Haraguchi, Kikuchi, Somfai, Bodó and Nagai2014) revealed that porcine oocytes receiving LIF supplementation exhibited significantly higher cleavage rates and blastocyst yields and more rapid blastocyst development. As observed by Choi et al. (Reference Choi, Kim, Park, Song, Moon and Lee2014) in pigs, the addition of LIF only to the embryo culture medium can also improve the efficiency of in vitro culture systems by increasing embryo development to the blastocyst stage and blastocyst cell numbers. In our study, the total cleavage and blastocyst rates after LIF treatment were not enhanced compared with those obtained in the control group (NCSU-37 medium). These results indicate that there is no further advantage of the presence of LIF during in vitro embryo culture on embryo developmental parameters.
In our study, oocyte maturation was not affected by medium supplementation with EGF, which is consistent with the results of Abeydeera et al. (Reference Abeydeera, Wang, Cantley, Rieke, Prather and Day1998) and Marques et al. (Reference Marques, Nicacio, de Oliveira, Nascimento, Caetano, Mendes, Mello, Milazzotto, Assumpção and Visintin2007). Conversely, several papers revealed a beneficial effect of EGF on porcine oocyte developmental competence (Zhang et al., Reference Zhang, Chen, Yang, Liu, Zhang, Xia and Wang2014; Valleh et al., Reference Valleh, Rasmussen and Hyttel2015). EGF signals through the EGFR, which is expressed in follicular somatic cells. The EGF signalling deficiency that was potentially observed in our study may result from the fact that we used COCs recovered from follicles with a diameter between 2 and 6 mm for in vitro maturation. It was recently found that CCs of porcine COCs obtained from small follicles (<4 mm) were incapable of responding to a range of EGF-like factors (Litter et al., Reference Litter, Sugimura and Gilchrist2015).
Although the EGFR was found to be present in porcine IVF-produced embryos (Lee et al., Reference Lee, Kim, Hyun, Jeon, Nam, Jeong, Kim, Kim, Kang, Lee and Hwang2005), we did not observe any effect of the addition of EGF to the culture medium on porcine embryo cleavage and development to the blastocyst stage. In the cited studies of Lee et al. (Reference Lee, Kim, Hyun, Jeon, Nam, Jeong, Kim, Kim, Kang, Lee and Hwang2005), it was found that a dose of 10 ng/ml of EGF improved the cleavage rate but not the rate of blastocyst formation and the total blastocyst cell number of SCNT obtained embryos. The discrepancy between the studies may be explained by the fact that Lee et al. (Reference Lee, Kim, Hyun, Jeon, Nam, Jeong, Kim, Kim, Kang, Lee and Hwang2005), investigated the effect of EGF treatment on porcine SCNT embryos which are known to be more easily affected by culture environment than IVF embryos used in our experiments (Yamanaka et al., Reference Yamanaka, Sugimura, Wakai, Kawahara and Sato2009).
We observed no effect of porcine IVP medium supplementation with IL-1β on oocyte maturation or embryo development to the blastocyst stage. Although some assumptions were made concerning the stimulatory role of IL-1β in periovulatory events and early embryogenesis (Takakura et al., Reference Takakura, Taii, Fukuoka, Yasuda, Tagaya, Yodoi and Mori1989; Yasuda et al., Reference Yasuda, Fukuoka, Taii, Takakura and Mori1990; Jiwakanon et al., Reference Jiwakanon, Berg, Persson, Fossum and Dalin2010; Reference Jiwakanon, Persson, Berg and Dalin2011), this cytokine instead rather interferes with oocyte maturation in vitro and does not influence embryo development in pigs.
In the present paper, we described for the first time the effect of in vitro maturation/culture with different medium supplements on the mRNA level of MEG (ZAR-1, NPM2 and DPPA3) in porcine MII oocytes and throughout embryonic development.
Our results indicate that the addition of EGF to the in vitro maturation medium affected DPPA3 mRNA expression, causing its down-regulation in MII oocytes. Interestingly, this effect was also sustained after fertilization until the 4-cell stage. Available data indicate that DPPA3 is a maternal factor that controls the proper maintenance of germline differently methylated regions (Nakamura et al., Reference Nakamura, Arai, Umehara, Masuhara, Kimura, Taniguchi, Sekimoto, Ikawa, Yoneda, Okabe, Tanaka, Shiota and Nakano2007). By affecting DPPA3 mRNA level in porcine oocytes and in vitro-obtained 2- and 4-cell embryos, EGF may indirectly influence the process of imprinted gene expression. Moreover, recent studies of ovarian cancer cells revealed that the EGFR is able to affect DNA methylation by changing DNA methyltransferase (DNMT) activity (Samudio-Ruiz & Hudson, Reference Samudio-Ruiz and Hudson2012). In contrast with the observations concerning MII oocytes, we reported increased mRNA level of DPPA3 in porcine blastocysts cultured with the addition of LIF to the medium in comparison with blastocysts obtained under the control conditions. The presence of DPPA3 mRNA at the blastocyst stage suggests its role beyond the processes related to early cleavages and embryonic genome activation. The expression pattern of DPPA3 in mice and humans, in undifferentiated embryonic cells, embryonic germ cells and adult germ cell tumours, indicates that this gene also participates in maintaining cell pluripotentiality (Bowles et al., Reference Bowles, Teasdale, James and Koopman2003). In studies of pigs, the use of cytokines, including LIF, was a very effective approach for the generation of porcine pluripotent embryonic stem cells (Jung et al., Reference Jung, Kim, Kim, Lee, You, Lee, Lim, Yun, Song and Cha2014). Taken together, we found that DPPA3 mRNA may be regulated by EGF during oocyte maturation and two first cleavages, when its role is connected with the control of proper chromatin methylation; and LIF at morula/blastocyst stage, when its function is more related to pluripotency and differentiation.
Similar to the findings related to DPPA3 mRNA expression, EGF treatment affected ZAR-1 and NPM2 mRNA levels in 2-cell embryos. Additionally, ZAR-1 and NPM2 mRNA was not detected in the porcine morulae and blastocysts cultured with addition of EGF to the medium. A study performed by Uzbekova et al. (Reference Uzbekova, Roy-Sabau, Dalbiès-Tran, Perreau, Papillier, Mompart, Thelie, Pennetier, Cognie, Cadoret, Royere, Monget and Mermillod2006) showed that the ZAR1 protein plays a role as a transcription-regulating factor, while NPM2 plays a significant role in nuclear and nucleolar organization (Burns et al., Reference Burns, Viveiros, Ren, Wang, DeMayo, Frail, Eppig and Matzuk2003). The possible participation of EGF in the regulation of ZAR-1 and NPM2 function in pigs is difficult to explain. However, considering the available information about the nuclear localization of the EGFR within several cell types, such as the mouse uterus, developing mouse embryos, and immortalized epithelial cells of the ovary (Scaltiri & Baselaga, Reference Scaltiri and Baselaga2006) and the ability of the EGFR to act as a proper transcription factor or as a co-regulator of other gene transactivators, we believe that EGF may affect the expression of factors connected to transcription and nuclear function, such as ZAR-1 and NPM2, in porcine embryos through its nuclear receptor. But further, detailed functional studies are needed to fully clarify the role of EGF in the regulation of the expression of these genes.
The role of IL-1 in the reproductive tract is considered to be fulfilled primarily through inflammatory-linked mechanisms. Some obscure data are available concerning the participation of IL-1 in the regulation of developmentally important gene expression in oocytes and early porcine embryos (before the ovoid to tubular transition). To our knowledge, this study is the first report of the effects of IL-1β on MEG mRNA levels in pigs. We observed decreased mRNA levels of ZAR-1 and NPM2 in porcine 2-cell embryos treated with IL-1β. It is possible that the influence of IL-1β on ZAR-1 and NPM2 mRNA level in porcine embryos that was observed in our study can be exerted through the initiation of the nuclear factor kappa B (NF-κB) pathway. This mechanism of IL-1β action was recently proposed by Passos et al. (Reference Passos, Costa, da Cunha, Silva, Ribeiro, de Souz, Barroso, Dau, Saraiva, Gonçalves, van den Hurk and Silva2015) in bovine oocytes, and the NF-κB pathway was suggested to regulate processes related to MEG functioning, such as maternal transcriptional arrest (required for MII maturation) and embryonic genome activation in the bovine system (Paciolla et al., Reference Paciolla, Boni, Fusco, Pescatore, Poeta, Ursini, Lioi and Miano2011). However, further detailed studies are required to fully elucidate this possible mechanism of IL-1β action on MEGsin porcine embryos. These studies will improve our understanding of IL-1β involvement in early embryogenesis and female fertility.
We revealed that EGF and IL-1β addition to the culture media affect mRNA level of the investigated MEG but not beyond the 4-cell stage, i.e. before embryonic genome activation. In truth, in the present study we did not distinguish de novo embryonic transcription from the maternal contribution, however, this observation may suggest that EGF and IL-1β can act preferably on maternally derived transcripts rather than on the same transcripts which could be synthesized as embryonic products.
To summarize, our results suggest that porcine IVP medium supplementation with EGF or IL-1β may affect MEG (ZAR-1, NPM2 and DPPA3) mRNA level during oocyte maturation and two first embryo cleavages, before the embryonic genome is activated. Although these observations were not reflected in oocyte maturation and embryo developmental rate, the aberrant use or maintenance of some maternal transcripts during oocyte maturation or after fertilization may affect oocyte quality and compromise the developmental competence of the in vitro-produced embryos. Additionally, we suggest that LIF is a stimulator of oocyte maturation and by increasing DPPA3 mRNA level may potentially regulate pluripotency in porcine blastocysts in vitro, however the exact mechanism should be further elucidated.
Acknowledgements
We would like to thank to Mr Michal Blitek for his help in obtaining slaughterhouse ovaries. This work was supported by the National Science Centre, grant no. 2011/01/D/NZ4/03546.
Conflict of interests
The authors declare no conflict of interests.