

Introduction
Between 1979 and 1997, child poverty in the UK tripled to leave one in three children growing up in poverty; the highest child poverty rate in Europe (Piachaud and Sutherland, Reference Piachaud and Sutherland2001: 95). The Labour Government set itself interim targets of cutting child poverty by one-quarter by 2004–05 and halving it by 2010–11, with the eventual aim of ending it by 2020. Despite the downward trend in child poverty over the past ten years, New Labour has already missed its first interim target and faces a difficult task in meeting its second target. Consequently, this makes the overall aim of ending child poverty by 2020 difficult to achieve as well. While child poverty remains high generally, particular disadvantaged groups, such as ethnic minorities, have a disproportionate higher risk of being in poverty. Therefore, Government policy should pay more specific attention to the needs of these disadvantaged groups.
New Labour's policy approach has been to cut social exclusion and is underpinned by the belief that ‘work strengthens personal independence, fosters greater social inclusion and is the best route out of poverty’ (DWP, 2006: 5). This approach is seen as equally applicable to reducing child poverty. The financial and material circumstances that children grow up in are influenced by that of their parents. Furthermore, children growing up in poverty are likely to have limited life chances in adulthood, and this disadvantage is likely to transmit itself to their children. To break this generational cycle of disadvantage, the Government set up, in 2007, a cross-departmental Child Poverty Unit, comprising the Department for Children, Schools and Families (DCSF) and the Department for Work and Pensions (DWP). The Unit aims to break the links between poor housing, education and child poverty (DCSF, 2007).
New Labour has adopted a twin track approach to cutting child poverty. Firstly, it has introduced policies to improve the financial and material circumstances of parents. The Government has seen child poverty within a complex web of disadvantage, which includes unemployment, ill-health, crime, poor housing, and educational disadvantage (SEU, 2005). They have implemented direct measures, focusing on reducing barriers to work and making work pay (Finn, Reference Finn2003; Brewer and Shephard, Reference Brewer and Shephard2004; DWP, 2006). Secondly, New Labour has taken indirect measures to improve quality of life in disadvantaged areas, through programmes such as New Deal for Communities (NDC) (CRESR, 2005) and Sure Start. Much has been written about the Labour Government's child poverty record (Harker, Reference Harker2006; Hirsch, Reference Hirsch2006) but little is known about its effect on ethnic minorities.
This article has four broad aims. Firstly, it sets out the nature and extent of child poverty among ethnic minorities in the UK. Secondly, it examines the differential child poverty rates between the white and ethnic minority population. Thirdly, it examines and critiques government policies to cut child poverty. Finally, it concludes by outlining possible future policy options. In the discussion that follows the analysis compares white people with Black Caribbeans, Pakistanis and Bangladeshis to provide an effective contrast between the majority group and three of the most disadvantaged ethnic minority groups in the UK. For the purpose of the paper, children are defined as anyone under 16 or aged 16–18 and in full-time education (Bradshaw, Reference Bradshaw2006).
Child poverty amongst ethnic minority groups
The two main measures of poverty are the Households Below Average Incomes (HBAI) and the Poverty and Social Exclusion Survey (PSE). The HBAI defines poor households as those whose incomes are below 60 per cent of the equivalised household median in Great Britain (DWP, 2008). Equivalisation accounts for household size and type. The debate is whether to use the pre or post-housing costs measure. Pre-housing costs measures may overstate living standards since cost may be disproportionately high compared to the quality of accommodation. Post-housing costs and taxes better reflect disposable household incomes. However, higher housing costs may reflect better quality accommodation and higher living standards. HBAI ignores quality of life issues such as access to goods, services and social networks. The Government normally uses pre-housing costs to measure relative poverty (DWP, 2008).
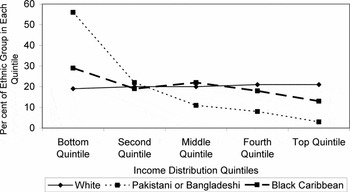
The PSE survey defines poverty and social exclusion in terms of the items, services or social networks that individuals lack (Gordon et al., Reference Gordon, Adelman, Ashworth, Bradshaw, Levitas, Middleton, Pantazis, Patsios, Payne, Townsend and Williams2000). As a high proportion of Black Caribbean, Pakistani and Bangladeshi households are concentrated in the bottom quintile of the income distribution (Figure 1), these groups are more likely to fit this description than white people. Conversely, the super-rich may often exclude themselves from mainstream services (Leggett, Reference Leggett2005).
Income distribution by ethnic group in the UK 2006/07 (before housing costs)
Source: Family Resources Survey (FRS) in DWP (2008), Households Below Average Income: An Analysis of the Income Distribution 1994/95–2006/07, 2006/07.

Figure 1 reinforces the picture of ethnic poverty and disadvantage. Black Caribbeans (27 per cent), and Pakistanis or Bangladeshis (54 per cent) are far more likely to be concentrated in the lowest income quintile than white people. As such, they are also likely to lack the items, access to services and social networks that facilitate social participation.
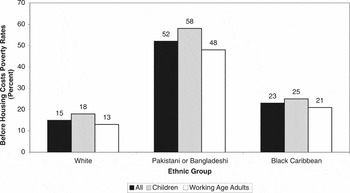
Figure 2 shows that 15 per cent of white households fell below the poverty line. This rose to 23 per cent for Black Caribbean households. By comparison, over half (52 per cent) of Pakistani or Bangladeshi households are considered poorFootnote 1. Poverty rates are higher for households with children in every ethnic group. Just under one-fifth of white children (18 per cent) are living in poverty. Pakistani or Bangladeshi households with children (58 per cent) are over three times as likely as their white counterparts to be in poverty (Platt, Reference Platt2007: 38).
The percentage of households in poverty by ethnic group and type of household in Britain 2002/03 to 2004/05 (before housing costs). These figures have been calculated from three year rolling averages for the financial years 2002/03, 2003/04 and 2004/05.
Source: HBAI data, DWP, in Platt (Reference Platt2007).

Figures 1 and 2 show that ethnic minorities have a much greater risk of low incomes and poverty than white people. Black Caribbeans have higher poverty rates than white people, while Pakistanis and Bangladeshis are much more likely to be in poverty. Consequently, each of these groups and could benefit from a concerted strategy to cut child poverty among ethnic minorities.
Why are child poverty rates higher among ethnic minorities than among white people?
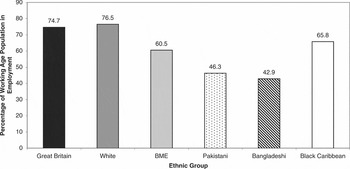
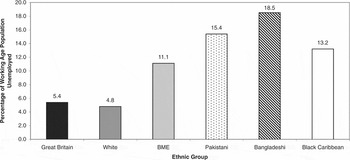
Evidence suggests a strong link between the financial and material circumstances of parents and their children. The differential employment, unemployment and pay rates (Figures 3, 4 and 5) between the white and ethnic minority populations, as well as ethnic penalties (Heath and Cheung, Reference Heath and Cheung2006), underpin much of the ethnic difference in child poverty rates. Ethnic penalties refer to the sources of disadvantage that may explain why an ethnic group achieves inferior labour market outcomes compared to similarly qualified white people (Heath and Cheung, Reference Heath and Cheung2006). Factors behind this are discussed in more detail below and include family size, ill-health, different types of jobs, low take-up of benefits and tax credits, low female employment and deindustrialisation.
The percentage of the working-age population in employment by ethnicity in Great Britain in 2008
Source: Labour Force Survey (LFS). The percentages are for the first quarter of 2008. The employment rate is calculated thus: no. of employed/working-age population.

The percentage of the working-age population who were unemployed by ethnicity in Great Britain in 2008.
Source: Labour Force Survey (LFS). The percentages are for the first quarter of 2008. The unemployment rate is calculated thus: no. of unemployed/[no. of unemployed + no. of employed].

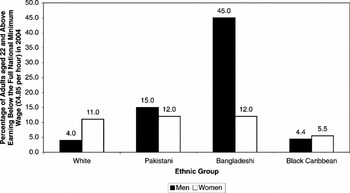
The percentage of the working-age population aged 22 and above earning below the full adult NMW (£4.85 per hour in 2004) by ethnicity and gender in 2004 in Great Britain.
Source: Heath and Cheung (Reference Heath and Cheung2006) Ethnic Penalties in the Labour Market: Employers and Discrimination.

Figure 3 shows that working-age white people are much more likely to be in work than their ethnic minority counterparts. There is wide variation among different ethnic minority groups. Around two-thirds of working-age Black Caribbeans are in work compared to less than half of their Pakistani and Bangladeshi counterparts.
Figure 4 shows that working-age ethnic minorities overall are around two and a half times as likely to be unemployed as their white counterparts. Black Caribbeans, Pakistanis and Bangladeshis fare much worse, with Bangladeshis being around four times as likely to be unemployed as white people.
Figure 5 shows that ethnic minorities are generally more likely to be in low paid work. Among men, white people are the least likely to be working in jobs paying below the National Minimum Wage (NMW). By contrast, almost half of Bangladeshi men are earning less than the NMW. Black Caribbean women are least likely to be in low paid work, which could be linked to a high maternal full-time employment rate (Bell et al., Reference Bell, Bryson, Barnes and O'Shea2005; Stanley et al., Reference Stanley, Bellamy and Cooke2006). The high incidence of lone parenthood among Black Caribbeans might explain a greater need to work full-time. Indian and white women are almost equally likely to be earning below the NMW. Pakistanis and Bangladeshi women were most likely to be earning less than the NMW. There are also significant gender differences in labour market outcomes within ethnic groups, which will be explored later.
Increasing employment and reducing unemployment among working-age Pakistanis and Bangladeshis will only be effective in lifting their children out of poverty if the work is sufficiently well paid. This problem is more acute for ethnic minorities, since they are twice as likely to be among the working poor. The interaction of work with the tax system has to ensure that people are sufficiently better off in work than on benefits (Cooke and Lawton, Reference Cooke and Lawton2008).
Pakistani and Bangladeshi families are often larger compared to their white counterparts. This may well be linked to their generally younger profile, particularly for South Asians, which makes it more likely that they have more dependent children (Tackey et al., Reference Tackey, Casebourne, Aston, Ritchie, Sinclair, Tyers, Hurstfield, Willison and Page2006: 19; Platt, Reference Platt2007: 86–87). Pakistani and Bangladeshi children in large families are more likely to have unemployed or disabled parents (Platt, Reference Platt2006: 3).
Ill-health is more common among ethnic minorities, especially South Asians (Strategy Unit, 2003). For South Asians, particularly older men, health conditions may arise from working in declining industries (for example, heavy manual labour, long shifts, etc.). They are also more likely to live in large families and in poor quality, overcrowded housing, which could aggravate existing health conditions (Strategy Unit, 2003; Tackey et al., Reference Tackey, Casebourne, Aston, Ritchie, Sinclair, Tyers, Hurstfield, Willison and Page2006). Ill-health can limit the ability to work, with obvious consequences for household incomes, especially in larger families. Not only do Pakistani and Bangladeshi children have a higher likelihood of living with a disabled working-age adult; such households also have a much higher risk of child poverty than their white counterparts (Platt, Reference Platt2006). Part of the reason could be their greater tendency to deal with ill-health in-house for cultural or religious reasons or simply lack of awareness of external support (Tackey et al., Reference Tackey, Casebourne, Aston, Ritchie, Sinclair, Tyers, Hurstfield, Willison and Page2006).
A major reason for the low pay (Figure 5) is ethnic occupational segregation. For instance, a high proportion of Bangladeshi men are employed in the hotel, catering and restaurant industry, which has traditionally been low paid (Blackwell and Guinea-Martin, Reference Blackwell and Guinea-Martin2005). Ethnic minorities are also more likely than the white population to be in routine rather than professional or managerial work. This may relate to factors such as human capital, language fluency and career gaps. This disparity could also be heightened by ethnic penalties, such as discrimination (Heath and Cheung, Reference Heath and Cheung2006). Low paid work, and its interaction with benefits and tax credits, may have limited effectiveness in lifting children out of poverty.
Their high concentration among the lowest income quintile (Figure 1) and low paid work (Figure 6) means that many ethnic minorities are eligible to claim benefits and tax credits. However, take-up may be lower among some ethnic groups, particularly Pakistanis and Bangladeshis. The complicated applications process may be a deterrent, particularly for those with limited English and literacy levels (Platt, Reference Platt2007). It can also be difficult for individuals to ascertain the extent to which they will be better off in work, although the Government has introduced ‘better off in work’ calculations in work focused interviews (Brewer and Shephard, Reference Brewer and Shephard2004; Freud, Reference Freud2007). Low take-up means that some ethnic groups who should benefit are not doing so as much as they should or at all.
The Labour Force Survey showed that only around one-quarter of Pakistani and Bangladeshi women are in work in 2006.Footnote 2 This means that many ethnic minority families have only one earner. This can heighten the risk of child poverty, since Pakistanis and Bangladeshis are more likely to have larger families (Tackey et al., Reference Tackey, Casebourne, Aston, Ritchie, Sinclair, Tyers, Hurstfield, Willison and Page2006; Platt, Reference Platt2007). Low female employment rates may be related to recency of arrival and qualifications. Pakistani and Bangladeshi women from poor, rural areas often arrive in the UK with little formal education. Thus, they are likely to lack both the bonding and bridging social capital that could improve their employment prospects (Strategy Unit, 2003). Bonding social capital refers to the relationships that individuals establish with others from similar backgrounds. Bridging social capital relates to their relationship with the wider community (Strategy Unit, 2003). Resistant cultural and religious values could also limit their ability to become better educated and work (Barnes et al., Reference Barnes, Hudson, Parry, Sahin-Dikmen, Taylor and Wilkinson2005; Tackey et al., Reference Tackey, Casebourne, Aston, Ritchie, Sinclair, Tyers, Hurstfield, Willison and Page2006). However, there is evidence that Pakistani and Bangladeshi women, especially younger ones, are increasingly combining career aspirations with traditional family roles (EOC, 2007).
Around 70 per cent of ethnic minorities live in the 88 most deprived local authorities in the country (Home Office, 2006: 48). This increases their risk of experiencing some of the social problems that limit life chances such as unemployment, ill-health, crime, poor housing and educational disadvantage (SEU, 2005). Children growing up in such an environment are likely to experience poverty from an early age, from which it can be difficult to escape. Consequently, disadvantage can be transmitted between generations. Ethnic minorities may also suffer from additional problems, such as, unresponsive services and language barriers.
Early post-war immigrants filled labour shortages in the manufacturing and textiles industries, often in deprived urban areas, of the North and Midlands. Logically, these areas are where the initial post-war influx of immigrants settled (Barnes et al., Reference Barnes, Hudson, Parry, Sahin-Dikmen, Taylor and Wilkinson2005; Tackey et al., Reference Tackey, Casebourne, Aston, Ritchie, Sinclair, Tyers, Hurstfield, Willison and Page2006). Ethnic minority employees in such industries may have conversed with each other in their native language rather than learning English. Poor English restricts job opportunities and consequently limits the ability of work to lift ethnic minority children out of poverty (Barnes et al., Reference Barnes, Hudson, Parry, Sahin-Dikmen, Taylor and Wilkinson2005; Tackey et al., Reference Tackey, Casebourne, Aston, Ritchie, Sinclair, Tyers, Hurstfield, Willison and Page2006). Industrial decline created a spatial mismatch between these increasingly obsolete skills and many new job opportunities in the modern and mainly service-based economy (Leitch, Reference Leitch2006; Tackey et al., Reference Tackey, Casebourne, Aston, Ritchie, Sinclair, Tyers, Hurstfield, Willison and Page2006). The concentration of low skilled labour in deprived areas may deter potential employers, which further reinforces industrial decline (Strategy Unit, 2003).
Nationally, deindustrialisation has generally seen a shift in job opportunities from declining heavy industries in the North and Midlands to more service-based jobs in London and the South East. Locally, there has been a transfer of mainly manufacturing jobs from the inner cities to more service-based jobs in suburban areas, such as retail or business parks (Strategy Unit, 2003; Tackey et al., Reference Tackey, Casebourne, Aston, Ritchie, Sinclair, Tyers, Hurstfield, Willison and Page2006). These locations are less easily accessible. This particularly disadvantages ethnic minorities, who are less likely to own a car, and are more reliant on public transport and more reluctant to commute longer distances than white people (Strategy Unit, 2003; Daycare Trust, 2007).
New Labour and tackling child poverty
While the Government has lifted 700,000 children out of poverty, it risks missing its interim target of halving child poverty by 2010 (Harker, Reference Harker2006: 11). New Labour's approach to cutting child poverty has focused on reducing barriers to work for the unemployed and making work pay for those in work (Finn, Reference Finn2003).
As mentioned above, New Labour has adopted a twin track approach to tackling child poverty: getting people into work and making work pay. It believes that work is the best route out of poverty and has consequently sought to improve employment rates among particular groups. This strategy has had some notable successes. The lone parent employment rate rose by 11 percentage points between 1997 and 2006 (Freud, Reference Freud2007: 30). The New Deal for Young People (NDYP) has got over 700,000 more young people into work (Freud, Reference Freud2007: 23). As well as improving employment rates, the New Deal programmes were introduced to improve employability. Participants receive benefits and help with finding work from New Deal Personal Advisers (NDPAs) in return for actively seeking work. Those deemed not to be actively seeking work face benefit cuts (Ogbonna and Noon, Reference Ogbonna and Noon1999; Finn, Reference Finn2003). NDPAs receive outcome-related payments for moving participants into work. However, these payments have sometimes pushed participants into unsustainable, low paid, jobs (Merriman-Johnson, Reference Merriman-Johnson2005). The payments have also shifted NDPA support towards those closest to the labour market (Ogbonna and Noon, Reference Ogbonna and Noon1999). Ethnic minorities often have more complex needs, which are sometimes overlooked by NDPAs.
Ethnic minorities have sometimes been reluctant to participate in New Deal. This may be due to a lack of ownership, since organisations representing their interests do not have much influence (Ogbonna and Noon, Reference Ogbonna and Noon1999). Ethnic minority participants also tend to achieve inferior outcomes when compared with their white counterparts, often due to inappropriate support (Ogbonna and Noon, Reference Ogbonna and Noon1999; Moody, Reference Moody2000). They are more likely to enter the full-time training and education option than their white counterparts and are also less likely to take up the employment option. This is despite the education option targeting those without basic qualifications, which a substantial proportion of ethnic minority participants already have (Moody, Reference Moody2000). Inappropriate support may leave participants ill-equipped to take up New Deal options, which has sometimes led to benefit cuts (Ogbonna and Noon, Reference Ogbonna and Noon1999).
Childcare is another strand of the Government's attempts to reduce barriers to work (see Lloyd in this volume). Since1997, around one-quarter of all children under eight have a registered childcare place (DCSF, 2007). Government has also increased the number of childcare places and introduced a childcare element to the Working Families Tax Credit (WFTC) to help working parents with childcare costs (Stanley et al., Reference Stanley, Bellamy and Cooke2006). Sure Start, based on the US Head Start programme set up in the 1960s, was unveiled in the NCS and initially delivered through local programmes (SSLPs). These were initiatives in deprived areas to improve outcomes for pre-school children and their families. From 1999 to 2003, 524 SSLPs had reached around 400,000 pre-school children. In 2003, the Green Paper Every Child Matters had an emphasis on increasing childcare and early years' education (Stanley et al., Reference Stanley, Bellamy and Cooke2006). A key step has been to ensure that all 3–4 year-olds will be entitled to 15 hours a week of free early years' education and childcare for 38 weeks a year. The Government has also increased the proportion of childcare costs covered by the childcare element of the new Working Tax Credit (WTC) from 2006 (HM Treasury, 2004). SSLPs are being replaced by Sure Start Children's Centre's, providing integrated early years' services. By April 2007, there were 1,250 Children's Centre's, reaching over one million pre-school children and their families. The Government's eventual aim is to create 3,500 Children's Centre's by 2010 (Hands et al., Reference Hands, Gordon, Choudhury, Toppin and Weingard2006; Stanley et al., Reference Stanley, Bellamy and Cooke2006).
Childcare usage among ethnic minorities varies. Formal childcare usage is much higher among Black Caribbean parents than it is among South Asian parents (Bell et al., Reference Bell, Bryson, Barnes and O'Shea2005). This may be linked to the high maternal employment rate among Black Caribbeans compared to their South Asian counterparts (Stanley et al., Reference Stanley, Bellamy and Cooke2006). Among South Asian women, resistant cultural and religious attitudes are also barriers to working and taking up formal childcare (Stanley et al., Reference Stanley, Bellamy and Cooke2006). The Children's Plan appears to recognise the difficulty of engaging with particular ethnic groups, by pledging to make Sure Start Children's Centres more accessible to all groups through improving outreach (DCSF, 2007).
The childcare experience of ethnic minorities also varies considerably. SSLPs using extensive targeting, home visiting, outreach, accessible locations, and translation services have engaged better with ethnic minority parents (Craig et al., Reference Craig, Adamson, Ali, Ali, Atkins, Dadze-Arthur, Elliott, McNamee and Murtuja2007; Daycare Trust, 2007). Creative advertising strategies, such as using community radio, have also had some success (Pascal and Bertram, Reference Pascal and Bertram2004). Signposting ethnic minorities to mainstream services has also proved effective (Rausch and Gillborn, Reference Rausch and Gillborn2003; Craig et al., Reference Craig, Adamson, Ali, Ali, Atkins, Dadze-Arthur, Elliott, McNamee and Murtuja2007). Sure Start Children's Centres now link closely with Jobcentre Plus to improve parental employability (Hands et al., Reference Hands, Gordon, Choudhury, Toppin and Weingard2006). Extended school hours may improve flexibility for children and takeparents.
However, there remain significant problems. SSLPs usually lacked board level BME representation, often due to inadequate support mechanisms. This may raise concerns about cultural and religious insensitivity (Pascal and Bertram, Reference Pascal and Bertram2004; Craig et al., Reference Craig, Adamson, Ali, Ali, Atkins, Dadze-Arthur, Elliott, McNamee and Murtuja2007). Such concerns are reinforced by inadequate diversity awareness, limited ethnic minority representation and limited fluency in community languages among childcare staff (Stanley et al., Reference Stanley, Bellamy and Cooke2006; Craig et al., Reference Craig, Adamson, Ali, Ali, Atkins, Dadze-Arthur, Elliott, McNamee and Murtuja2007; Daycare Trust, 2007). Extended school hours will not help the many ethnic minorities who still work atypical hours (Stanley et al., Reference Stanley, Bellamy and Cooke2006). While some SSLPs target their services effectively, others overlook additional barriers that ethnic minorities often face (Craig et al., Reference Craig, Adamson, Ali, Ali, Atkins, Dadze-Arthur, Elliott, McNamee and Murtuja2007). These inconsistencies have continued in Sure Start Children's Centres (Hands et al., Reference Hands, Gordon, Choudhury, Toppin and Weingard2006). There remain concerns about childcare quality and affordability. The low salaries and qualifications of childcare staff make it difficult to recruit high quality childcare staff (Unison, 2006). UK childcare costs have risen sharply to reduce the effect of the childcare element of the WTC for which they may be eligible. This disadvantages ethnic minorities further, given their concentration in the lowest income groups (Figure 3) (Stanley et al., Reference Stanley, Bellamy and Cooke2006).
As well as reducing barriers to work for the unemployed, the Government has also sought to make work pay, through tax credits and the National Minimum Wage (NMW). In 1999, the Government replaced Family Credit with the Working Families' Tax Credit (WFTC), which increased the incomes of the low paid and included a childcare element to cover a proportion of childcare costs. In 2003, the WFTC was replaced by the Working Tax Credit (WTC) and Child Tax Credit (CTC), which is paid to parents in or out of work. Unlike the WFTC, low paid childless adults are also eligible for the WTC. The WTC also has a childcare element, which now covers up to 80 per cent of childcare costs for up to two children. This discriminates against larger families, who are often more susceptible to poverty (Bradshaw, Reference Bradshaw2006). Eligibility for tax credits is based on household, not individual, income, which limits their ability to lift children out of poverty (Brewer and Shephard, Reference Brewer and Shephard2004). Take-up is usually lower among ethnic minorities, which may stem from particular barriers, such as unresponsive services and limited language skills. This is compounded by the absence of a concerted strategy to increase take-up (Platt, Reference Platt2007).
The NMW was introduced in 1999 at £3.60 per hour for workers aged 22 and over, with lower rates for younger workers. Unlike tax credits, individuals benefit from NMW increases (Brewer and Shephard, Reference Brewer and Shephard2004). The high concentration of ethnic minorities among the lowest paid means they are likely to benefit substantially (Cooke and Lawton, Reference Cooke and Lawton2008). However, the NMW does little to alleviate poverty among the poorest households, who are usually not working and include many from ethnic minority backgrounds (Coats, Reference Coats2007).
Future options for policy
To reduce child poverty among ethnic minorities, the Government's current strategy must run alongside specific interventions that address particular barriers that ethnic minorities are faced with. These include creating more sustainable work and increasing child care options, making services more responsive to the needs of ethnic minorities, and increasing their take-up of benefits and tax credits.
Children have a much higher risk of poverty in a workless than in a working household (Freud, Reference Freud2007). The high incidence of lone parenthood among Black Caribbeans means that they are likely to benefit greatly from strategies to increase lone parent employment. Any strategy to improve employment rates among couple households is likely to disproportionately benefit South Asian families because they often have larger families. In the case of lone parents, the Government has been more radical than Freud by reducing lone parent eligibility for Income Support from when their youngest child is 16 (at present) to 12 by 2008, 10 by 2009 and seven by 2010. Freud suggests that this is feasible since wraparound school hours should be in place by 2010 (Freud, Reference Freud2007). To make these reforms realisable, there needs to be a comprehensive childcare infrastructure in place to enable lone parents to go to work, as well as a widespread availability of flexible working (Stanley et al., Reference Stanley, Bellamy and Cooke2006; Freud, Reference Freud2007). Even if there was a comprehensive childcare infrastructure in place, such a strategy needs to address the said causes of under-utilisation by ethnic minority parents.
The success of such a strategy depends upon the extent to which the ‘employment-first’ welfare state recognises the two main causes of working-age economic inactivity: long-term illness and caring responsibilities (Freud, Reference Freud2007). For people who come under either or both categories, work, at least initially, is not a realistic option, which means they need security instead (Becker, Reference Becker2002). Economic inactivity is especially high among Pakistanis and Bangladeshis (Freud, Reference Freud2007). Pakistani and Bangladeshi men may be more likely to be inactive due to long-term illness, perhaps as a consequence of working in heavy manual labour in declining industries. Their female counterparts have a much higher inactivity rate, which is more likely to be down to resistant cultural and religious attitudes that often elevate family above work (Tackey et al., Reference Tackey, Casebourne, Aston, Ritchie, Sinclair, Tyers, Hurstfield, Willison and Page2006).
There needs to be greater emphasis on sustainable employment. The Freud Report is right to suggest a move towards outcome-related payments that reward sustained employment and Freud is also right to move away from the client-group approach, which often fails to recognise cross-cutting disadvantages (Freud, 2006; Stanley, Reference Stanley2007). This may help ethnic minorities, who often have complex needs, which are sometimes neglected by NDPAs seeking short-term outcomes. In-work support is needed once people are in work to improve their skills, perhaps as part of a New Deal for the Low Paid, which could form a springboard between unemployment and sustainable work (Howarth and Kenway, Reference Howarth and Kenway2004). This is consistent with the drive to improve the UK's skills base necessary to meet the ambitious targets set by the Leitch Review (Leitch, Reference Leitch2007). Basing eligibility for tax credits, as it is for the NMW, on individual rather than household incomes, may further alleviate in-work poverty, especially for ethnic minorities, who are often concentrated in low paid work. Linking the NMW to earnings growth is likely to benefit many ethnic groups, especially South Asians, given their high concentration in low paying sectors and jobs (Blackwell and Guinea-Martin, Reference Blackwell and Guinea-Martin2005: Heath and Cheung, Reference Heath and Cheung2006).
Access, affordability and quality are key childcare concerns that need to be addressed. Using community and mobile locations could increase access to childcare since ethnic minorities are generally more reliant on public transport. The threshold and proportion of childcare costs covered by the childcare element of the WTC should be increased. To end discrimination against larger families, which are more common among Pakistanis and Bangladeshis, the number of children covered by the childcare element of the WTC should also be increased. Improving quality requires a long-term strategy to raise the qualifications and salaries of childcare staff.
The proposal to extend free early years' education and childcare to two-year olds in deprived areas, could potentially benefit many ethnic minorities, who predominantly live in such areas (DCSF, 2007). However, this also appears inconsistent with increasing concerns about young children starting school too early (Harker, Reference Harker2007). The Children's Plan proposal for Sure Start Children's Centres to improve accessibility through outreach may help to engage ethnic minorities in these areas (DCSF, 2007). However, concerns about cultural sensitivity, affordability, and quality need to be addressed if ethnic minorities are to engage more with formal childcare providers (Bell et al., Reference Bell, Bryson, Barnes and O'Shea2005; Daycare Trust, 2007).
To cut child poverty among ethnic minorities, government must also address problems of low take up of tax credits and benefits and engagement with their services. To increase take-up of tax credits and benefits, there needs to be a greater dialogue between mainstream agencies, such as Jobcentre Plus, Citizens Advice Bureaux and, on behalf of ethnic minorities, Welfare Rights organisations and Outreach Workers (Daycare Trust, 2007: 3). This dialogue should raise awareness of the support and opportunities available to them. As such, organisations representing ethnic minorities should have more influence in programmes like New Deal and Sure Start (Ogbonna and Noon, Reference Ogbonna and Noon1999: 173; Merriman-Johnson, Reference Merriman-Johnson2005: 4).
To facilitate greater participation of ethnic minorities, materials should be published in common minority languages to improve accessibility (Platt, Reference Platt2007: 92). Greater participation also requires consistent diversity training among service providers and perhaps more ethnic minority staff, particularly in the decision-making process, to ensure that government is sensitive to the cultural and religious needs of ethnic minorities (Daycare Trust, 2007). Such training needs to recognise that, quite clearly, ethnic minorities are not a homogeneous group, given their varied experiences and backgrounds. However, some diversity initiatives, such as recruiting more male childcare staff, may be insensitive to particular groups, such as South Asian women, who may be more comfortable in single gender settings (Pascal and Bertram, Reference Pascal and Bertram2004: 11). But ultimately, the decision to participate or to access tax credits or benefits rests with the individual, perhaps with input from family and friends.
Acknowledgements
The author would like to thank Alan France and Line Nyhagen Predelli for their comments on previous drafts of the article.