INTRODUCTION
Although hydroids are abundant in tropical coral reefs, their ecological importance has generally been underestimated (Coma et al., Reference Coma, Ribes, Orejas and Gili1999) probably due to their cryptic habitus. While several taxonomic or faunistic papers are available concerning tropical hydroids (e.g. Leloup, Reference Lelup1937; Millard & Bouillon, Reference Millard and Bouillon1973; Vervoort, Reference Vervoort1993), very few data are present in the literature regarding their spatial and temporal distribution. Calder (Reference Calder, Williams, Cornelius, Hughes and Robson1991) studied the abundance and the distribution of hydroids in a Caribbean mangrove ecosystem, identifying water movement, substratum type, depth, light intensity, food availability and space competition as main influencing factors. A study conducted on the hydroid fauna of different habitats around Bermuda (Calder, Reference Calder1993) showed a significant difference between shallow and deep assemblages. Gravier-Bonnet (Reference Gravier-Bonnet1985) and Gravier-Bonnet & Bourmaud, (2006a, Reference Gravier-Bonnet and Bourmaudb) analysed the hydroid communities of different Islands of the south-west Indian Ocean. In Juan de Nova Island the authors highlighted four hydroid communities located in four reef zones: the exposed reef flat, the sheltered reef flat, the reef platform (<20 m depth) and the outer slope (30 m depth). In all the studied areas the number of species increased from the intertidal environments to the deeper zones. Moreover Gravier-Bonnet & Mioche (Reference Gravier-Bonnet, Mioche, Piraino, Boero, Bouillon, Cornelius and Gili1996) studied three hydroid species inhabiting shrimp-crevices of La Réunion and put in evidence the biotic and abiotic factors affecting their presence, reproduction and distribution.
Mergner (Reference Mergner and Taylor1977, 1987) suggested the use of hydroids as indicator species of environmental factors on Caribbean and Red Sea coral reefs. In fact, it was observed that several species show particular habitat preferences covering a wide spectrum of responses to different combinations of water movement and light intensity (Mergner, Reference Mergner, Bouillon, Boero, Cicognia and Cornelius1987). In some Jamaican coral cays the intensity of water exchange is considered the most relevant factor affecting the life of hydroid colonies (Mergner, Reference Mergner, Mukunan and Gopinadha1972). Water movement produces positive effects by supplying food and oxygen, but may also mechanically damage hydroids directly or increase sediment re-suspension. In optimal water movement conditions the hydroid abundance is influenced by the nature of the substratum, while the species pattern is regulated by the varying light intensities. Mergner (Reference Mergner, Mukunan and Gopinadha1972, Reference Mergner and Taylor1977) suggested that the best conditions for hydroid development in a tropical fringing reef are recorded in the lower ‘Palmata zone’, an area consisting of flattened corals and characterized by strong, but not destructive currents. This area also offers optimal light conditions and suitable substrata.
Despite the great number of hydroids concentrated in the lower ‘Palmata zone’, some species preferentially live in other habitats. The zooxanthellate Aglaophenia cupressina typically settles on the well-lighted edge of the reef, Eudendrium and Lytocarpus are common in areas with low illumination and weak current, while Gymnangium is often observed in shadowed places influenced by strong currents (Mergener, 1977; Mergner & Wedler, Reference Mergner and Wedler1977). The result of these preferences is that each reef zone is characterized by specific hydroid assemblages.
Several hydroids, especially in temperate waters, are not constantly present in the field and therefore the species composition of the hydrozoan community changes during the annual cycle (Boero & Fresi, Reference Boero and Fresi1986; Calder, Reference Calder1990; Genzano, Reference Genzano1994; Genzano et al., Reference Genzano, Zamponi, Excoffon and Acuã2002). Some species may completely disappear during certain periods of the year or even for a long time, forming resting stages. When the environmental conditions again become favourable, the hydroids give rise to new colonies.
Although there are species which are able to reproduce throughout the year, hydroids generally have a limited period of fertility (see Gili & Hughes, Reference Gili and Hughes1995 for a revision): there are species fertile in the warm season, species fertile between winter and summer and others fertile during the winter. Several authors indicate that, in temperate waters, environmental abiotic factors such as solar radiation (irradiance), temperature, salinity and sedimentation (Gili & Hughes, Reference Gili and Hughes1995) are the main causes of seasonality (Boero & Fresi, Reference Boero and Fresi1986; Arillo et al., Reference Arillo, Bavestrello and Boero1989; Bavestrello & Arillo, Reference Bavestrello and Arillo1992; Azzini et al., Reference Azzini, Cerrano, Puce and Bavestrello2003). In turn, these factors affect the cycle of phytoplankton which is the main biological trigger of seasonal variations. The differences in the seasonal cycles between benthic communities in cold and temperate waters derive from a shift in the phytoplankton cycle (Coma et al., Reference Coma, Ribes, Gili and Zabala2000).
Bavestrello et al. (Reference Bavestrello, Puce, Cerrano, Zocchi and Boero2006) observed that even in equatorial habitats, characterized by constant temperature conditions, benthic hydroids show seasonality in their annual life cycles and Boero (Reference Boero1994) suggested that, in these cases, seasonality is probably driven by the alternation of the dry and wet season, affecting nutrient availability and turbidity.
The aim of this work is to describe the spatial and temporal variations of a hydroid assemblage present along a coral reef in the Bunaken Marine Park (North Sulawesi, Indonesia), an area commonly considered to be a hotspot for marine biodiversity due to both its position at the intersection of the Indian and Pacific Oceans and its geological history (Sheppard & Wells, Reference Sheppard and Wells1988; Muller, Reference Muller1996; Tomascik et al., Reference Tomascik, Mah, Nontji and Moosa1997; Edinger et al., Reference Edinger, Jompa, Limmon, Widjatmoko and Risk1998).
MATERIALS AND METHODS
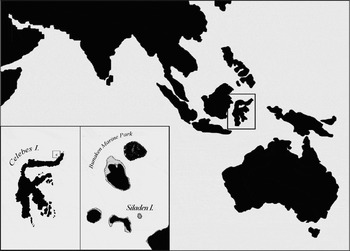
Sampling was conducted in Siladen, a small coralline island of the Bunaken Marine Park (Figure 1). The reef surrounding Siladen is a typical fringing reef. The reef flat is sandy and shallow, subjected to important tide variations and well-exposed to light. The edge of the reef is a well-lit habitat dominated by strong currents enhancing the growth of stony corals. The external reef is an almost vertical wall extending from 5–10 m to 50 m in depth; the continuity of this wall is broken by canyons, crevices and caves that offer very shady zones for sciaphilous organisms. The reef generally ends with a gentle slope at a depth of 50–60 m.
Siladen Island in the Bunaken Marine Park on the Northern tip of Celebes Island.

Hydroid sampling was carried out on the south side of Siladen along three vertical transects at a distance of about 50 m from each other. In each transect, samples were collected bimonthly by diving, from May 2004 to February 2005, at seven depth-ranges: lagoon, 2.5–5 m, 5–10 m, 10–20 m, 20–30 m, 30–40 m and 40–50 m. At each depth all the species found by two divers working together were collected and put in plastic bags. Hydroids were identified and an abundance value varying from 0 (absent) to 3 (very abundant) was assigned to each species.
Differences in the assemblage according to depth and over time were analysed performing a permutational multivariate analysis of similarities (ANOSIM), using the two factors crossed design and pairwise tests (9999 permutations). Bray–Curtis similarities were calculated on square root transformed abundance data and differences in the assemblages were analysed graphically using non-metric multidimensional scaling (MDS). Moreover similarity percentages analysis (SIMPER) was employed to evaluate species contributions to the variability at each factor group.
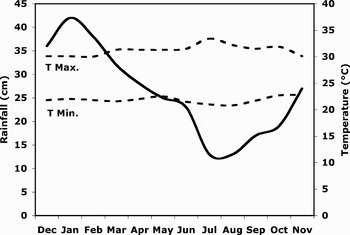
In accordance with Boero's suggestion (1994) the temporal trend of the assemblage was compared with the data for rainfall in the Manado area. North Sulawesi has a typical equatorial climate with two seasons, rainy and dry, separated by transition periods. The dry season, which runs from June to September, is influenced by the Australian continental air masses and is the time of the south-west Monsoon. The wet season, which runs from December to March, is influenced by Pacific Ocean and Asian air masses and is the time of the south-east Monsoon (Tomascik et al., Reference Tomascik, Mah, Nontji and Moosa1997). During the dry season the rainfall is on average 16 cm/month while during the wet season the average rainfall is 37 cm/month. Unlike the rainfall, the season-to-season temperature variations are small and the average minimum and maximum values are 21.8°C and 31.3°C respectively (Figure 2, data source: World Weather Information Service).
Average annual trend in rainfall (continuous line) and of air temperatures (dotted lines) in the area of the Bunaken Marine Park.

RESULTS
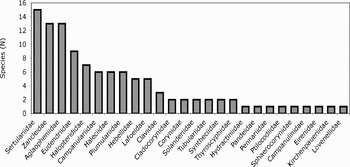
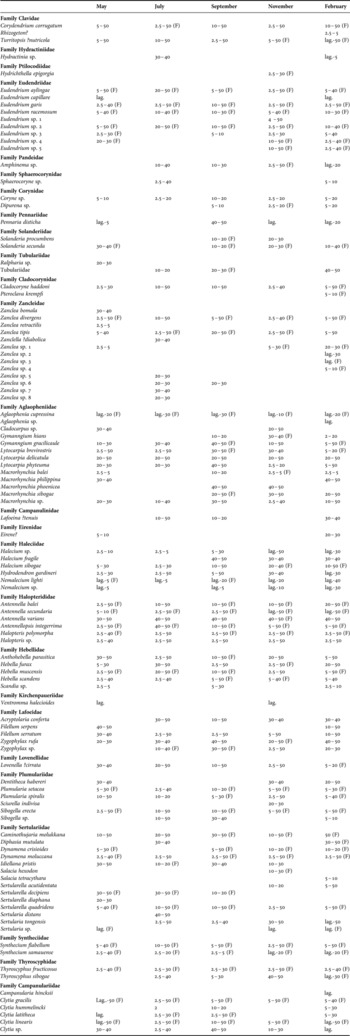
The hydroid assemblage of the Siladen coral reef is made up of 107 species belonging to 51 genera and 28 families (Table 1). Thecate species (65%) are prevalent in the assemblage. The most widely represented thecate families are Sertulariidae, Aglaopheniidae, Halopterididae and Plumulariidae, while the athecate ones are Zancleidae and Eudendriidae. These families account for more than 75% of the total species (Figure 3).
Number of species per family in the Siladen assemblage.

List of the species with their maximum range of depth and period of fertility (F).

lag., stay for lagoon.
Statistical analysis
The permutational analysis of similarities indicates significant differences between depths (ANOSIM: Global R = 0.528, P = 0.01%) and over time (ANOSIM: Global R = 0.287, P = 0.01%). In particular, differences were found in all depth groups (significance level ranging between R= 0.978, P = 0.01% and R = 0.318, P = 0.8%), with the exception of the depth of 10–20 m, which does not significantly differ from 20–30 m, 20–30 m that does not significantly differ from 30–40 m and 30–40 m that does not significantly differ from 40–50 m. Differences were also detected between temporal groups (significance level ranging between R = 0.413, P = 0.01% and R = 0.201, P = 2.1%), with the exception of July and September and November and February.
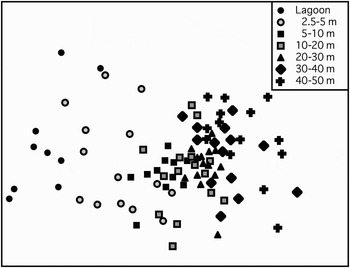
MDS Bray–Curtis similarities highlighted that the samples are arranged along a bathymetric gradient with the lagoon and the reef edge assemblages being well-separated while those of the vertical reef are more overlapped (Figure 4).
MDS Bray–Curtis similarities of depth data, three replicas per each of the five months.

Spatial distribution
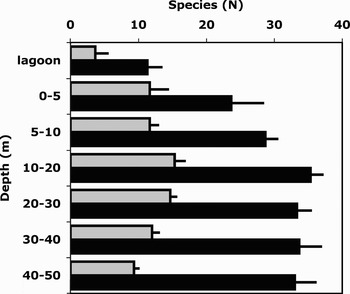
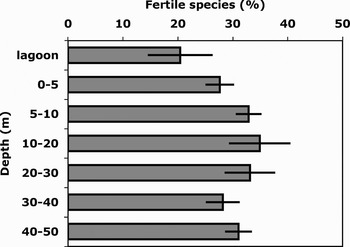
The number of thecate species is prevalent at all depths. From the lagoon to 30 m depth athecate and thecate hydroids share an increasing trend (up to 15 and 37 species respectively), but from 30 m depth to the cliff bottom the number of athecate species decreases while the number of thecates remains constant (Figure 5). The percentage of fertile species on the total number present at each depth also shows an increase from the lagoon reaching the maximum (about 35%) at a depth of 30 m and then tending to decrease slightly (Figure 6).
Bathymetric distribution of the species number (mean of three replicas ±SE) of thecate (black bars) and athecate hydroids (grey bars).

Bathymetric distribution of the percentage (mean of three replicas ±SE) of fertile species.

From a faunistic point of view three different zones can be described:
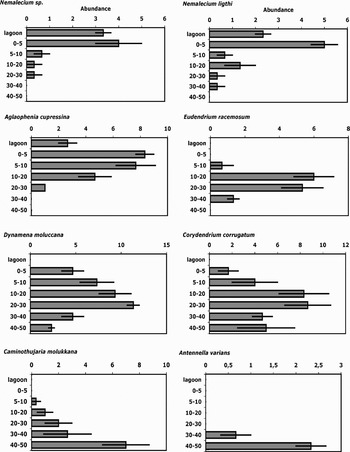
(1) The reef flat, mainly sandy and characterized by sparse corals (mainly Pocillopora and Porites), funnel-shaped sponges (Carteriospongia foliascens) and mats of different sea grasses. The lagoon is typified by Aglaophenia cupressina present in scattered tufts, Antennella secundaria living on algae, Nemalecium sp. living in the shady crevices of the corals, Plumularia setacea living on sea grasses, and Nemalecium ligthi, epibiontic on sponges (Figure 7). The analysis of SIMPER at the level of species evidenced that the contribution values of these hydroids are respectively 23.36%, 20.08%, 18.62%, 15.56% and 14.05%, with a cumulative contribution of 91.67% of the total similarity.
(2) The edge of the reef extensively colonized by stony corals. Hydroids grow mainly on the shady side of the corals (e.g. the large tabulate colonies of Acropora). The typical species for this zone are the stinging zooxanthellate Aglaophenia cupressina forming large tufts on the edge of the reef (Figure 7) and Synthecium samauense. The contribution values of the species are respectively of 16.21% and 13.30%.
(3) The vertical reef, generally ending at 50–60 m depth, where the stony corals are progressively substituted by sponges.
Examples of bathymetric distribution of species characteristic of the lagoon, the reef edge, the middle portion of the reef and the deep reef. Data are the means ±SE of the sums of the abundances recorded in all the considered months in each of the three transects.

In this habitat, hydroids are particularly abundant and the most representative species are the sertulariid Dynamena moluccana, the eudendriid Eudendrium racemosum and the clavid Corydendrium corrugatum (Figure 7). The colonies of Eudendrium generally are epibiotic of dead branches of sea fans and monopodial colonies of black corals (Cirrhipathes, Stichopathes). The plumulariids Plumularia spiralis, Sibogella erecta and Sibogella sp., the halopteridids Halopteris polymorpha, Antennella sp. and the thyroscyphid Thyroscyphus fruticosus are also common. In this zone the hydroid species symbiotic with other benthic organisms are widely diffused, particularly Zanclea spp. associated with different bryozoan species but also sponges and sea fans. The ptilocodiid Hydrichthella epigorgia epibiontic on large sponges and gorgonians is quite common. Locally the association between Dentitheca habereri and Parazoanthus spp. was observed (Di Camillo et al., in press).
The halopteridid Antennella varians and the sertulariid Caminothujaria molukkana (Figure 7) are the most frequent species at the base of the reef, at a depth of 40–50 m.
The analysis of SIMPER indicate that there are not typical species for each depth level, but the contribution to the Bray–Curtis similarity is roughly equally distributed and lower than 10% suggesting a faunistic homogeneity of the reef.
Temporal distribution
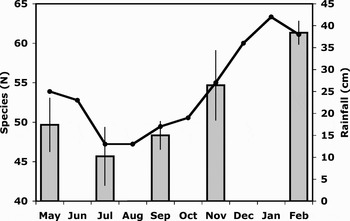
The analysis of species typifying time groups evidenced that, with the exception of the month of May when the major contribution (10.23%) is due to Aglaophenia cupressina, there are no species typical of a particular period of the year. Nevertheless the number of species present in the Siladen assemblages shows a seasonal trend characterized by a summer minimum (July–September) and a winter maximum (November–February). This seasonal variation overlaps the average annual trend of rainfall in the same area (r = 0.99, N = 5) (Figure 8).
Comparison between the average annual trend in rainfall in the area of the Bunaken Marine Park (continuous line) and the number (mean of three replicas ±SE) of hydroid species collected in the different months (bars).

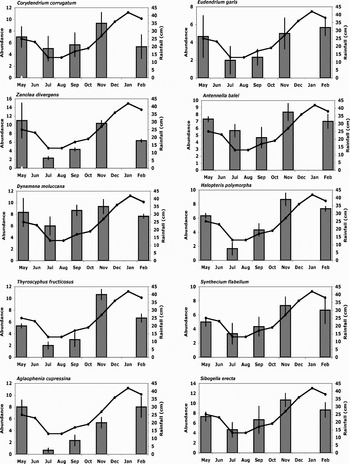
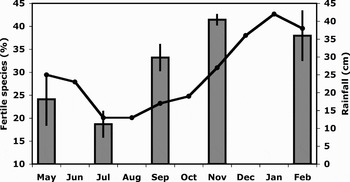
The comparison between the average annual rainfall and the abundance of the ten most common species of the assemblage shows a similar trend (Figure 9). Despite this similarity, some of these species, such as Eudendrium garis, Zanclea divergens, Halopteris polymorpha, Thyroscyphus fruticosus and Aglaophenia cupressina, are subject to a stronger decrease during the summer period (Figure 9). The percentage of fertile species also changes during the seasons (Figure 10), presenting a minimum in July (about 17%), gradually increasing in September–November up to about 40% and decreasing again in February–May (35% and 24% respectively). The maximum percentage of fertile species appears early with respect to the maximum rainfall.
Comparison between the average annual trend in rainfall in the area of the Bunaken Marine Park (continuous line) and the abundance (mean ±SE) of the ten most common species of the assemblage in the different months (bars). Data are the means of the sums of the abundances recorded at all the considered depths in each of the three transects.

Comparison between the average annual trend in rainfall in the area of the Bunaken Marine Park (continuous line) and the percentage of fertile species (mean of three replicas ±SE) of hydroids collected in the different months (bars).

DISCUSSION
Several studies on hydroid spatial distribution demonstrate the importance of substratum, light and water movement, the combined influence of which limits the hydroid growth to certain parts of the reefs (Mergner, Reference Mergner, Mukunan and Gopinadha1972, Reference Mergner and Taylor1977, Reference Mergner, Bouillon, Boero, Cicognia and Cornelius1987; Mergner & Wedler, Reference Mergner and Wedler1977). As observed in the Red Sea and Caribbean coral reefs (Mergner, Reference Mergner and Taylor1977, Reference Mergner, Bouillon, Boero, Cicognia and Cornelius1987), the hydroid assemblage of Siladen shows an evident zonation. The reef flat represents the zone hosting the lowest number of species, probably specialized to face the high sedimentation rate, the strong light intensity, the high water temperature and the effects of the tide. In this shallow zone during heavy rainfalls the salinity probably can drastically decrease but this phenomenon is quickly attenuated by the strong tidal currents mixing the water masses.
On the edge of the reef, where stony corals reach their maximum abundance, the only hydroid able to compete with them is Aglaophenia cupressina, that forms very large tufts. The high competitiveness of this species is tentatively attributed to its unusual symbiosis with zooxanthellae. The highest abundance of hydroid species is recorded on the reef slope at a depth between 10–30 m, where stony corals drastically decrease while for hydroids optimal conditions of light, current and substratum availability are probably present. Below this depth the low light and the weak water movement select sciaphilous species and limit hydroid development.
The Indonesian assemblage includes some of the indicator species identified by Mergener (1977, 1987) confirming their already described habitat preferences. Pennaria disticha (reported by Mergner as Halocordyle disticha) inhabits well-illuminated areas close to the surface, Macrorhynchia philippina (reported by Mergner as Lytocarpus philippinus) may be considered a moderately photophilous–rheophilous species and Solanderia spp. typically settle in shady cavities of the reef slopes in the presence of strong current.
As described by Calder (Reference Calder1993) for Bermuda and Gravier-Bonnet & Bourmaud (2006a) for the south-west Indian Ocean, the hydroid assemblage of Siladen is mainly made up of thecate species (about 65%). The predominance of the families Sertulariidae and Aglaopheniidae in number of species was already recorded in La Réunion, the Îles Glorieuse and Juan de Nova Island (Gravier-Bonnet, Reference Gravier-Bonnet1985; Gravier-Bonnet & Bourmaud, Reference Gravier-Bonnet and Bourmaud2006a, Reference Gravier-Bonnet and Bourmaudb).
As regards the reproductive strategy, only 30% of the recorded species produce free medusae or eumedusoids. This evidence could be interpreted as an adaptation to conditions of strong currents to avoid the spread of medusae in the open ocean. According to Calder (Reference Calder1993) the distribution of these hydroids could be more efficiently related to resting stages that can survive the limiting ecological conditions encountered during long-range transport.
In temperate seas the environmental abiotic factors such as solar radiation (irradiance), temperature, salinity and sedimentation (Gili & Hughes, Reference Gili and Hughes1995) are regarded as the main causes of the seasonality of hydroid assemblages (Boero & Fresi, Reference Boero and Fresi1986; Arillo et al., Reference Arillo, Bavestrello and Boero1989; Bavestrello & Arillo, Reference Bavestrello and Arillo1992; Azzini et al., Reference Azzini, Cerrano, Puce and Bavestrello2003). Although the equatorial area studied here is characterized by very small variations in temperature and irradiance conditions, the hydroid assemblage is subject to an evident temporal variation in terms of species diversity and abundance.
Unlike temperate seas, where winter and summer species are identifiable, in the Siladen assemblage pools of species living preferentially in limited periods of the year are not recordable. Nevertheless, the species diversity decreases in the July–September period, suggesting that a number of sensitive species disappears during the dry season. Moreover, together with this periodic decrease in the number of species, those which are active throughout the year show a drop in their abundance.
In accordance with Boero's suggestion (1994), the temporal patterns of hydroid diversity and abundance at Siladen Island are driven by the rainfall. In this area, in fact, the main source of nutrients is related to the land erosion produced by rain. In this way it is possible to hypothesize that the summer months are strongly non-productive, while the primary production increases owing to the winter rain.
The trend in the number of fertile species indicates that hydroids show their maximum reproductive effort when the rainfall, and consequently the food supply, starts to increase after the dry season minimum. In this way the newly settled colonies may grow in the period of maximum food abundance.
The strong correlation between species number, abundance, reproductive periods and rainfall suggests that food availability, strictly related to the seasonal amount of rain, represents the main abiotic factor triggering the trend in the hydroid species richness of the Siladen assemblage. Further studies about the annual cycle of organic matter and plankton concentration along the Siladen reef will be necessary to confirm this hypothesis.
Probably other factors work synergistically with the food supply in determining the seasonal variations of hydroid diversity and abundance. These variations do not have the same intensity at all the considered depths; they are particularly evident close to the surface while they are progressively attenuated at the deeper levels. Particularly in the lagoon this fact could be related to a strong increase of water temperature during the dry season due to the long periods of calm water and the constant high solar radiation. During the rainy season the more frequent rough sea and cloudy weather prevent this water warming. Some species living in this area, such as the widely diffused Pennaria disticha, show drastic variations along the annual cycle. Probably the thermal stress is the main cause of the summer bleaching of zooxanthellate Aglaophenia cupressina resulting in a reduction of this species on the edge of the reef.
The athecate hydroid Zanclea divergens is closely associated to the encrusting bryozoan Celleporaria sibogae (Boero et al., Reference Boero, Bouillon and Gravili2000; Puce et al., Reference Puce, Cerrano, Boyer, Ferretti and Bavestrello2002, Reference Puce, Bavestrello, Di Camillo and Boero2007) and it is widely distributed from the edge of the reef to deeper zones. The drastic decrease of this hydroid during the summer is related to a strong reduction of the encrusting patches formed by the bryozoan.
Obviously, at species level, a different sensitivity is able to produce different patterns of seasonal variations: for example the large pluriennal colonies of the sertulariids Dynamena moluccana and Sertularella diaphana or the different species of Solanderia show an almost constant trend throughout the year.