Introduction
Advances in medical research and technology have increased the lifespan of individuals born with CHD, creating a large population living with adult CHD. Reference Mandalenakis, Giang and Eriksson1–Reference van der Bom, Zomer, Zwinderman, Meijboom, Bouma and Mulder3 As comorbidities, the need for lifelong monitoring, and existing barriers to specialised services contribute to a unique set of physical, mental, and social challenges in this population, there has been a rising interest in capturing patient-reported outcomes in CHD. Reference Bouma and Mulder4,Reference Kahr, Radke, Orwat, Baumgartner and Diller5 However, limited research exists on change in patient-reported outcomes after transcatheter interventions, despite patients undergoing multiple diagnostic and procedural investigations in their lifetime. Over the past three decades, transcatheter interventions to palliate or correct CHDs have gained traction; procedures are less invasive than surgical methods, and studies across multiple CHD interventions have demonstrated similar clinical effectiveness and lower peri-operative risks. Reference Egbe, Miranda, Anderson, Crestanello, Warnes and Connolly6–Reference Villablanca, Briston and Rodés-Cabau8 Based on a 2015 environmental scan, 1,451 diagnostic and procedural adults with CHD interventions were performed across Canada, with the greatest number of procedures (50.9%) performed in Ontario. Reference Stout, Daniels and Aboulhosn9
Recent registry-based studies for common CHD procedures illustrated that regardless of excellent short- and long-term effectiveness outcomes, these patients experienced high emergency department and hospital readmission rates within 30 days of procedures. Reference Abrahamyan, Barker and Dharma10,Reference Abrahamyan, Dharma and Alnasser11 These challenges indicate the importance of evaluating the impact of procedures on patient’s perception of their health, particularly with the expectation that more surgical procedures in adults with CHD are expected to be replaced by transcatheter interventions. We aimed to examine change in patient-reported physical and mental health scores 30 days after receiving a transcatheter intervention for adults with CHD in a large academic centre in Canada.
Methods
Study design and population
Our study population included adult patients over the age of 18 prospectively enrolled in the Canadian Adults with CHD Intervention Registry (NCT04288596) who received adults with CHD interventions at the Toronto General Hospital between December 2021 and July 2024. Toronto General Hospital is the largest tertiary centre in Canada, providing care to adults with CHD patients. Patients undergoing diagnostic complex catheterisation, closure of atrial septal defect, closure of patent foramen ovale, stenting of coarctation of the aorta, or percutaneous pulmonary valve implantation, five of the most commonly conducted adults with CHD procedures in Canada, were consented to participate in the study by research personnel before their procedure. Diagnostic complex catheterisation includes patients with Tetralogy of Fallot, Fontan, transposition of the great vessels, single ventricle, and truncus arteriosus pathologies. For the current study, we only considered participants who completed both baseline (pre-procedural) and 30-day post-discharge follow-up surveys.
Study instruments
Patient-reported outcomes, experiences, and health services usage were captured using survey tools self-administered to patients at baseline and 30 days after an adult with CHD intervention. The baseline survey contained sections on demographics, comorbidities and symptoms, and the Patient Reported Outcomes Measurement and Information System Global Health V1.2 questionnaire, which evaluates self-reported quality of life. Reference Hays, Schalet, Spritzer and Cella12 Patient Reported Outcomes Measurement and Information System Global Health is a brief, 10-item questionnaire that captures patients’ perception of their health status, their mental and physical health, and their daily level of activity. Reference Hays, Schalet, Spritzer and Cella12 The follow-up survey also contained the Patient Reported Outcomes Measurement and Information System questionnaire to capture change in quality of life and questions on symptoms, unmet health care needs, gaps in care and a modified version of the Canadian Patient Experiences Survey on Inpatient Care to capture inpatient care experiences. Reference Hadibhai, Lacroix and Leeb13 Survey tools were reviewed by an expert physician and the Canadian Congenital Heart Alliance patient group, who provided comprehensive feedback on survey components and their relevance.
Survey procedures and consent
Clinical fellows on the adults with CHD team introduced patients to the registry and surveys, obtained the signed informed consents, and answered related questions prior to the procedure. Baseline surveys were completed using a paper form, and responses were entered in a REDCap database. Follow-up surveys were completed 30 days (+2 weeks) after participants received their interventional procedure administered either through telephone by research coordinators or self-administered through an online REDCap survey link sent through email, depending on the participants’ preferences. The REDCap survey tool was designed to automatically send periodic follow-up reminders; after the first email, three reminder emails were scheduled with two-day intervals. If patients had still not responded, they were contacted once through telephone.
Statistical analysis
All statistical analyses were conducted using the R statistical software version 4.0.3. 14 Self-reported demographic characteristics and comorbidities were summarised using counts and percentages for categorical data and means and standard deviations for normally distributed continuous data and median and interquartile range, otherwise. Differences in proportions of patients with different symptoms (e.g., chest pain and palpitations) between baseline and 30 days after the intervention were evaluated using the chi-squared test.
Using the Patient Reported Outcomes Measurement and Information System Global Health scoring and interpretation guide, global mental, and global physical health scores were derived and manually converted to standardised T-scores. Reference Rothrock, Amtmann and Cook15 A mean T-score of 50 (SD = 10) is the reference score for the general U.S population. Reference Bevans, Ross and Cella16 If responses to one or more questions were missing, the global mental health and global physical health scores for the individual participant were not derived.
Baseline and 30-day T-scores were calculated for each participant, and an average T-score was derived for the sample using mean and SDs or median and interquartile ranges, as appropriate. Shapiro–Wilk normality tests were used to check the distribution of T-scores. We used a paired t-test for normally distributed and a Wilcoxon signed-rank test for not normally distributed scores to understand if there was a statistically significant change in physical and mental health scores after the intervention. We also evaluated if the average change in score was meaningful to patients. The minimal important change is defined as the smallest within-person change in patient-reported outcomes that are meaningful to patients. The minimal important change was defined using a systematic review of 31 studies that were conducted in different disease populations. The systematic review determined the threshold of minimal important change to be a difference in T-score by two to six points. Reference Terwee, Peipert and Chapman17 Therefore, we defined a T-score change of 3 points as the minimal important change. Reference Terwee, Peipert and Chapman17 Patient Reported Outcomes Measurement and Information System T-score cut points were also used to convert T-scores to a categorical scale (“excellent,” “very good,” “good,” “fair,” and “poor”) for each patient for more intuitive interpretation. Reference Hays, Spritzer, Thompson and Cella18 In addition, we conducted a priori defined exploratory subgroup analysis for change in physical and mental scores to make comparisons by sex (male versus female), age groups (<60, ≥60 years old), and type of adults with CHD interventions. We considered a p value < 0.05 as statistically significant.
Ethics
The study protocol was approved by the research ethics boards of the University Health Network and the University of Toronto. All patients provided written consent.
Results
Baseline demographic, clinical, and procedural characteristics
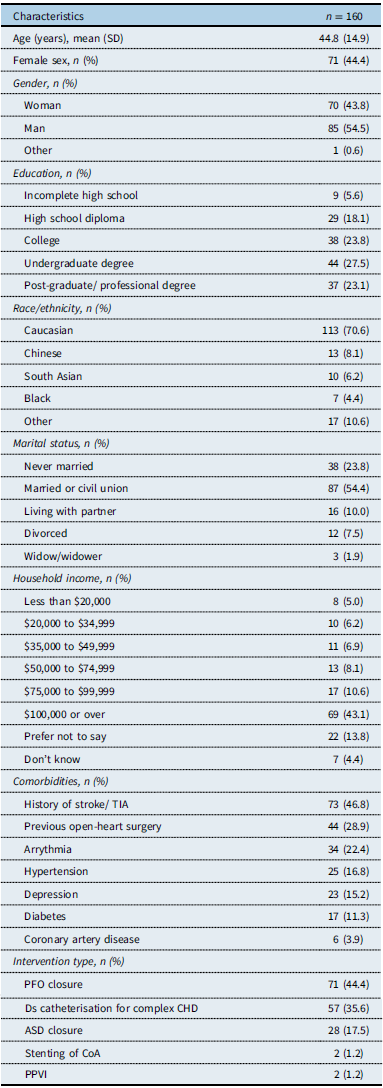
From December 17, 2021, to July 15, 2024, 254 patients completed the baseline survey; from these, 160 (63%) patients responded to both baseline and follow-up surveys and were included in the sample. The mean age of the sample population was 44.8 (SD = 14.9); 71 (44.4%) were females, and 113 (70.6%) identified as Caucasian. Approximately half of the study population had at least an undergraduate degree (n = 81, 50.6%) and a household income above $100,000 (n = 69, 43.1%). Patient-reported comorbidities included a history of stroke/transient ischaemic attack in 73 (46.8%) and arrythmia in 34 (22.4%) patients. Patent foramen ovale closure was the most commonly received intervention (n = 71, 44.4%), followed by diagnostic catheterisation for complex CHD (n = 57, 35.6%) and atrial septal defect closure (n = 28, 17.5%). See Table 1 for participant characteristics.
Demographic and health characteristics

Table 1. Long description
A table summarizing demographic and health characteristics of 160 patients. The table has 16 rows and 10 columns. Column headers are Characteristics, n = 160, Age (years), mean (SD), Female sex, n (%), Gender, n (%), Education, n (%), Post-graduate/professional degree, Race/ethnicity, n (%), Marital status, n (%), Household income, n (%), Comorbidities, n (%), and Intervention type, n (%). Row labels include Age, Female sex, Gender, Education, Post-graduate/professional degree, Race/ethnicity, Marital status, Household income, Comorbidities, and Intervention type. Each row provides specific data points for the respective characteristics. For example, the mean age is 44.8 (SD 14.9), 71 (44.4%) are female, and 113 (70.6%) identify as Caucasian. The table also includes data on education levels, marital status, household income, comorbidities, and types of interventions received by the patients.
ASD = atrial septal defect; CHD = congenital heart disease; CoA = coarctation of aorta; Ds = diagnostic; PFO = patent foramen ovale; PPVI = percutaneous pulmonary valve implantation; TIA = transient ischaemic attack.
*Sex data missing in 3 (1.8%), gender in 4 (2.5%), marital status in 3 (1.8%), employment in 9 (5.6%), and household income in 3 (1.8%) patients.
Change in symptoms from baseline to follow-up
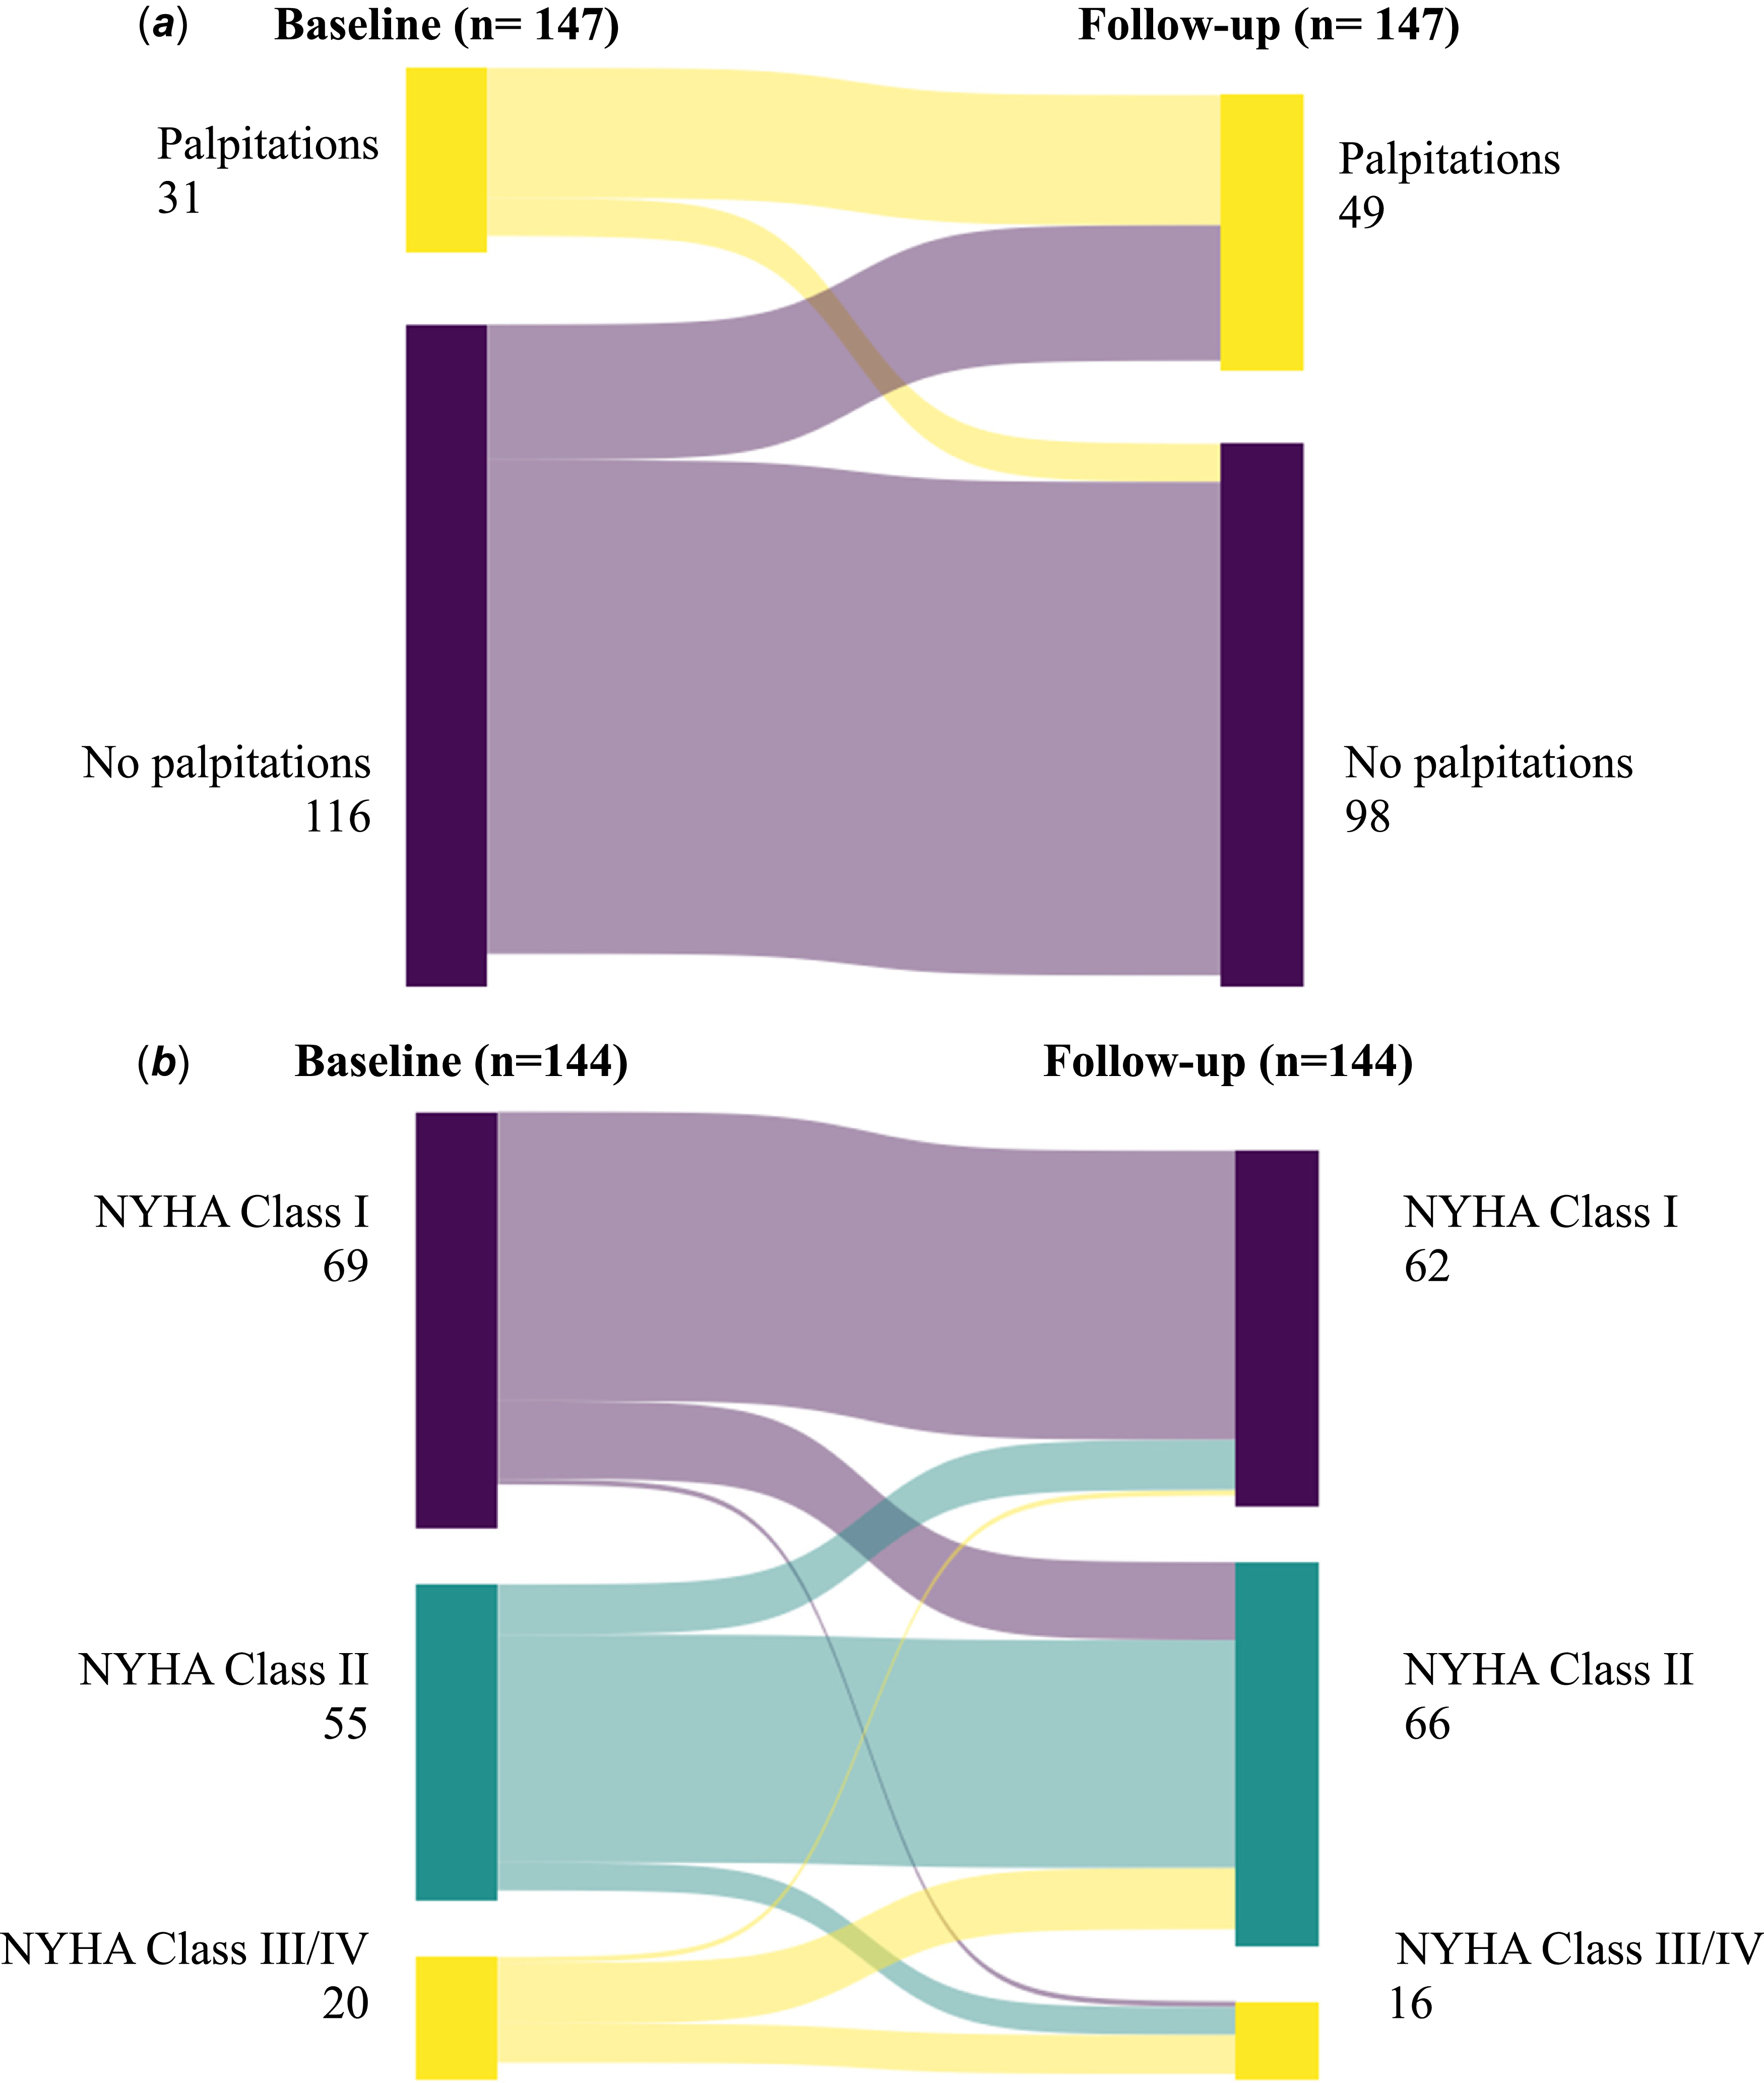
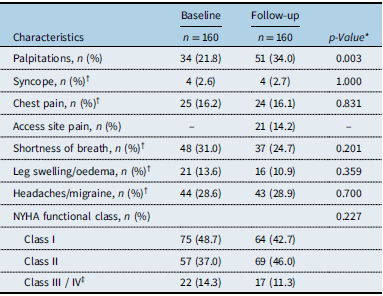
Before the procedure, shortness of breath (n = 48, 31.0%) and headaches/migraines (n = 44, 28.6%) were the most commonly experienced symptoms (Table 2, Figure 1 a ). At baseline, most patients were in Class I (n = 75, 48.7%), and at follow-up, in the Class II NYHA functional status (n = 69, 46.0%) (Figure 1 b ).
Change in patient-reported symptoms from baseline to follow-up. ( a ) Change in palpitation symptoms from baseline to follow-up.( b ) Change in NYHA class from baseline to follow-up.

Patient-reported symptoms at baseline and 30-day follow-up

Table 2. Long description
A table comparing patient-reported symptoms at baseline and follow-up. The table has 12 rows and 5 columns. The columns are labeled Baseline, Follow-up, and p-Value. The rows are labeled with different symptoms and characteristics. Row 1: Palpitations, n (percent), 34 (21.8), 51 (34.0), 0.003. Row 2: Syncope, n (percent), 4 (2.6), 4 (2.7), 1.000. Row 3: Chest pain, n (percent), 25 (16.2), 24 (16.1), 0.831. Row 4: Access site pain, n (percent), 21 (14.2). Row 5: Shortness of breath, n (percent), 48 (31.0), 37 (24.7), 0.201. Row 6: Leg swelling/oedema, n (percent), 21 (13.6), 16 (10.9), 0.359. Row 7: Headaches/migraine, n (percent), 44 (28.6), 43 (28.9), 0.700. Row 8: NYHA functional class, n (percent). Row 9: Class I, 75 (48.7), 64 (42.7). Row 10: Class II, 57 (37.0), 69 (46.0). Row 11: Class III / IV, 22 (14.3), 17 (11.3).
NA = not applicable; NYHA = New York Heart Association.
* P-values were derived from a chi-squared test.
† Data on syncope symptom was missing in 10 (6.3%), chest pain in 11 (6.9%), shortness of breath in 10 (6.3%), leg swelling/oedema in 13 (8.1%), migraine in 11 6.9%), and NYHA functional class in 10 (6.3%) patients.
‡ Only 2 patients reported Class IV NYHA functional status.
Change in Patient Reported Outcomes Measurement and Information System global mental health and global physical health scores for all samples
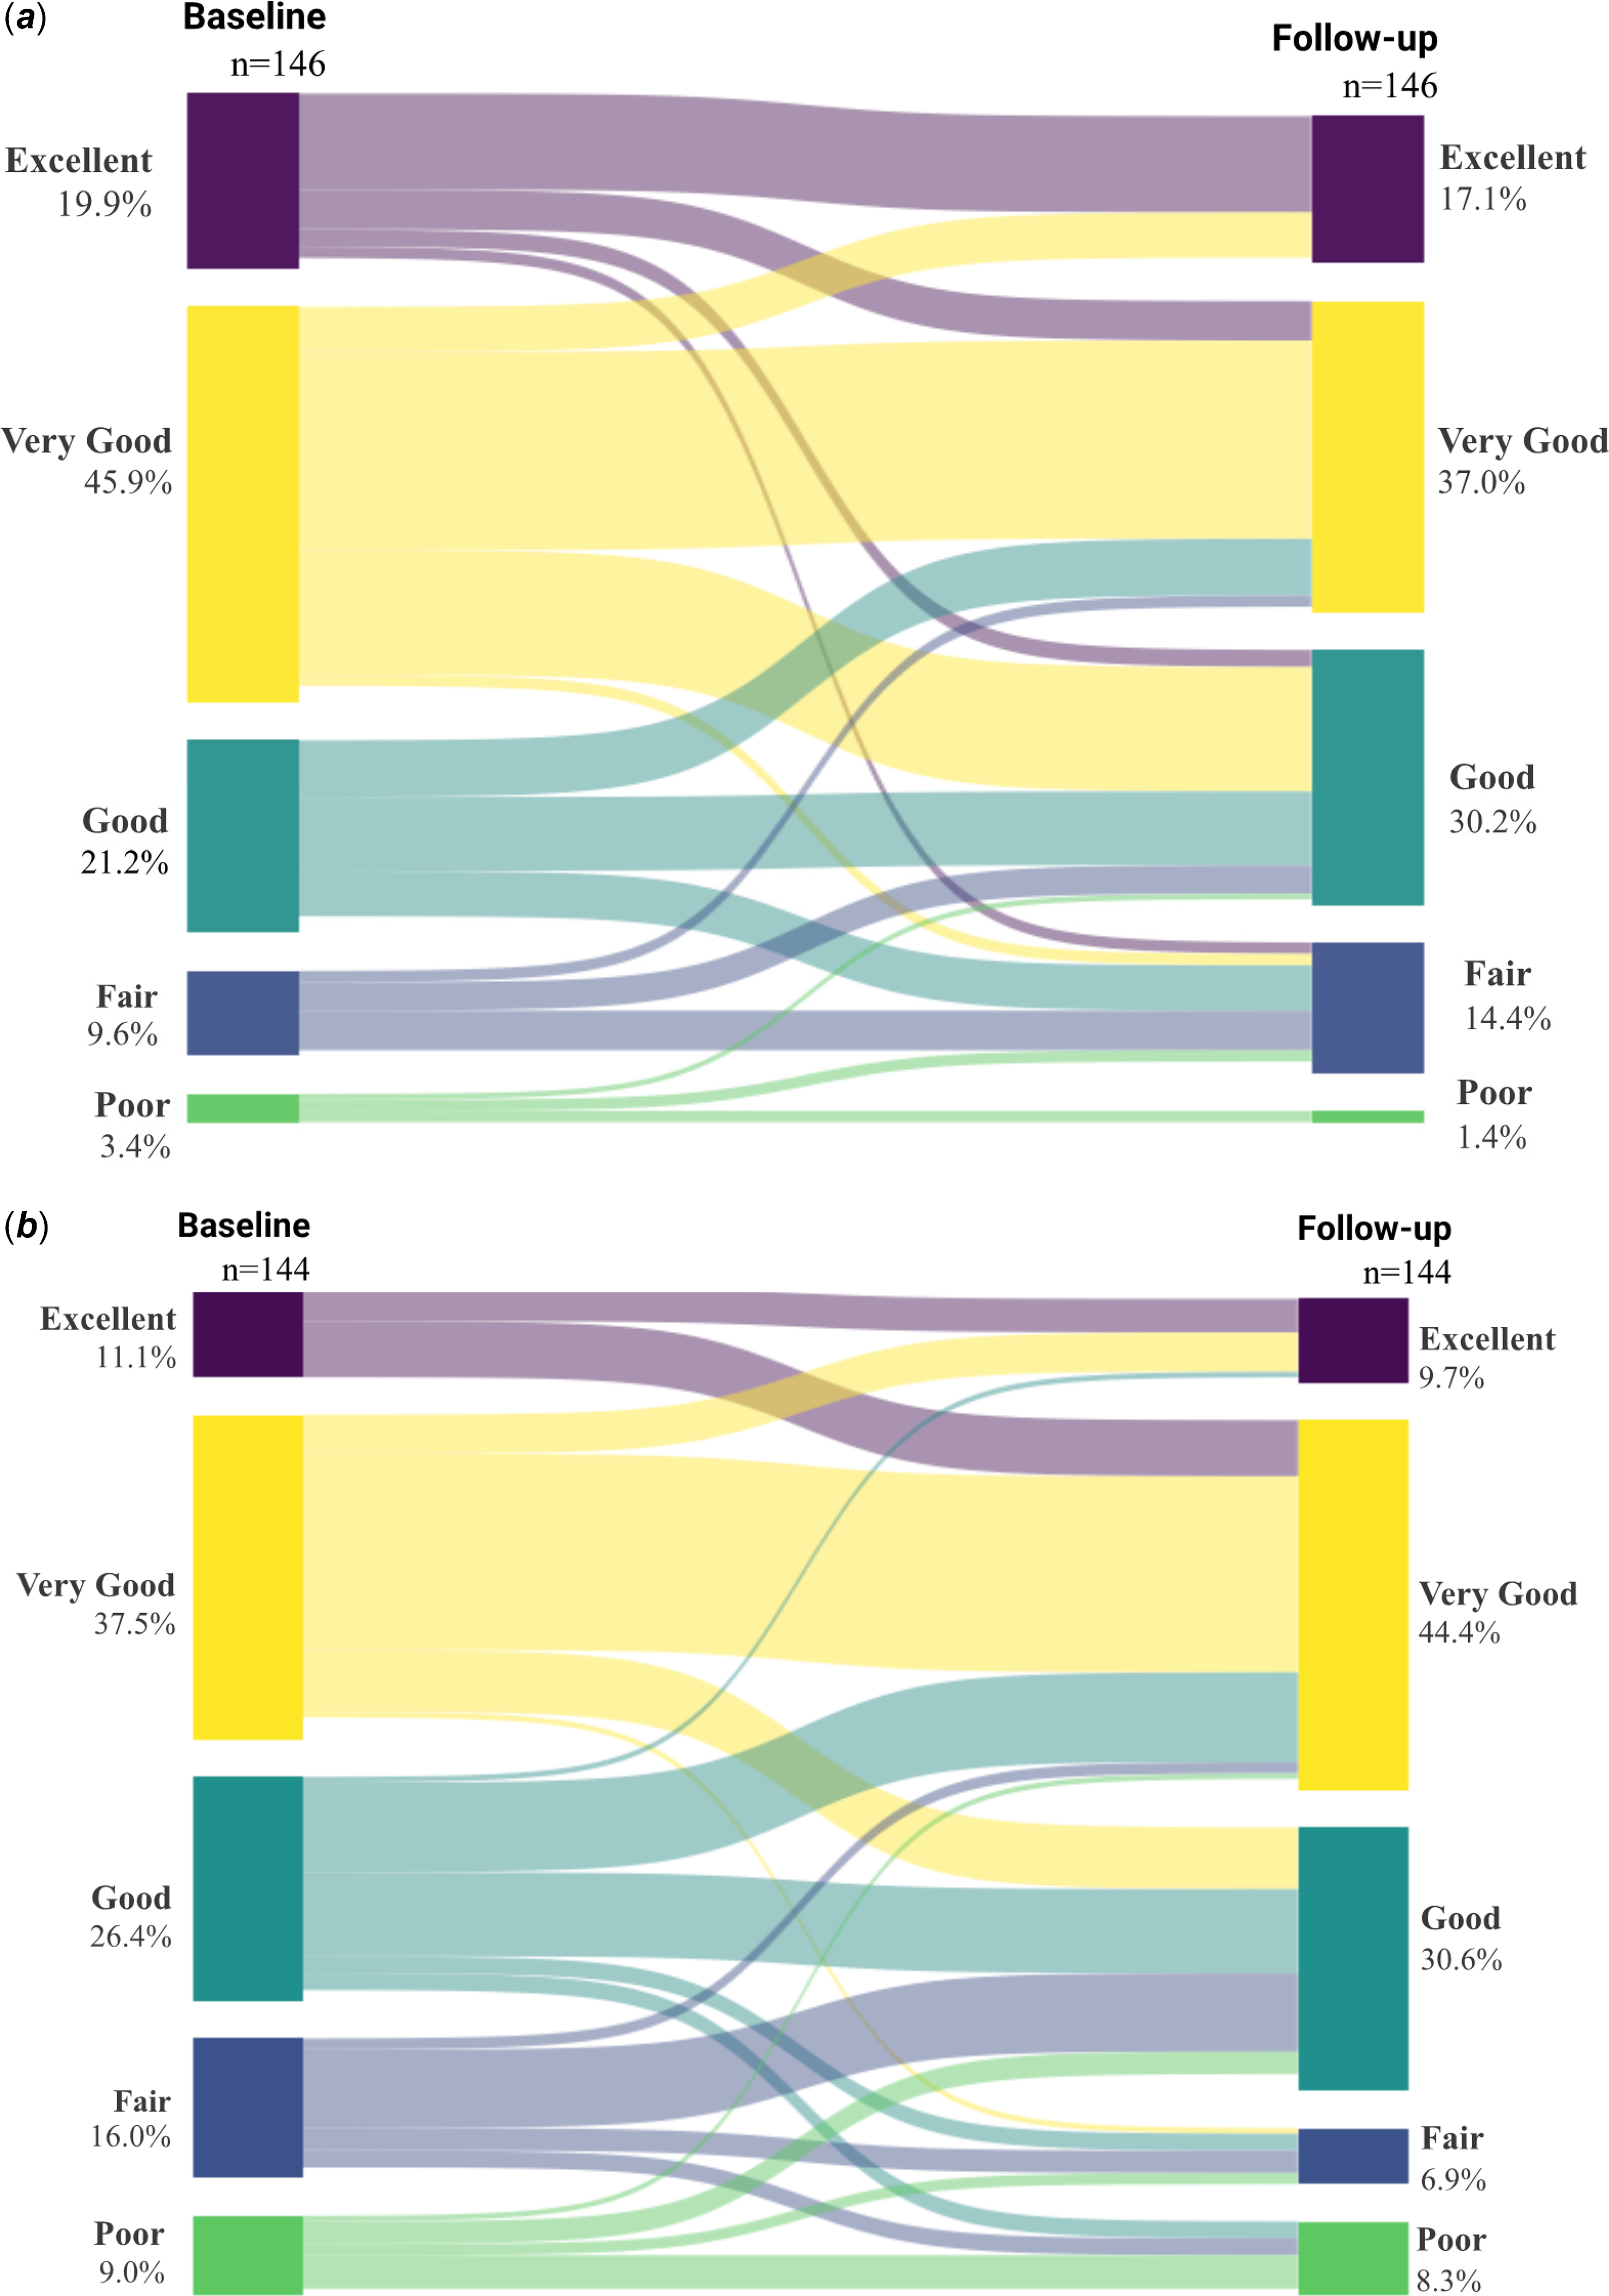
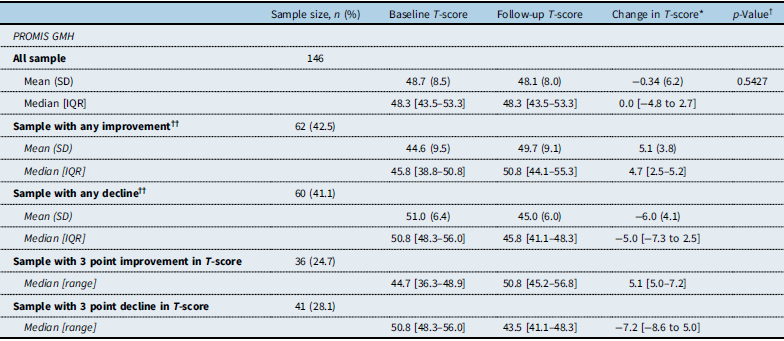
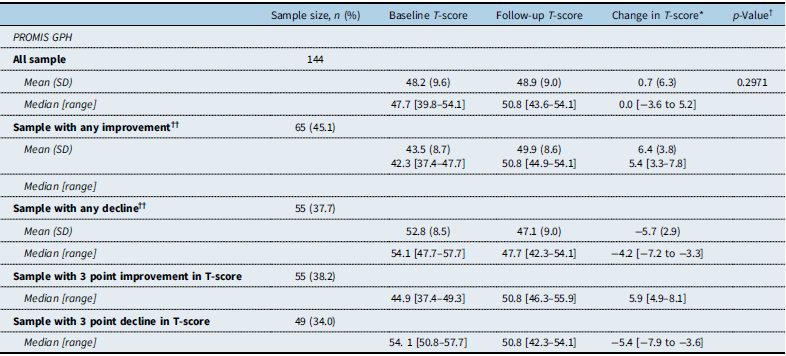
Shapiro–Wilk normality tests indicated non-normal distribution for global mental health and global physical health scores, and non-parametric tests were used for comparisons. Due to incomplete responses, the sample size was 146 participants for the global mental health T-score and 144 for the global physical health T-score, out of 160 participants of the follow-up survey. At baseline, the median global mental health T-score was 48.3 [IQR = 43.5–53.3] for the overall sample and changed to 48.3 [IQR = 43.5–53.3] at the 30-day follow-up (p > 0.05 for change in score). The median global physical health T-score at baseline was 47.7 [IQR = 39.8–54.1] and 50.8 [IQR = 43.6–54.1] at follow-up (p > 0.05, Tables 3 and 4). Figure 2 reports the change in Patient Reported Outcomes Measurement and Information System global mental health and global physical health using a categorical scale from excellent to poor.
Categorical change in PROMIS Global Mental and Physical Health from baseline to follow-up. Panel A: Change in PROMIS Global Mental Health from baseline to follow-up (n = 146). Panel B: Change in PROMIS Global Physical Health from baseline to follow-up (n = 144).

Figure 2. Long description
Panel A: This Sankey diagram illustrates the change in PROMIS Global Mental Health scores from baseline to follow-up for 146 participants. The diagram is divided into two sections: Baseline and Follow-up. Each section is categorized into five levels: Excellent, Very Good, Good, Fair, and Poor. The width of the flows between the baseline and follow-up sections represents the number of participants transitioning between these categories. At baseline, 19.9 percent of participants rated their mental health as Excellent, 45.9 percent as Very Good, 21.2 percent as Good, 9.6 percent as Fair, and 3.4 percent as Poor. At follow-up, these percentages changed to 17.1 percent Excellent, 37.0 percent Very Good, 30.2 percent Good, 14.4 percent Fair, and 1.4 percent Poor. Panel B: This Sankey diagram shows the change in PROMIS Global Physical Health scores from baseline to follow-up for 144 participants. Similar to Panel A, it is divided into Baseline and Follow-up sections with the same five categories. At baseline, 11.1 percent of participants rated their physical health as Excellent, 37.5 percent as Very Good, 26.4 percent as Good, 16.0 percent as Fair, and 9.0 percent as Poor. At follow-up, these percentages changed to 9.7 percent Excellent, 44.4 percent Very Good, 30.6 percent Good, 6.9 percent Fair, and 8.3 percent Poor.
Change in PROMIS global mental health scores from baseline to follow-up

Table 3. Long description
A table comparing changes in PROMIS global mental health scores from baseline to follow-up. The table has 14 rows and 5 columns. Column headers are Sample size, n (%), Baseline T-score, Follow-up T-score, Change in T-score, and p-Value. Row labels include All sample, Sample with any improvement, Sample with any decline, Sample with 3 point improvement in T-score, and Sample with 3 point decline in T-score. Each row provides mean, median, and standard deviation values for baseline and follow-up T-scores, along with the change in T-score and p-value. The table shows detailed statistical data on the changes in global mental health scores over time.
GMH = Global mental health; NA = not applicable; PROMIS = Patient-Reported Outcome Measurement Information System; SD = standard deviation.
* T-score change from baseline to follow-up.
† P-values were derived from Wilcoxon signed-rank tests.
†† Sample with any improvement refers to a sample that had a positive change (>0.0) in T-score from baseline to follow-up. Sample with any decline refers to a sample that had a negative change (<0.0) in T-score from baseline to follow-up.
Change in PROMIS global physical health scores from baseline to follow-up

Table 4. Long description
The table presents data on changes in PROMIS global physical health scores from baseline to follow-up. It includes sample size, baseline T-score, follow-up T-score, change in T-score, and p-value. The table is divided into sections for the overall sample, samples with any improvement, samples with any decline, and samples with 3-point improvement or decline in T-score. Each section provides mean, standard deviation, median, and range values. The overall sample size is 144, with a mean baseline T-score of 48.2 and a follow-up T-score of 48.9. The median baseline T-score is 47.7, changing to 50.8 at follow-up. The sample with any improvement has a mean baseline T-score of 43.5 and a follow-up T-score of 49.9. The sample with any decline has a mean baseline T-score of 52.8 and a follow-up T-score of 47.1. The sample with a 3-point improvement has a median baseline T-score of 44.9 and a follow-up T-score of 50.8. The sample with a 3-point decline has a median baseline T-score of 54.1 and a follow-up T-score of 50.8.
GPH = Global physical health; NA = not applicable; PROMIS = Patient-Reported Outcome Measurement Information System; SD = standard deviation.
* T-score change from baseline to follow-up.
† P-values were derived from Wilcoxon signed-rank tests.
†† Sample with any improvement refers to a sample that had a positive change (>0.0) in T-score from baseline to follow-up. Sample with any decline refers to a sample that had a negative change (<0.0) in T-score from baseline to follow-up.
Change in Patient Reported Outcomes Measurement and Information System global mental health and global physical health scores in improved and declined subsamples
Changes in Patient Reported Outcomes Measurement and Information System scores were not in the same direction for all; some patients experienced improvement and some decline in their T-scores from baseline to follow-up. We derived average global mental health and global physical health T-scores for samples that experienced improvement (i.e., any increase of score at follow-up), decline (i.e., any decrease of score at follow-up), or no change from their baseline scores.
From 146 participants, 62 (42.5%) experienced improvement in their global mental health T-score, with a baseline median of 45.8 [IQR = 38.8–50.8] to a follow-up median of 50.8 [IQR = 44.1–55.3]. The average within-person change from baseline to follow-up for the improved sample was 4.7 [IQR = 2.5–5.2], clinically meaningful (larger than the defined minimal important change of 3). Additionally, 60 (41.1%) patients experienced worsening of global mental health T-scores from baseline to follow-up, with a median clinically meaningful decrease of −5.0 [IQR = −7.3 to −2.5]. Approximately 16.4% (n = 24) of patients reported no change. In the overall sample, 77 (52.7%) of patients had an improvement or decline in global mental health T-score that was above the minimal important change of 3 points. See Table 3 for detailed scores.
From 144 participants, 65 (45.1%) experienced improvement in their global physical health scores. Average baseline (median: 42.3 [IQR = 37.4–47.7]) and follow-up scores (50.8 [IQR = 44.9–54.1]) were derived, and the average within-person change at the 30-day follow-up (median: 5.4 [IQR = 3.3–7.8]) was clinically meaningful. Approximately 38% (n = 55) of patients reported a decline in their global physical health T-score at the 30-day follow-up. The median change in global physical health T-score for this sample surpassed the minimal important change threshold (median: −4.2 [−7.2 to −3.3]). Approximately 72% of patients had a clinically meaningful change (improvement or decline) in global physical health T-score (Table 4).
Subgroup analysis
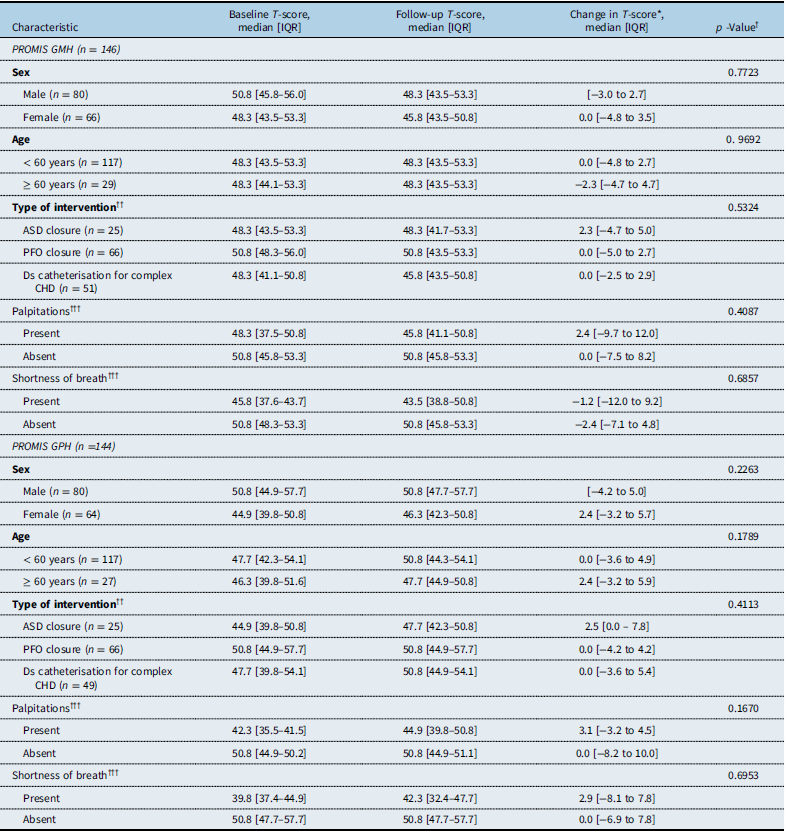
Exploratory subgroup analyses of change in Patient Reported Outcomes Measurement and Information System global mental health and global physical health scores for the variables sex, age, and type of intervention are reported in Table 5. Median global mental health change between sexes, age categories (greater or less than 60), and intervention types were similar (p > 0.05 for change from baseline to follow-up). Females (2.4 [−3.2 to 5.7]), patients 60 years or older (median: 2.4 [−3.2 to 5.9]), and patients with atrial septal defect closure (2.5 [0.0–7.8]) had a higher, but not statistically significant change in global physical health from baseline to follow-up. Median global physical health change between samples with palpitations (3.1 [−3.2 to 4.5] and shortness of breath (2.9 [−8.1 to 7.8]) was also higher, but not statistically significant.
Stratified analysis for change in PROMIS mental and physical health scores

Table 5. Long description
A table comparing changes in PROMIS mental and physical health scores across different characteristics. The table has 20 rows and 5 columns. Columns are labeled: Characteristic, Baseline T-score, median [IQR], Follow-up T-score, median [IQR], Change in T-score*, median [IQR], and p-Value †. The table is divided into two sections: PROMIS GMH and PROMIS GPH. Each section includes rows for sex, age, type of intervention, palpitations, and shortness of breath. Each row provides median T-scores and their interquartile ranges (IQR) at baseline and follow-up, the change in T-score, and the p-value for the change. Notable trends include higher but not statistically significant changes in global physical health for females, patients 60 years or older, and those with atrial septal defect closure.
ASD = atrial septal defect; CHD = congenital heart disease; ds = diagnostic; GMH = Global mental health; GPH = Global physical health; PFO = patent foramen ovale; PPVI = percutaneous pulmonary valve implantation; PROMIS = Patient-Reported Outcome Measurement Information System; SD = standard deviation.
* T-score change from baseline to follow-up.
† P-values were derived from Wilcox rank sum or the Kruskal–Wallis rank sum test, and were comparing median change in T-score (ex: for sex, the test is comparing median change in males vs. females).
†† Percutaneous pulmonary valve implantation and stenting of coarctation of aorta interventions were not included in the subgroup analyses due to small sample sizes (n = 4, 2.4%).
††† Refers to symptoms present at both baseline and after intervention, or absent at both baseline and after intervention.
Discussion
In this novel, prospective investigation, we aimed to understand changes in patient-reported outcomes of adults undergoing transcatheter CHD interventions. We highlight that though overall change in patient-reported outcomes appeared non-significant after the procedure, change occurred in both directions and not uniformly. In our exploratory analyses, we found that a majority of the sample presented with improvement or decline in quality of life that met the criteria for clinically meaningful change.
Patient population
The average age of the study sample was 44.8 (SD = 14.8), and approximately half were females. The most common procedures were patent foramen ovale closure and diagnostic catheterisation for complex CHD, followed by atrial septal defect closure. These numbers were somewhat consistent with a 2015 Canadian environmental scan; from 1,451 total annual cases, 23.7% were patent foramen ovale closure, 29.6% diagnostic catheterisation for complex CHD, and 28.5% were atrial septal defect closures. Reference Stout, Daniels and Aboulhosn9 Though patent foramen ovale closure volumes were lower in this 2015 scan, volumes increased dramatically since 2018, after findings from multiple RCTs concluded that transcatheter closure of patent foramen ovale was superior to medical therapy alone in preventing recurring cerebrovascular events. Reference Ntaios, Papavasileiou and Sagris19 In comparing our sample with participants from other adults with CHD patient-centred studies, including the multinational APPROACH-IS study, we noticed similar demographics. Reference Apers, Kovacs and Luyckx20 Sociodemographic characteristics of Canadian participants (n = 523) specifically were also very similar to our sample, with 49.3% females, 83.4% Caucasians, and 63.7% with postsecondary education. Reference Apers, Kovacs and Luyckx21 Finally, although 37% of the patients who completed the baseline survey did not respond to the 30-day survey, the demographic and procedural characteristics were similar between these groups (data not shown).
In our sample, patients underwent a wide range of transcatheter procedures, ranging from diagnostic to therapeutic interventions. This procedural heterogeneity is important to note, as these procedures are likely to have differing effects on patient-reported outcomes. While therapeutic interventions such as atrial septal defect closure may have a more direct impact on symptom and quality of life, diagnostic procedures may have less direct impact.
Evaluating change in patient-reported mental and physical health
Mean global mental health and global physical health T-scores of our study population were within one standard deviation of the mean T-score of the U.S. general population, indicating that perception of health-related quality of life in the adults with CHD population was not different from the general population. Similar findings were reported in the cross-sectional, multinational APPROACH-IS I trial with 4,028 patients from 15 countries. Reference Apers, Kovacs and Luyckx20
As current literature on patient-reported outcomes in adults with CHD is mostly cross-sectional and doesn’t measure change after an interventional procedure, we measured change in global mental health and global physical health T-scores from baseline to 30 days after the procedure to investigate if the procedure impacted perception of health. Reference Kahr, Radke, Orwat, Baumgartner and Diller5 Though median change in Patient Reported Outcomes Measurement and Information System global physical health and global mental health was not clinically meaningful in the entire sample, we noted that T-scores were changing in both directions (positive and negative) and that the median score change was not representative of clinical experiences. This prompted the study team to separately analyse change in T-scores for the improvement and decline groups. Our analyses revealed that at short-term follow-up, adults with CHD procedures significantly improved or worsened mental and physical health in more than half of patients. On average, the change in T-scores of both the improvement and decline cohorts was clinically meaningful.
Though our sample size precluded regression analyses to understand determinants of change in quality of life, our subgroup analyses explored which factors were associated with quality of life change. We expected differences in patient-reported outcomes by intervention type, considering differences in goals of the procedure (diagnostic vs. procedural), patient clinical characteristics (severity of symptoms in different conditions), and impact of procedure. For example, patients receiving atrial septal defect closure were expected to have an improvement in quality of life due to the well-researched impact of closure on symptoms. In contrast, patients receiving patent foramen ovale closure, who are generally more likely to be healthier before the procedure, may experience a decline in short-term quality of life due to the development of short-term post-procedural symptoms such as palpitations and chest discomfort. Reference Chen and Thijs22 Previous studies report that female sex, lower education, reduced NYHA functional class, lower income stability, and other factors are risk factors associated with quality of life in adults with CHD patients. Reference Rometsch, Greutmann and Latal23,Reference Moons, Luyckx and Kovacs24 Subgroup analyses revealed that none of the selected variables were significantly associated with change in Patient Reported Outcomes Measurement and Information System global mental health scores, but patients with age above 60 and atrial septal defect procedure had a change in Patient Reported Outcomes Measurement and Information System global physical health scores that approached clinical significance. We hypothesise that the small sample sizes in subgroups may not have allowed associations to emerge.
Recommendations for future research and practice
Currently, guidelines and criteria for transcatheter interventions do not address health-related quality of life in profiles, decision-making, and outcomes of adults with CHD patients. Reference Dray and Marelli2,Reference Stout, Daniels and Aboulhosn9,Reference Baumgartner, De Backer and Babu-Narayan25 Our analyses illustrate that patients experience a clinically meaningful change in their perception of their physical and mental health after their interventions. In future analyses, as we enrol a larger sample of patients in our registry, we will explore characteristics and determinants of improvement and decline in Patient Reported Outcomes Measurement and Information System global health scores so that we can clarify reasons for the divergent change observed in our sample and make recommendations on prioritising quality of life reporting before procedures. Additionally, future analyses should consider capturing Patient Reported Outcomes Measurement and Information System global mental health and global physical health scores at 6 and 12 months after the procedure to understand if improvement and decline in scores are consistent at longer follow-up or if patients’ perceptions significantly change over time. These results will supplement clinical outcomes that are routinely captured to assess the long-term effectiveness of adults with CHD interventions.
Limitations
The enrolment of participants into our registries and surveys was conducted by clinical fellows and may not have been done systematically (i.e., there is a likelihood that on some days, patients were not approached for enrolment consecutively depending on the volume of patients in the clinic), and coverage bias may be present. However, as most patients included in this analysis received transcatheter patent foramen ovale closure (44.4%), we compared our patent foramen ovale closure sub-sample with a recent study of 1,032 consecutive patients who had patent foramen ovale closure at Toronto General Hospital between 1997 and 2017. Reference Asghar, Stefanescu Schmidt, Sahakyan, Horlick and Abrahamyan26 We found that distribution of age (p = 0.67) and sex (p = 0.46) were not significantly different between this and our sample populations. The distribution of race/ethnicity (largely Caucasian), education (half with under- or post-graduate degree), and household income (half $75,000 or more) in the study sample may be a result of both a coverage bias and a response bias and may limit the generalisability of our findings. To note, the APPROACH-IS I multinational study on patient-reported outcomes in patients across 15 countries and five continents reported comparable distributions of patient demographics (n = 4,012). Reference Apers, Kovacs and Luyckx20 In our analyses, as the improved and declined cohorts generally had a lower or higher baseline score than the mean, the observed improvement/decline may partly reflect statistical regression towards the mean. Lastly, we were unable to conduct our analyses separately for each intervention type due to limited sample sizes within each group.
Conclusion
In this first study evaluating quality of life of patients after adults with CHD interventions, we identified that change in quality of life is not uniform and that patients experience variability in mental and physical health scores. Further research is needed to understand factors associated with divergent change, providing more insight and recommendations on patient-centred care for adults with CHD transcatheter interventions.
Data availability statement
Participants did not provide written consent for data to be shared publicly, and supporting data is unavailable.
Acknowledgements
We acknowledge the assistance of Tania Jain, Luxshikka Canthiya, and Kishora Ravichandran during the data collection phase. We would like to thank our clinical fellows who helped with recruiting patients into the study and survey administration.
Financial support
This research received no specific grant from any funding agency, commercial or not-for-profit sectors.
Competing interests
Dr Horlick is a consultant for Abbott, Edwards, and Medtronic. He has received research grants from Abbott and Occlutech for other projects. The Structural Heart Disease programme at the University Health Network receives educational support from Abbott, Edwards, and Medtronic. Abbott, Edwards, and Medtronic were not involved in the planning or execution of this study and have not seen or reviewed this manuscript. All other authors have reported that they have no relationships relevant to the contents of this paper to disclose.