Implications
The feasibility of merging data from different experimental herds paves the way to pooling valuable records of rare and difficult-to-record traits, such as those associated with feed intake and efficiency, and body energy balance, from resource populations located in various sites and different countries. Use of the enhanced database would increase the experimental power of effect detection, facilitate genomic selection and enable other genetic analyses that would otherwise be difficult, if not impossible, to conduct separately in each country/herd.
Introduction
Undertaking genetic studies of animal phenotypes presupposes accurate recording on sufficient numbers of animals to help dissect the genetics of the trait. The development of elaborate national monitoring schemes has facilitated routine population-wide on-farm accurate recording of several conventional traits, mostly associated with production (International Committee for Animal Recording, 2011). Certain indicators of functional traits, such as milk somatic cell count in dairy cattle, are included in these programmes. Nevertheless, several increasingly important traits associated with health, fitness and efficiency are currently not possible to routinely record in the commercial population. Understanding the genetic background of such traits depends then on data from experimental resource populations where animals are raised in controlled, closely monitored environments. Such populations, however, are usually of limited size. Combining data from different experimental herds would provide an expanded dataset that would allow a more rigorous genetic analysis of difficult- and expensive-to-record traits.
Furthermore, the advent of high-density single nucleotide polymorphism (SNP) arrays has encouraged the application of this technology to the analysis of economically important traits, especially rare and expensive phenotypes such as feed intake, health and fertility. The amount of data required to find significant associations between SNP markers and phenotypes has led to a number of institutions and countries exploring the possibility of sharing phenotypes and genotypes to enable genomic analyses to be undertaken. This has raised a number of analytical issues regarding the use of ostensibly similar data collected at different sites and subjected to different experimental treatments.
The objectives of this study were to (i) demonstrate the feasibility of merging phenotypic data from different experimental resources and (ii) characterise the merged database and assess its suitability for a joint genetic analysis as a single dataset.
Material and methods
Animals and experimental herds
Data used in this study were collected from first lactation Holstein cows raised in four distinct experimental resource herds in three different countries (one herd in each of Scotland and Ireland, and two in the Netherlands). In all cases, cows were used in various ongoing or previously completed experiments conducted at different time periods, as described below.
Scotland – Crichton herd
Data originated from the Scottish Agricultural College Dairy Research Centre based at Crichton Royal Farm, Scotland. These cows had previously comprised the Langhill herd, Edinburgh (Veerkamp et al., Reference Veerkamp, Simm and Oldham1995; Pryce et al., Reference Pryce, Nielson, Veerkamp and Simm1999) and were transferred to Crichton Royal Farm in September 2001. The herd normally consists of ∼200 milking cows divided evenly between two genetic groups (control v. selection) established in 1992 as part of a still ongoing selection experiment. Cows in each genetic group are further split randomly into two diet groups (high-concentrates v. high-forage) for the purposes of a feeding experiment, which is also in progress. The two genetic groups on a particular diet are managed together.
Control and selection group cows are allocated to the same group as their dams and remain there throughout their productive life. Cow sires in the selection group are picked on the basis of their genetic merit for milk fat and protein yield; available sires with the highest genetic evaluation for fat plus protein kg are chosen at the time of artificial insemination. Sires of control group cows are selected to have the average genetic merit for fat plus protein per kg of UK animals at the time of breeding. In both groups, matings are arranged such that the inbreeding coefficient remains less than 6%.
Furthermore, animals are randomly allocated to either the high-concentrate or the high-forage (low-concentrate) group at first calving in such a way as to keep the groups balanced for number of cows and sires. The high-forage system consists entirely of home-grown feeds, including maize and other whole-crop cereals, and the cows are grazed on grass during the summer months. The winter ration consists of grass silage, maize silage and alkalage at a ratio of 60 : 20 : 20 on a dry matter basis, plus a protein supplement. The ration is fed as a total mixed ration. At least 75% of the dry matter of the ration is designed to come from forages. The target metabolisable energy content is 11.5 MJ/kg dry matter with a target CP content of 180 g/kg dry matter. Forages are supplemented with a range of energy and protein sources to meet the targets shown above. The high-concentrate system cows are housed all year, with access to an exercise area during the summer months. Their ration also contains the three forages mentioned above, in the same dry matter ratio to each other, with a supplement blend of energy and protein ingredients. The target ration metabolisable energy content is 12.3 MJ/kg dry matter with a target CP content of 185 g/kg dry matter.
All cows are kept together and treated the same at all times, except where the production systems require management differences. Cows are milked three times per day.
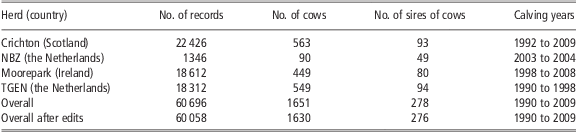
For the purposes of the present study, data pertained to 563 cows equally distributed across the four experimental groups that had calved between 1992 and 2009. Individual records available for each cow were: daily milk yield (sum of three milkings) and liveweight, weekly milk fat and protein yield and milk somatic cell count, and three times weekly dry matter intake.
Ireland – Moorepark herd
This experimental resource is located at the Teagasc Moorepark Research Farm, Republic of Ireland. Data were collated from several studies that had been previously conducted (Buckley et al., Reference Buckley, Dillon, Rath and Veerkamp2000; Kennedy et al., Reference Kennedy, Dillon, Faverdin, Delaby, Stakelum and Rath2003; O'Donovan and Delaby, Reference O'Donovan and Delaby2005; Horan et al., Reference Horan, Faverdin, Delaby, Rath and Dillon2006; Kennedy et al., Reference Kennedy, O'Donovan, Murphy, O'Mara and Delaby2006; McCarthy et al., Reference McCarthy, Berry, Dillon, Rath and Horan2007; McEvoy et al., Reference McEvoy, O'Donovan, Murphy, O'Mara, Rath and Delaby2007). In brief, these studies compared either alternative genotypes of Holstein–Friesian cows raised on different production systems or alternative grazing strategies or grass varieties. Different strains of Holstein–Friesians were evaluated on contrasting grass-based production systems (Buckley et al., Reference Buckley, Dillon, Rath and Veerkamp2000; Kennedy et al., Reference Kennedy, Dillon, Faverdin, Delaby, Stakelum and Rath2003; Horan et al., Reference Horan, Faverdin, Delaby, Rath and Dillon2006; McCarthy et al., Reference McCarthy, Berry, Dillon, Rath and Horan2007). Animals within strain were randomly assigned, at the start of lactation, to feed systems differing in stocking rate and/or concentrate input. Perennial ryegrass (Lolium perenne) was the predominant pasture species in these studies and a rotational grazing system was operated. Annual concentrate feeding level across studies varied from 325 to 1452 kg per cow. All cows calved in the spring and were milked twice daily.
For the purposes of the present study, data pertained to 449 cows that first calved between the years 1998 and 2008. Individual records available for each cow were: daily milk yield (sum of two milkings) and weekly milk fat and protein yield, milk somatic cell count, liveweight and dry matter intake.
The Netherlands – TGEN and NBZ herds
Data originated from two experimental dairy herds, one located near Lelystad (TGEN) and another one near Leeuwarden (NBZ) in the Netherlands.
Data from the TGEN herd were collected between 1990 and 1998 and, for the purposes of the present study, pertained to 549 cows (Veerkamp et al., Reference Veerkamp, Oldenbroek, van der Gaast and van der Werf2000). Two-thirds of these cows belonged to a high genetic merit group that participated in the Delta sib-testing program of Holland Genetics and the others were part of a control group. Cows in the latter group were, on average, about half a standard deviation below the former on the Dutch production index reflecting the impact of milk, fat and protein yield on future net profit. All cows were fed ad libitum with a complete ration of artificially dried grass, corn silage and concentrates with proportions in the dry matter of 6 : 5 : 10. On average, the total mixed ration (64% dry matter) contained 6.87 MJ net energy and 98 g digestible CP/kg of dry matter. Individual records available for each cow were: daily milk yield (sum of two milkings), weekly milk fat and protein yield, milk somatic cell count and liveweight, and five times/week dry matter intake.
Data collected from the NBZ herd were from the period between 2003 and 2004 and pertained to 90 first lactation cows that were participating in a genetic and feeding experiment. Specifically, these cows were divided into two genetic groups with high and low genetic merit for fat and protein production, respectively. Furthermore, cows were split into two diet groups fed a high and a low caloric density ration, respectively. The former comprised 49% corn silage, 30% grass silage and 21% soybeans meal, whereas the low caloric ration included 86% grass silage and 14% concentrates (Beerda et al., Reference Beerda, Ouweltjes, Sebek, Windig and Veerkamp2007; Windig et al., Reference Windig, Beerda and Veerkamp2008). Individual records available for each cow were: daily milk yield (sum of three milkings) and dry matter intake, and weekly milk fat and protein yield, milk somatic cell count and liveweight.
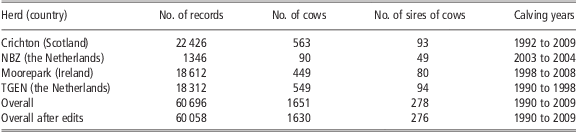
Table 1 summarises the different datasets from the four experimental herds described above.
Data description
Fixed effects
As previously explained, cows belonged to various past and present selection and feeding experiments run in the four herds. Therefore, cows belonged to different genetic and/or diet groups. Specifically, two genetic groups were identified in each one of the four herds. In all cases, cows remained in their respective genetic groups throughout their life. Furthermore, two diet groups were formed in each of Crichton (Scotland) and NBZ (the Netherlands) herds. In both herds, a cow would remain in the same diet groups throughout the entire lactation. In addition, 18 different feeding treatments were identified in the Moorepark (Ireland) dataset. Contrary to Crichton and NBZ, in the Irish herd, a cow might change feeding treatment group during her lactation.
Traits recorded in the four herds
Weekly individual cow records for milk, fat and protein yield, milk somatic cell count, liveweight, dry matter intake and energy intake were extracted from the database of each herd. Records pertained to the daily observation on the day of recording. When multiple records were available within the same week of lactation, weekly values were corresponding arithmetic means. Only first lactation cows were considered in the present study.
Energy intake had already been calculated in each herd, separately, as net energy for the two Dutch herds (TGEN and NBZ) (Beerda et al., Reference Beerda, Ouweltjes, Sebek, Windig and Veerkamp2007) and metabolisable energy for Crichton (Scotland) and Moorepark (Ireland; Emmans, Reference Emmans1994; Friggens et al., Reference Friggens, Ingvartsen and Emmans2003). The latter (ME) was converted to net energy (NE) using the following formula (Van Es, Reference Van Es1978):

where a 70% value was assumed for q (ME/gross energy); q values between 50% and 75% were also tried but made practically no difference in the results. Energy intake was then expressed as net energy for all cows for the remainder of this study.
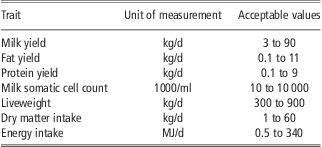
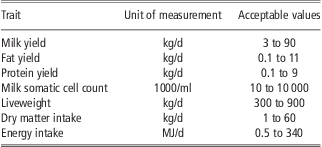
Time edits retained records in the first 44 weeks, corresponding to the typical 305-day lactation. In the case of NBZ, only data for the first 15 weeks of lactation were available. Further edits removed records outside certain biological value ranges set by trait. These limits are shown in Table 2.
Biological limits set for the recorded traits
In addition, a minimum of 5 weekly records were required per cow in order to keep records of her lactation. This edit was modified to 2 weekly records minimum for dry matter and energy intake at Moorepark (Ireland) due to limited recording of these traits in this herd.
After edits, a total of 60 058 weekly records of 1630 cows remained across the four herds. Missing weekly records per cow were predicted with random regression models as described next.
Prediction of missing weekly records
Theoretically, if each one of the 1630 cows in the final dataset had 44 weekly records, a total of 71 720 records would be available. To predict missing weekly records, the following random regression model was used:

where Y is the weekly cow record for a trait; HTYM the fixed effect of herd by year–month of record interaction (four herds, 222 year–month classes); CYM the fixed effect of calving year–month interaction (188 classes); CA the fixed effect of calving age (three classes: <704, 704 to 827, >827 days); GG the fixed effect of genetic group (eight classes); DG the fixed effect of diet group (four classes); IRL the fixed effect of Irish diet treatment (18 classes); MF the fixed effect of milking frequency (two or three times); WK the fixed lactation curve modelled with a 4th order polynomial (5th for somatic cell count); and COW.WK the random cow deviation from fixed curve modelled with a 4th order polynomial (5th for somatic cell count)
Each recorded trait was analysed separately. In the case of milk somatic cell count, a log transformation took place before the analysis to ensure normality.
The order of the polynomial was determined by examining the residual variance. The latter did not change significantly (P > 0.5) when the order increased from 4 to 5 (5 to 6 for milk somatic cell count).
Effect solutions obtained from model 1 were combined to re-create the phenotypic record for all cow-weeks, including those with missing observations.
In the first instance, a single fixed curve was calculated across the four herds. Subsequently, a separate series of analyses took place where four different curves were fitted (one for each herd). This was achieved by fitting a herd-by-week interaction in both the fixed curve and random animal deviation in model 1.
In all cases, heterogeneous residual variances in different herds were accounted for in model 1 by fitting a different residual effect per herd. However, phenotypes were all expressed on the same scale, that is, they were not scaled back according to the original variance of each herd. All analyses were conducted using the ASREML 2.0 software (Gilmour et al., Reference Gilmour, Gogel, Cullis, Welham and Thompson2006).
Derivation of phenotypic traits
At first, energy balance was calculated for each cow and week of lactation. For this purpose, predicted weekly phenotypic records were used to calculate the energy expended by the cow for yield and maintenance, based on the method described by Beerda et al. (Reference Beerda, Ouweltjes, Sebek, Windig and Veerkamp2007). This method is consistent with the net energy principle used to assess energy intake in the four herds in the present study, as described previously. Energy-corrected milk (ECM) was first estimated on the basis of milk yield (M) and fat (F) and protein (P) percent, derived from milk, fat and protein yields, as follows:

Energy expended (EE) for yield and maintenance on a certain week was then calculated as follows:

where LWT was the animal's liveweight. Finally, weekly energy balance was calculated as the difference between energy intake and energy expended.
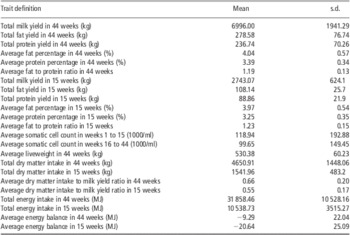
Subsequently, 23 phenotypic lactation traits were derived for all cows, using the predicted weekly records for milk, fat and protein yield, milk somatic cell count, liveweight, dry matter intake, energy intake and energy balance. Total lactation yield (milk, fat and protein) was calculated by multiplying weekly predictions by 7 and then summing them up. Ratio and percent traits were calculated by simple division. Average traits (e.g. milk somatic cell count) were derived as the arithmetic mean of weekly records for the defined period. All lactation traits are summarised in Table 3.
Traits derived from predicted weekly records

For average milk somatic cell count, two distinct time periods were considered, weeks of lactation 1 to 15 and weeks of lactation 16 to 44, in order to define the two potentially different traits in early and later lactation (Mrode and Swanson, Reference Mrode and Swanson2003). For all other traits, two lactation periods were considered: a 44-week lactation (consistent with the typical 305-day lactation) and a 15-week lactation, marking the crucial first 100 days of lactation. The latter also corresponds to the period of the animal's recovery from a negative energy state (Coffey et al., Reference Coffey, Emmans and Brotherstone2001; Banos et al., Reference Banos, Coffey and Brotherstone2005). Furthermore, a 15-week lactation is more appropriate for NBZ cows where no later weekly records were available.
Estimation of genetic parameters
Lactation traits derived in the previous section were analysed with mixed linear models, including the effects of herd, calving year–month and age, genetic and diet group, milking frequency and cow. A pedigree file comprising 8850 animals across the four herds was used to derive genetic variance and heritability estimates.
In a separate set of analyses, sire-by-herd interaction was added in the model as a random effect to assess the magnitude of genotype-by-environment (herd) interaction. Models with and without a sire-by-herd interaction effect were compared with the Akaike Information Criterion (AIC), a measure of the relative goodness of fit of a statistical model proposed by Akaike (Reference Akaike1974).
The issue of genotype-by-environment interaction was also addressed with a series of multi-trait analyses, where individual traits in the four herds were treated as different but genetically correlated traits.
All calculations were based on the REML method and used the ASREML 2.0 software package (Gilmour et al., Reference Gilmour, Gogel, Cullis, Welham and Thompson2006).
Results and discussion
Prediction of missing weekly records
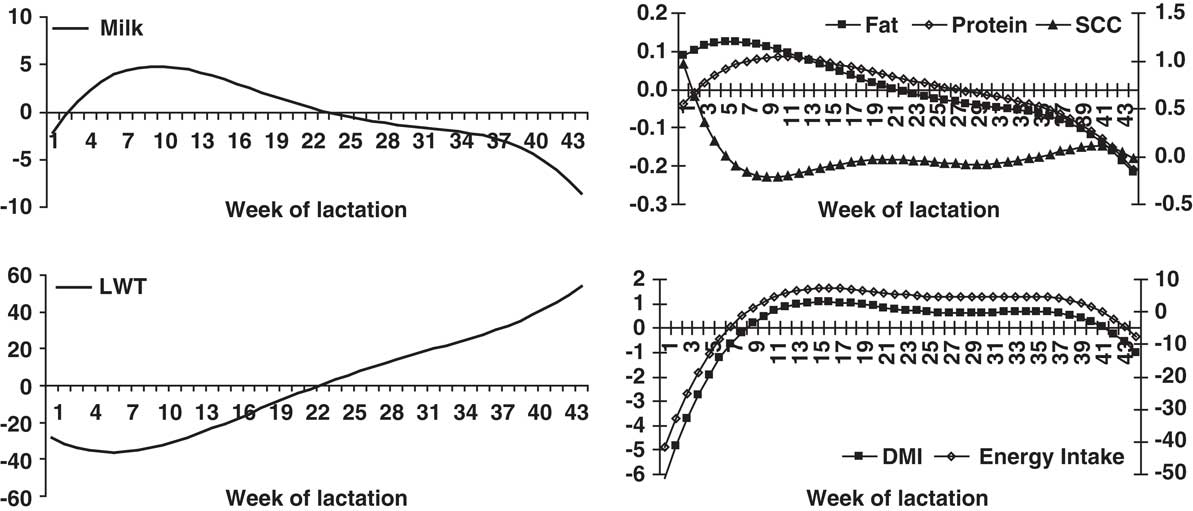
Figure 1 illustrates the predicted lactation curves of the seven recorded traits in the four herds (milk, fat and protein yield, milk somatic cell count, liveweight, dry matter intake and energy intake by week of lactation). These results correspond to the overall fixed curve in model 1, representing the average lactation trajectory of each trait across all animals and herds, adjusted for all other effects in the model.
Predicted lactation curves for milk yield (kg), fat yield (kg), protein yield (kg), milk somatic cell count (SCC – log-transformed 1000/ml), liveweight (LWT – kg), dry matter intake (DMI – kg) and energy intake (MJ) by week of lactation; a singe curve was fitted across herds.
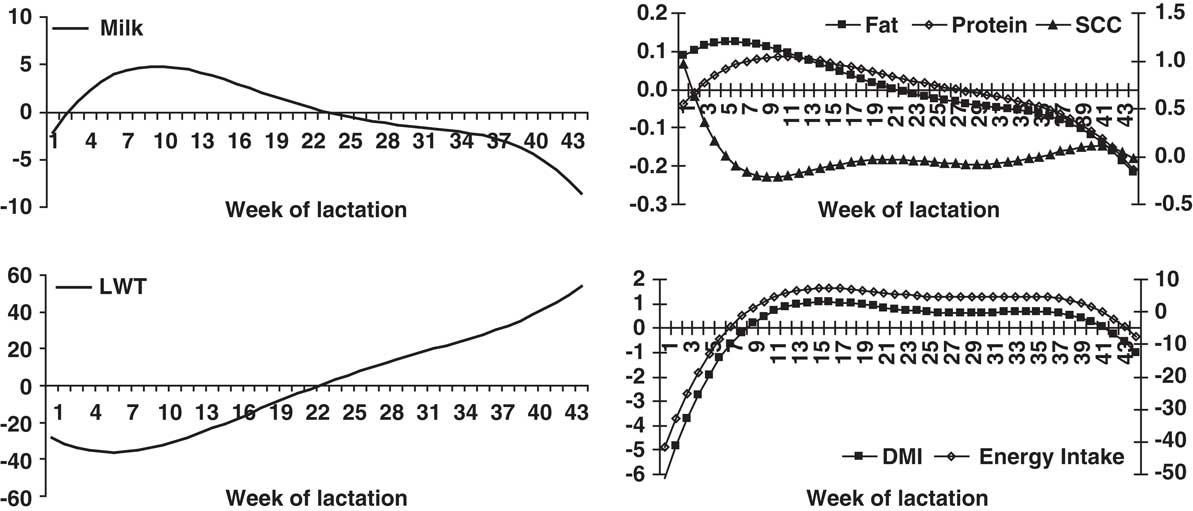
The trait profile depicted in Figure 1 was as expected in all cases. Milk, fat and protein yields showed the well-known initial increase during the first 10 weeks of lactation followed by a gradual decline towards the end of lactation. The initial increase in production was matched by an increase in dry matter and energy intake, which remained constant afterwards, similar to trends reported in other studies based on experimental (Ordway et al., Reference Ordway, Boucher, Whitehouse, Schwab and Sloan2009) and commercial (Vallimont et al., Reference Vallimont, Dechow, Daubert, Dekleva, Blum, Barlieb, Liu, Varga, Heinrichs and Baumrucker2010) herd data. Milk somatic cell count showed an inverse milk yield curve, suggestive of the relationship between the two traits.
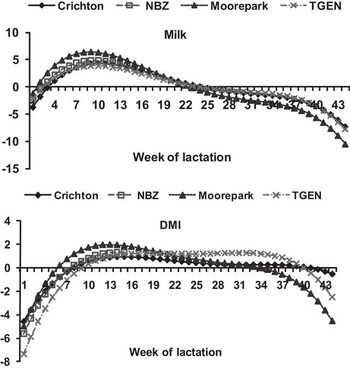
Very similar results were derived when separate curves were fitted for each herd, suggesting that combining records across herds did not change the lactation profile of the trait. Furthermore, the correlation between predicted phenotypes with this model and the model with a single overall curve was near unity for milk traits and liveweight, and 0.981 to 0.987 for dry matter and energy intake. Figure 2 illustrates two examples: one for a conventional trait (milk yield) and one for a rare trait (dry matter intake). It should be noted that results in Figure 2 were expressed on the same scale for all herds, that is, were not re-scaled according to the original variance of each herd. Therefore, differences between herds shown in Figure 2 do not represent true differences between animals raised in these herds. The purpose of Figure 2 was to compare the shape of the individual within-herd curves with that of the across-herd curves of Figure 1 and not to compare herd production and performance levels.
Predicted individual lactation curves for milk yield (kg) and dry matter intake (DMI – kg) for each of the four herds (Crichton – Scotland, NBZ – the Netherlands, Moorepark – Ireland, TGEN – the Netherlands) by week of lactation; results are expressed on a common scale for all herds.

Genetic parameters of derived traits
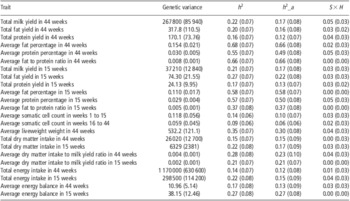
Estimates of genetic variance, heritability and proportion of total variance attributed to sire-by-herd interaction for all derived traits are shown in Table 4. Genetic variance estimates were greater (P < 0.05) than zero in all cases except for average milk somatic cell count in weeks 16 to 44 of lactation, suggesting that diverse experimental data from distinct herds may be merged into a single database amenable to a joint genetic analysis.
Estimates of genetic variance and h 2 obtained with an additive model, and proportion of total variance due to h 2_a and to S × H when the latter was included in the model; standard errors are in parentheses

h 2 = heritability; h 2_a = additive effects; S × H = sire-by-herd interaction.
In general, heritability estimates shown in Table 4 were consistent with estimates provided in the literature from various studies worldwide (Toshniwal et al., Reference Toshniwal, Dechow, Cassell, Appuhamy and Varga2008; Urioste et al., Reference Urioste, Franzén and Strandberg2010; Vallimont et al., Reference Vallimont, Dechow, Daubert, Dekleva, Blum, Barlieb, Liu, Varga, Heinrichs and Baumrucker2010; Buttchereit et al., Reference Buttchereit, Stamer, Junge and Thaller2011). With the exception of average milk somatic cell count in weeks 16 to 44 of lactation, all heritability estimates were statistically greater than zero (P < 0.05). Heritability estimates were also derived separately within herd and, in general, were in the same range as the across-herd estimates presented in Table 4. For example, within-herd heritability estimates of total milk yield in the first 15 weeks of lactation varied from 0.20 to 0.31, whereas estimates for total dry matter intake in the same period ranged from 0.15 to 0.27 in the four different herds. However, there were few cases, such as liveweight, where a wider range of within-herd heritability estimates was obtained (0.38, 0.21, 0.47 and 0.48 for Crichton, NBZ, Moorepark and TGEN, respectively). This may be attributed to different variance magnitude in the four herds associated with different dataset sizes. For example, NBZ had the lowest estimate and smaller dataset.
Including a sire-by-herd interaction effect in the model of analysis led to a small reduction in heritability estimates (Table 4), suggesting that a minor part of the previously estimated additive genetic variance might be attributed to interaction effects. However, the proportion of total phenotypic variance accounted for by the sire-by-herd interaction effect was always nonsignificantly (P > 0.05) different from zero. Furthermore, the difference of AIC between the two models was statistically not greater than zero (P > 0.05), suggesting that including a sire-by-herd interaction effect did not improve the fit of the model for any of the traits. This result implies that a joint analysis of data from the different herds that is based on the assumption of no genotype-by-environment interaction is possible, although supporting the notion of merged phenotypes from these four herds being viewed as a single dataset in a genetic analysis.
In most cases, genetic correlations between the same trait in different herds were inestimable or associated with very large standard errors that rendered them not significantly different from zero (P > 0.05). The reason is probably the relatively weak genetic links between the four herds. For example, in the Crichton (Scotland) dataset there were 7, 6 and 16 sires in common with NBZ (the Netherlands), Moorepark (Ireland) and TGEN (the Netherlands), respectively. NBZ had 5 and 2 common sires with Moorepark and TGEN, respectively, whereas there were 11 bulls in common in the last two herds. Of course, pedigree relationships and the use of the numerator relationship (A) matrix in the analysis provided some additional links among these herds. Thus, the average of the off-diagonals of the A matrix was 0.010 between Crichton and NBZ, 0.008 between Crichton and Moorepark, 0.013 between Crichton and TGEN, 0.008 between NBZ and Moorepark, 0.011 between NZB and TGEN and 0.012 between Moorepark and TGEN. For comparison, the average of the off-diagonals of the A matrix within herd was 0.016, 0.013, 0.015 and 0.022 for Crichton, NBZ, Moorepark and TGEN, respectively.
The only significant (P < 0.05) genetic correlation pertained to high heritability traits (average fat and protein percent, and fat-to-protein ratio). Thus, significant genetic correlations were estimated between Crichton and TGEN for fat percentage in 44 weeks (0.98), protein percentage in 44 weeks (0.94), fat percentage in 15 weeks (0.99) and fat-to-protein ratio in 44 weeks (0.98). Additional significant correlations were found between Crichton and NBZ for fat percentage in 44 weeks (0.94) and protein percentage in 15 weeks (0.97), and between NBZ and Moorepark for fat percentage in 44 weeks (0.85) and protein percentage in 15 weeks (0.94). In all these cases, estimated correlations were practically not different from unity, suggesting that trait definition was consistent in the four herds.
Genetic correlations between rare traits in the different herds were mostly inestimable. Among valid estimates, the correlation between Crichton and TGEN (the two herds with the larger number of common bulls) was 0.74 (P = 0.33) for average energy balance in 15 weeks, 0.90 (P = 0.21) for total energy intake in 15 weeks, 0.81 (P = 0.28) for total dry matter intake in 15 weeks and 0.75 (P = 0.38) for average liveweight. Although highly positive, these estimates can only be viewed as potentially indicative values that did not attain statistical significance, thereby meriting no further discussion.
It is possible that conventional traits such as milk yield are more consistently defined and recorded in different herds than traits like energy intake, energy balance and liveweight. This will be a difficult issue to resolve because of potential differences in recording equipment and methods in the various herds. Nevertheless, the utility of merging database is expected to be more pronounced for such difficult-to-record traits. Despite the inestimability of genetic correlations among herds, lack of evident sire-by-herd interaction reported in the present study lends support to this claim.
Impact of increased dataset size on the power of effect detection
Increasing the size of a dataset implies greater statistical power, meaning that effects of lesser magnitude could become detectable in a genetic analysis. To assess the magnitude of this benefit, post-hoc power analyses were conducted based on a simple simulation design. Power values of detection for varying effect sizes and an alpha level equal to 0.05 were calculated (Erdfelder et al., Reference Erdfelder, Faul and Buchner1996), considering first the data size of each individual herd separately and then that of the combined dataset. Single fixed effects whose size was expressed in phenotypic standard deviation units were considered.
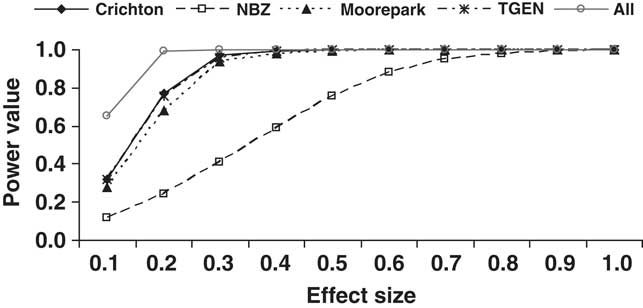
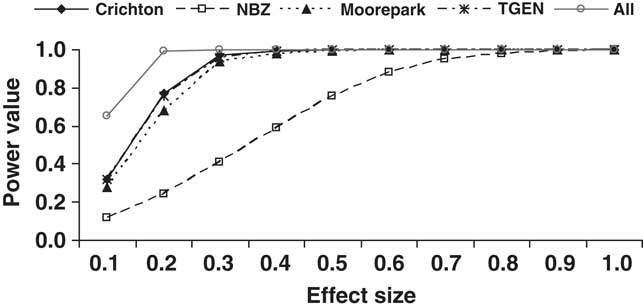
Results from this exercise are shown in Figure 3. As expected, power of effect detection was highest for the combined dataset, reaching nearly unity for effect size equal to 0.2 s.d. This value corresponds to the minimum difference between two levels of the effect, expressed in standard deviation units that could be detected; examples of the latter may be two alleles of a certain gene or genetic marker, or two levels of a treatment. When analysed separately, the three largest herds (Crichton – Scotland, Moorepark – Ireland and TGEN – the Netherlands) would reach the same power level for an effect size equal to 0.3 to 0.4 s.d. The smallest population (NBZ herd in the Netherlands) would stand to benefit the most from combining data, as by itself would not be able to achieve the same level of power before the effect size reached 0.8 s.d.
Power values of a single fixed effect detection (P < 0.05) for different effect sizes by herd (Crichton – Scotland, NBZ – the Netherlands, Moorepark – Ireland, TGEN – the Netherlands) and for the combined database (All), expressed in standard deviation units.
Conclusions
Significant genetic variance and heritability was calculated for nearly all traits after merging data from the four different experimental herds and predicting missing records, suggesting that genetic analyses based on a combined database is both feasible and sensible. The assumption of no genotype-by-environment (herd) interaction, which enhances the usefulness of merging datasets, seems to hold but should nonetheless be quantified in other merged datasets.
A combined dataset including all traits described in the present study is currently being considered in genome-wide association analyses. Across herd variance estimates presented here are being used as starting values for the calculation of genetic marker effects on the various traits.
This study was based on first lactation data only. Future studies may also consider multiple lactations and a different trait definition for mature compared with growing animals.
Acknowledgements
This work was jointly financed by a RERAD grant to Scottish Agricultural College and the RobustMilk project, which is financially supported by the European Commission under the Seventh Research Framework Program, Grant Agreement KBBE-211708. The content of this paper is the sole responsibility of the authors, and it does not necessarily represent the views of the European Commission or its services. Ainsley Bagnall and other farm staff are thanked for taking milk samples and other recordings on the farm and Ross McGinn is thanked for judiciously curating the Langhill–Crichton data over 25 years. Farm staff, technicians and database managers at Teagasc, Moorepark are also gratefully acknowledged.