INTRODUCTION
In its fourth assessment report, the Intergovernmental Panel on Climate Change (IPCC Reference Parry, Canziani, Palutikof, van der Linden and Hanson2007) concluded that climate change is already happening with multi-faceted effects on human societies and the environment. There is also an emerging consensus that Eastern Africa, and particularly Ethiopia, is one of the most vulnerable regions regarding the impacts of climate variability and change (Slingo et al. Reference Slingo, Challinor, Hoskins and Wheeler2005; Boko et al. Reference Boko, Niang, Nyong, Vogel, Githeko, Medany, Osman-Elasha, Tabo, Yanda, Parry, Canziani, Palutikof, van der Linden and Hanson2007; Challinor et al. Reference Challinor, Wheeler, Garforth, Craufurd and Kassam2007; Thornton et al. Reference Thornton, Jones, Ericksen and Challinor2011). Several studies on precipitation and temperature change have indicated that the African continent is now warmer than it was 100 years ago and the rainfall exhibits higher inter-annual and intra-seasonal variability (Boko et al. Reference Boko, Niang, Nyong, Vogel, Githeko, Medany, Osman-Elasha, Tabo, Yanda, Parry, Canziani, Palutikof, van der Linden and Hanson2007; Challinor et al. Reference Challinor, Wheeler, Garforth, Craufurd and Kassam2007; Cooper et al. Reference Cooper, Rao, Singh, Dimes, Traore, Rao, Dixit and Twomlow2009; Cooper & Coe Reference Cooper and Coe2011; Rosell Reference Rosell2011). Climate variability over the last three decades of the 20th century resulted in droughts and famine in several African countries (Conway & Schipper Reference Conway and Schipper2011; Dixit et al. Reference Dixit, Cooper, Dimes and Rao2011).
Ethiopia is among the most vulnerable countries in Africa due to its great reliance on climate-sensitive industries, particularly agriculture (Thornton et al. Reference Thornton, Jones, Owiyo, Kruska, Herrero, Kristjanson, Notenbaert, Bekele, Omolo, Orindi, Otiende, Ochieng, Bhadwal, Anantram, Nair, Kumar and Kulkar2006; World Bank 2006; Hellmuth et al. Reference Hellmuth, Moorhead, Thomson and Williams2007; NMA 2007; Conway & Schipper Reference Conway and Schipper2011; Rosell Reference Rosell2011). Historically, strong links have been observed between climate variability and the overall performance of Ethiopia's economy, reflected by high correlation between rainfall and gross domestic product (GDP) fluctuations (World Bank 2006). Climate variability, particularly rainfall variability and associated droughts, have been major causes of food insecurity and famine in Ethiopia (Conway Reference Conway2000; Hulme et al. Reference Hulme, Doherty, Ngara, New and Lister2001; Seleshi & Zanke Reference Seleshi and Zanke2004; Thornton et al. Reference Thornton, Jones, Owiyo, Kruska, Herrero, Kristjanson, Notenbaert, Bekele, Omolo, Orindi, Otiende, Ochieng, Bhadwal, Anantram, Nair, Kumar and Kulkar2006; NMA 2007; Conway & Schipper Reference Conway and Schipper2011; Demeke et al. Reference Demeke, Keil and Zeller2011; Perrin et al. Reference Perrin, Mearns, Kononen, Kuriakose and Agrawal2011; Rosell Reference Rosell2011). For instance, Seleshi & Zanke (Reference Seleshi and Zanke2004) reported that the 1984 famine, the worst disaster that Ethiopia experienced in the 20th century, was the result of failure of the main rainfall season, which resulted in reduction of the GDP by 9·7% and agricultural outputs by 21% (World Bank 2006). The 1984 famine was an extreme event, but crop failure or reduced yields due to water shortage during the growing season is a common risk, particularly for the rainfed cropping systems in semi-arid Ethiopia.
Various studies indicate that future climate change will lead to an increase in climate variability and in the frequency and intensity of extreme events (Boko et al. Reference Boko, Niang, Nyong, Vogel, Githeko, Medany, Osman-Elasha, Tabo, Yanda, Parry, Canziani, Palutikof, van der Linden and Hanson2007; Stern Reference Stern2007). The changing rainfall pattern in combination with warming trends could make rainfed agriculture more risky and aggravate food insecurity in Ethiopia. Van de Steeg et al. (Reference Van de Steeg, Herrero, Kinyangi, Thornton, Rao, Stern and Cooper2009), for instance, indicate that the growing season in some parts of Ethiopia could be 20% shorter by 2050 relative to the current baseline period (1960–90), which would have negative repercussions on food production.
Understanding the variability and expected future changes of climatic conditions, particularly characteristics of rainfall, temperature and evapotranspiration (which is co-determined by temperature) is, therefore, crucial for planning and designing appropriate adaptation strategies. The present study aims to understand and characterize variability and changes of agro-climatic conditions and associated risks for rainfed crop production in Ethiopia. The Central Rift Valley (CRV) is used as a case study area. It is one of the environmentally vulnerable regions in Ethiopia, where rainfed crop production has expanded rapidly over recent decades (Jansen et al. Reference Jansen, Hengsdijk, Legesse, Ayenew, Hellegers and Spliethoff2007).
MATERIALS AND METHODS
Description of the study area
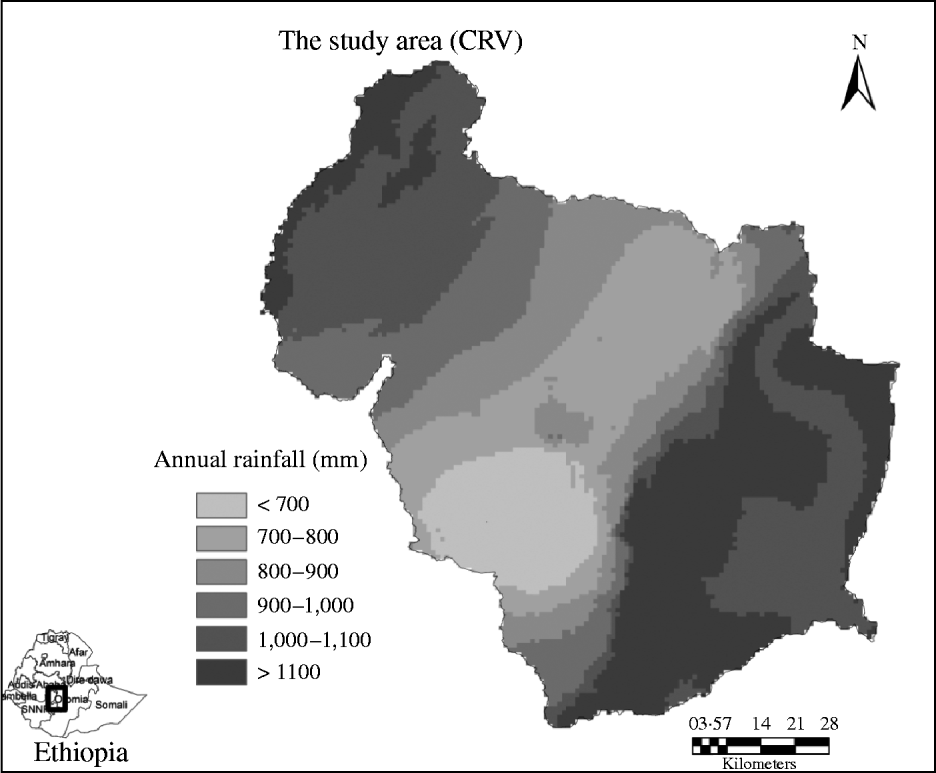
The CRV of Ethiopia (Fig. 1) is part of the great East African Rift Valley system. The centre of CRV (c. 10 000 km2) is located 120 km south of Addis Ababa and it is characterized by an alternating topography with a central valley floor at 1500–1700 m a.s.l. and bounded by western and eastern escarpments with highest altitudes of over 4000 m a.s.l. (Jansen et al. Reference Jansen, Hengsdijk, Legesse, Ayenew, Hellegers and Spliethoff2007). Based on annual rainfall distribution, CRV is characterized by a bi-modal rainfall pattern, which is a typical characteristic for the central, eastern and north–eastern parts of Ethiopia. Its valley floor receives 175–358 mm rainfall during a short rainy season (March–April), locally known as Belg and 420–680 mm during the main rainy season (June–September), locally known as Kiremt. The Belg rainfall is caused by humid easterly and south-easterly winds from the Indian Ocean, and Kiremt rainfall is a result of convergence in low-pressure systems associated with the Inter Tropical Convergence Zone (Conway Reference Conway2000; Seleshi & Zanke Reference Seleshi and Zanke2004; NMA 2007). Crop production, mainly rainfed cereal-based production systems and modest livestock rearing are the mainstays of livelihoods for households in the CRV. The major crops are cereals, mainly teff (Eragrostis tef), maize (Zea mays) and wheat (Triticum aestivum).
Location map of the study area (CRV) in Ethiopia with spatial distribution of its annual rainfall. The annual rainfall map is obtained from WorldClim Global climate data set (Hijmans et al. Reference Hijmans, Cameron, Parra, Jones and Jarvis2005).

Data sources and data quality assessment
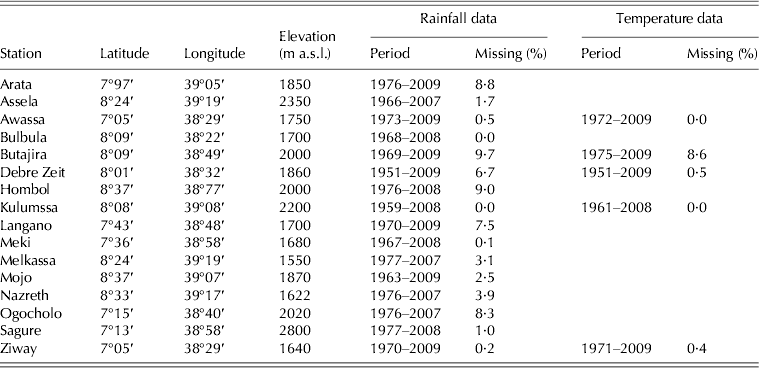
Daily meteorological data from 24 stations were obtained from the National Meteorological Agency (NMA) of Ethiopia. Sixteen stations (Table 1) were selected, which have relatively long periods of data records (at least 30 years) and have no more than 10% missing values (Seleshi & Zanke Reference Seleshi and Zanke2004; Rosell Reference Rosell2011). The daily time series from each station and for each year were plotted to identify obvious outliers, which were removed from the data series. Outliers were detected using the Tukey fence approach (Tukey Reference Tukey1977). The rules of this approach are that inner fences are located at a distance 1·5 times the interquartile range below the lower and above the upper quartiles and outer fences are located at a distance of 3 times the interquartile range below the lower and above the upper quartiles. Values outside the Tukey fences are considered as outliers. Negative daily rainfall records were also removed and maximum and minimum temperature values were set to missing values if the daily maximum value was less than the daily minimum value. With this procedure, two daily rainfall records at Langano and three daily rainfall records at Hombol were removed and one maximum temperature record at Butajira was set to a missing value. The data series was also examined for homogeneity and no heterogeneity was detected. Missing data in time series were filled with data from neighbouring stations using statistical regression techniques as described in detail in Allen et al. (Reference Allen, Pereira, Raes and Smith1998) and applied in various studies (Seleshi & Zanke Reference Seleshi and Zanke2004; Vergni & Todisco Reference Vergni and Todisco2011).
Rainfall and temperature data for representative stations in and around the CRV, Ethiopia
Data analysis
The temporal variability and occurrence of various rainfall and temperature indices were evaluated at selected weather stations based on the analysis of a set of indicators defining variation and extreme conditions, following Stern et al. (Reference Stern, Dennett and Dale1982); Trnka et al. (Reference Trnka, Olesen, Kersebaum, Skjelvåg, Eitzinger, Seguin, Peltonen-Sainio, Rötter, Iglesias, Orlandini, Dubrovský, Hlavinka, Balek, Eckersten, Cloppet, Calanca, Gobin, Vučetić, Nejedlik, Kumar, Lalic, Mestre, Rossi, Kozyra, Alexandrov, Semerádová and Žalud2011) and Vergni & Todisco (Reference Vergni and Todisco2011). The rainfall indices include values of accumulated rainfall (monthly, annual and seasonal), number of rainy days, mean daily rainfall intensity, precipitation concentration index (PCI; see later), normalized rainfall anomaly (RA; see later), start of the growing season (SOS), end of the growing season (EOS), length of growing season (LGS), dry spells and crop water requirement satisfaction index (WRSI). The temperature indices were the annual minimum and maximum temperature, mean annual temperature, minima and maxima of daily minimum and maximum temperature, number of days with daily maximum temperature exceeding 25 °C (summer days).
Trends were assessed using the Mann–Kendall trend test (Mann Reference Mann1945; Kendall Reference Kendall1975) and Sen's slope estimator (Sen Reference Sen1968). The Mann–Kendall test is a non-parametric approach, widely applied in various trend detection studies (Alexander & Arblaster Reference Alexander and Arblaster2009; Kizza et al. Reference Kizza, Rodhe, Xu, Ntale and Halldin2009; Karaburun et al. Reference Karaburun, Demirci and Kara2011). Statistical analyses and other computations were performed with INSTAT v3.36 statistical software (Stern et al. Reference Stern, Rijks, Dale and Knock2006).
Analysis of rainfall and temperature variability
Spatial distribution of the mean annual rainfall was obtained from the WorldClim global climate data set (Hijmans et al. Reference Hijmans, Cameron, Parra, Jones and Jarvis2005). The temporal rainfall variability for representative meteorological stations was determined by calculating the coefficient of variation (CV) as the ratio of the standard deviation to the mean rainfall in a given period (CV%, when expressed as a percentage). Heterogeneity of monthly rainfall amount was investigated using the PCI (Bewket Reference Bewket2008; Vergni & Todisco Reference Vergni and Todisco2011). The PCI used for characterizing the monthly rainfall distribution is given by Oliver (Reference Oliver1980):
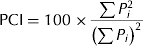 $${\rm PCI} = 100 \times \displaystyle{{\sum {P_i ^2}} \over {\left( {\sum {P_i}} \right)^2}} $$
where P i is the rainfall amount of the ith month. PCI values of <10 indicate uniform monthly rainfall distribution throughout the year, whereas values from 11 to 20 denote seasonality in rainfall distribution. Those PCI values >20 correspond to substantial monthly variability in rainfall amounts.
Inter-annual variability was evaluated using standardized anomalies for rainfall with respect to the long-term normal conditions for a specific time scale. The normalized RA for a given station was computed as:
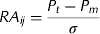 $$RA_{ij} = \displaystyle{{P_t - P_m} \over \sigma} $$
where RA ij is the normalized rainfall total for station i during a year (or season) j; P t the annual rainfall in year t; P m the long-term mean annual rainfall over the period of observation; σ the s.d. of annual rainfall.
Positive normalized rainfall anomalies indicate greater than long-term mean rainfall, whereas negative anomalies indicate less than the mean rainfall. When averaged over several stations, the normalized RA yields a normalized RA index.
For temperature trend analysis, daily temperature data sets of five representative stations with high-quality data records (Table 1) were examined on annual and seasonal basis.
Analysing the growing season characteristics
Start and end of the growing season
According to Stern et al. (Reference Stern, Dennett and Dale1982) the start of the rainy season can be defined as the first occurrence of at least ‘X’ mm rainfall totalled over ‘t’ consecutive days. This potential start can be a false start if an event, F, occurs afterwards, where F is defined as a dry spell of ‘n’ or more days in the next ‘m’ days. This approach was adopted in the present paper and the earliest SOS was defined as the first occasion when the rainfall accumulated within a 3-day period was 20 mm or more. Various authors have used similar criteria in assessing the SOS (Stern et al. Reference Stern, Dennett and Dale1982; Barron et al. Reference Barron, Rockström, Gichuki and Hatibu2003; Diga Reference Diga2005). Since the study area exhibits a bimodal rainfall pattern (short rain during March–May and long rains during June–September), March 1 was picked as the earliest possible planting date for the study area (Diga Reference Diga2005). Accordingly, the potential starting date of the growing season was defined as the first occasion from 1 March that has at least 20 mm within a 3-day period. The risk of failure in crops planted early was assessed by adding a caveat, i.e. the potential starting date of the growing season was not followed by a dry spell of 10 or more days in the first 30 days after planting.
The EOS is mainly dictated by stored soil water and its availability to the crop after the rainfall stops. Stern et al. (Reference Stern, Dennett and Dale1982) defined the end of the season as the first date on which soil water is depleted. In the present study, the end of the rainfall season was defined as any day after 1 September when the soil water balance reaches zero.
Dry spell analysis
Daily rainfall data for each meteorological station were fitted to a simple Markov chain model. The chance of rain was assessed both when the previous day was dry, i.e. the chance that a dry spell would continue, and also when the previous day was rainy, i.e. the chance that a rainy spell would continue, which is known as a Markov chain (Stern et al. Reference Stern, Rijks, Dale and Knock2006; Stern & Cooper Reference Stern and Cooper2011). The probability of dry spell lengths of 5, 7, 10 and 15 days during the growing season were determined from the Markov chain model to obtain an overview of dry spell risks during the crop growing period.
Crop water satisfaction index
WRSI is an indicator of crop performance based on the availability of water to the crop during a growing season. It is crop-specific and indicates the extent to which the water requirements of a given crop have been satisfied during the growing stages. The water requirement of a crop during the growing season is calculated by multiplying the potential evapotranspiration (PET) and a crop-specific coefficient (K c). PET was calculated from temperature, relative humidity, wind speed and sunshine hours using the FAO Penman–Monteith equation (Allen et al. Reference Allen, Pereira, Raes and Smith1998). The WRSI was then determined using a water balance approach (Frere & Popov Reference Frere and Popov1979; Stern et al. Reference Stern, Dennett and Dale1982). The WRSI starts with a value of 100% at the start of the growing season, whereas water deficit and water excess reduce WRSI. Initial soil water could contribute to the WRSI at the beginning of the season, but such information is often not available. The WRSI decreases in two ways (Stern et al. Reference Stern, Rijks, Dale and Knock2006). First, if there is a water surplus of >100 mm, then the index is reduced by 3 units (a surplus poses negative influence on the crop performance by 3% for each 100 mm of excess water). Secondly, if there is a deficit, the index is reduced by the percentage of this deficit in relation to the total water requirements for the season. Values of WRSI between 50 and 100% imply conditions ranging from severe stress (at the lower end) to conditions with adequate moisture to avoid crop stress, whereas values of WRSI below 50% indicate crop failure due to severe moisture stress (Martin et al. Reference Martin, Washington and Downing2000).
Future climate scenario analysis
Projected changes in rainfall and temperature were analysed based on eight combinations of four general circulation models (GCMs) and two IPCC SRES emission scenarios, A2 and B1. The A2 represents one of the high emission scenarios, while B1 belongs to the low emission variants (Nakicenovic & Swart Reference Nakicenovic and Swart2000). The GCMs used were the Hadley Centre Coupled Model Version 3 (HadCM3), Commonwealth Scientific and Industrial Research Organization Global Climate Model mark 2 (CSIRO2), the Canadian Global Climate Model Version 2 (CGCM2) and Parallel Climate Model (PCM). Climate change scenario data of these GCM-SRES combinations was extracted from the TYN CY 3.0 data set of the Tyndall Centre for Climate Change (Mitchell et al. Reference Mitchell, Carter, Jones, Hulme and New2004). The Tyndall Centre for climate change offers country basis data on changes per month (precipitation in mm; temperature in °C) at the end of the 21st century (2071–2100) relative to a baseline period (1961–90). Future climate time series were constructed using the delta change method (Fowler et al. Reference Fowler, Blenkinsop and Tebaldi2007), which involves perturbing observed climate time series by mean changes (differences or ratios of changes) simulated with GCMs. The delta method was used for each specific month for rainfall and temperature, to consider seasonal differences in climate change. For temperature, the same delta was applied to minimum and maximum temperatures. Changes in rainfall and temperature for the 2080s relative to the current baseline period (1971–90) were determined, based on outputs from the GCMs and the observed climate data of the meteorological stations used for this analysis.
RESULTS
Rainfall variability and trends
The spatial distribution of rainfall in the CRV is shown in Fig. 1. A large part of the valley floor receives <800 mm per year. The north-west and south-east escarpments receive >1100 mm per year. The annual weighted average rainfall in the CRV is 894 mm with a standard deviation of 98 mm.
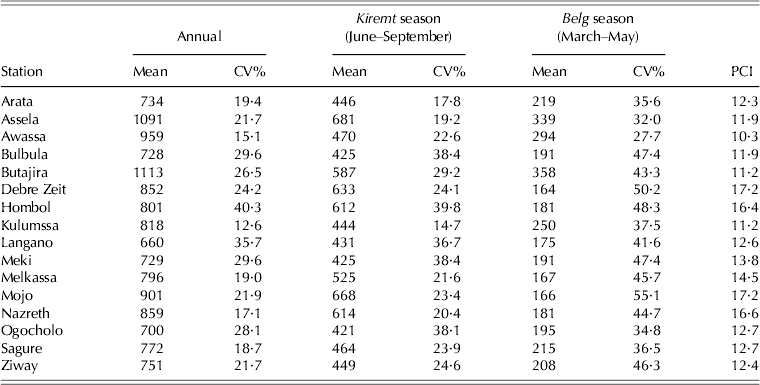
The mean annual rainfall across the 16 stations ranged from 660 mm (Langano) to 1113 mm (Butajira) (Table 2). Most of the stations showed moderate variation in annual rainfall (CV% 20–30) except for two stations (Langano and Hombol), which had higher variations (CV% >30). The PCI value is >11% for most of the stations and highlights the seasonality in rainfall distribution. Normalized RA index calculated for a period of 31 years (1977–2007) for all stations (not shown here) also indicate that the annual rainfall of CRV generally exhibits cyclic wet and dry conditions with negative anomalies for 35% of the years.
Annual and seasonal rainfall (mm), CV% and PCI for representative meteorological stations in and around the CRV in Ethiopia
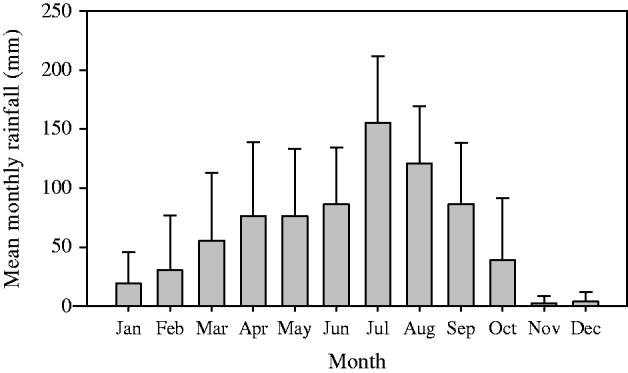
Ziway station was selected as an example to illustrate the monthly rainfall distribution (Fig. 2). The mean monthly rainfall for this station varies from 2·3 mm for the driest month (November) to 155·3 mm for the wettest month (July). Approximately 60% of the total annual rainfall at Ziway is received during 4 months (June–September) and 37% of this amount is concentrated in July and August. The normalized RA calculated for Ziway station indicates that 55% of the past 40 years exhibited negative anomalies and the frequency of negative anomalies increased during recent years.
Monthly rainfall distribution with standard deviations for the period 1970–2009 at Ziway station in the CRV.
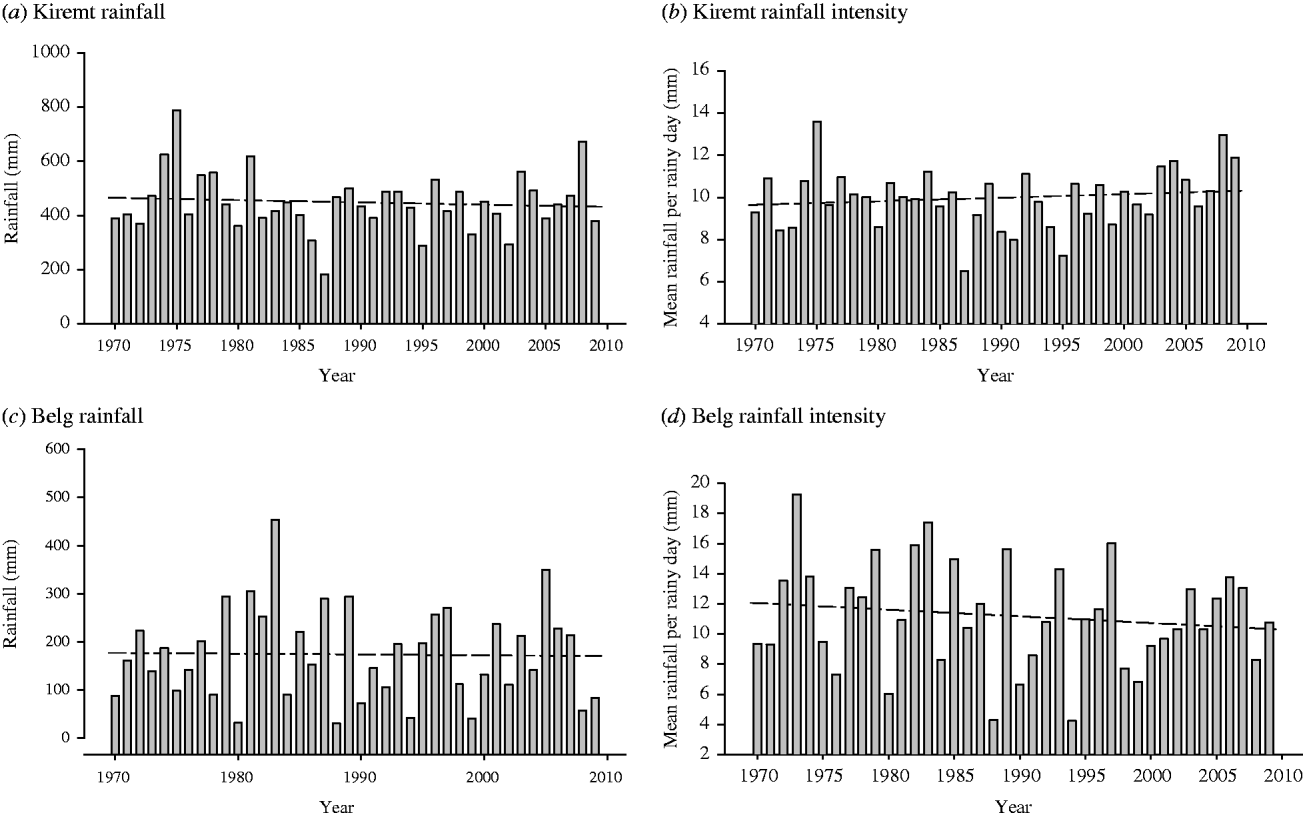
Analyses for the seasonal rainfall of the selected stations indicate that rainfall during the growing season in the CRV generally exhibits high intra-seasonal variability. In the Belg season, total rainfall varies from 175 to 358 mm (CV% 32–55), whereas that for the Kiremt season varies from 420 to 680 mm (CV% 15–40). Both the Belg and Kiremt rainfall show either zero or just a slight, non-significant decline in rainfall over time (Figs 3a, c for Ziway). When analysing the number of rainy days and the daily rainfall intensity index (mean rainfall per rainy days), the result indicates that in the Kiremt season rainy days vary from 29 to 68 days with an average of 51 days per season (CV% 17). In the Belg season, the number of rainy days varies from 7 to 37 days per season with an average of 22 days (CV% 33). The daily rainfall intensity (mean rainfall per rainy days) in the Kiremt ranges from 5·9 to 17·1 mm/day with an average of 9·7 mm/day (Figs 3b, d for Ziway station). The daily rainfall intensity during the Belg varies from 4·5 to 16·4 mm/day with an average value of 10 mm/day. The daily rainfall intensity showed a slight increase over time during the Kiremt (Fig. 3b for Ziway), whereas it decreases during the Belg (Fig. 3d) but neither trend was significant.
Seasonal rainfall variability and trends for the period 1970–2009 at Ziway station, CRV, Ethiopia: (a) the mean annual rainfall for the Kiremt (June–September) season; (b) the mean rainfall per rainy day (daily rainfall intensity) for the Kiremt; (c) the mean annual rainfall for the Belg (March–May) season; (d) the mean rainfall per rainy day (daily rainfall intensity) for the Belg season. Both seasons show a slight decline in rainfall amount but trends are not statistically significant. The mean daily rainfall intensity is increasing for the Kiremt and decreasing for the Belg.
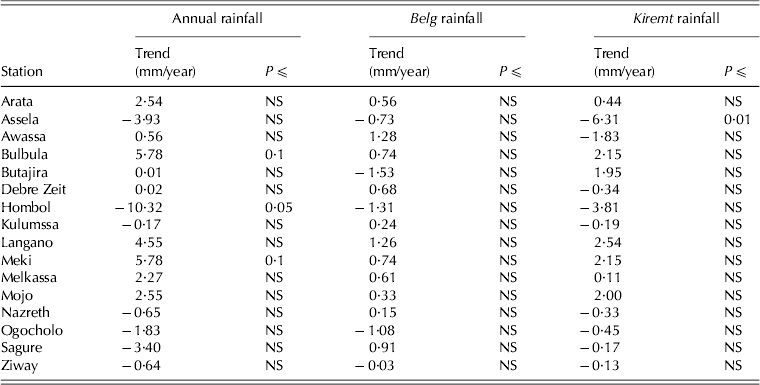
Table 3 presents Sen's slope estimates and Mann–Kendall trend test results for the annual and seasonal rainfall of representative stations in the CRV. The annual rainfall shows negative trends in seven and positive trends in nine out of the 16 stations. The Belg rainfall exhibits negative trends in five stations and positive trends in 11 of the 16 stations. The Kiremt rainfall shows negative trends in nine stations and positive trends in six stations. However, the Mann–Kendall trend test result showed that for most of the stations, trends of the annual and seasonal rainfall are not statistically significant. The area weighted mean annual rainfall (not shown here) also indicates an insignificant declining trend during the period 1977–2007 (trend = −0·4).
Mann–Kendall trend test result for the annual and seasonal rainfall of representative stations of the CRV, Ethiopia. The seasonal rainfall refers to the short rainy season locally known as Belg (March–May) season and the main rainy season known as Kiremt (June–September)
Temperature variability and trends
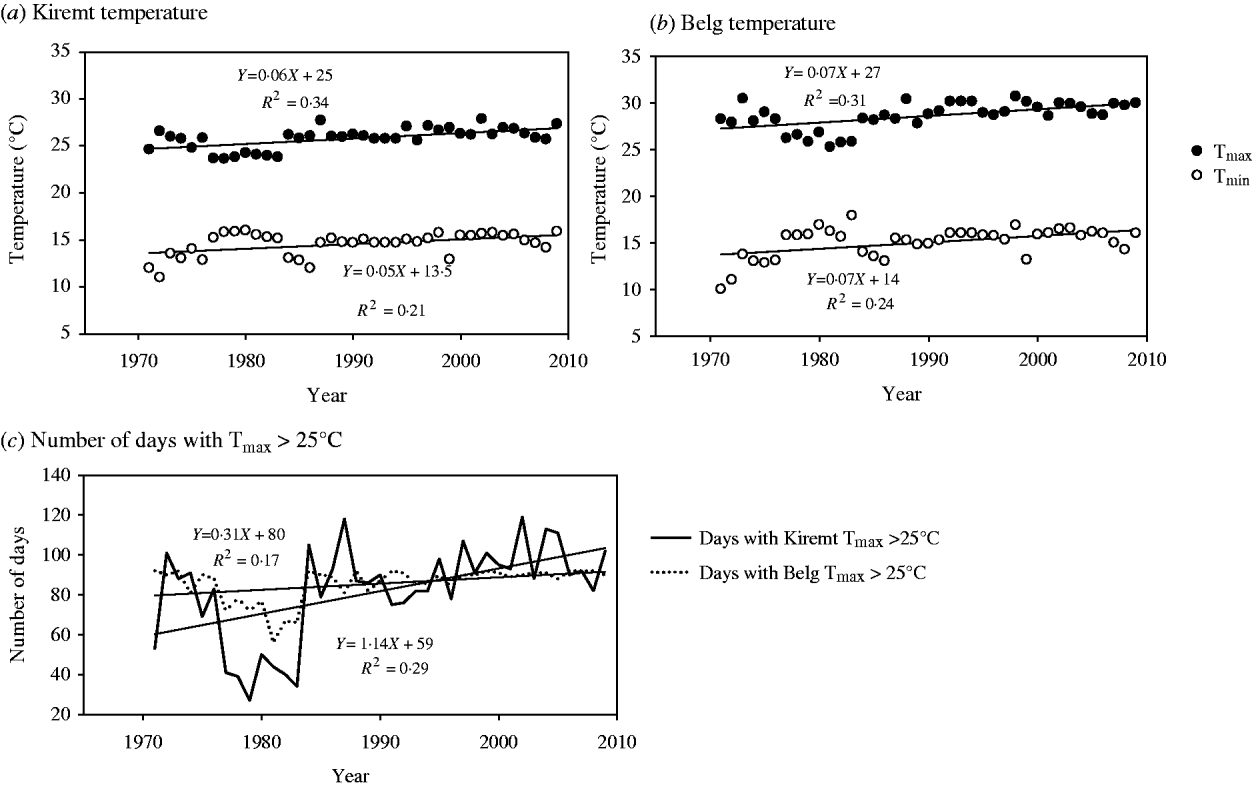
The annual mean temperature in the CRV is 18·9 °C. The annual mean minimum and maximum temperatures are 12 and 26 °C, respectively. For the Belg, the minimum temperature ranges from 11 to 15 °C and the maximum temperature varies from 25 to 29 °C. The Kiremt season has minimum temperatures of 10–14 °C and maximum temperatures of 22–26 °C. Temperature characteristics are illustrated for Ziway station in Fig. 4.
Time series and trends for minimum and maximum temperatures during the Kiremt (June–September) and Belg (March–May) at Ziway, CRV, Ethiopia: (a) the daily minimum (Tmin) and maximum (Tmax) temperatures for the Kiremt; (b) the daily minimum (Tmin) and maximum (Tmax) temperatures of the Belg; (c) the number of days with daily maximum temperature (Tmax) exceeding 25 °C (summer days) for both seasons.
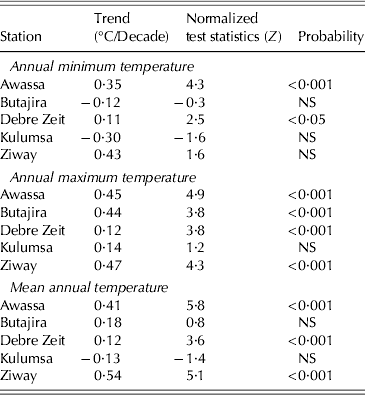
Trends of annual minimum, maximum and mean temperature and Mann–Kendall test results are presented for five representative stations in Table 4. The annual minimum temperature significantly increases in Awassa and Debre Zeit and the maximum temperature significantly increases in Awassa, Debre Zeit, Butajira and Ziway. The mean annual temperature generally shows a warming trend ranging from 0·12 to 0·54 °C per decade.
Trends of annual minimum, maximum and mean temperature and Mann–Kendall test result for trends at reference stations in the CRV, Ethiopia. Positive values of normalized test statistics (Z) indicate an increasing trend and negative Z values indicate decreasing trends
On a seasonal basis, the Belg minimum temperature increases with 0·1–0·5 °C and the maximum temperature with 0·1–0·6 °C per decade. Trends are statistically significant in Awassa and Ziway (P < 0·05). The Kiremt minimum temperature increased by 0·2–0·4 °C per decade and its maximum temperature by 0·2–0·5 °C per decade. Extreme temperature events, i.e. lowest and highest daily minimum and maximum temperatures indicate a significant increase (results not shown). The number of days with maximum temperature >25 °C (summer days) also increased (Fig. 4c for Ziway station).
Characteristics of the growing season
SOS and EOS
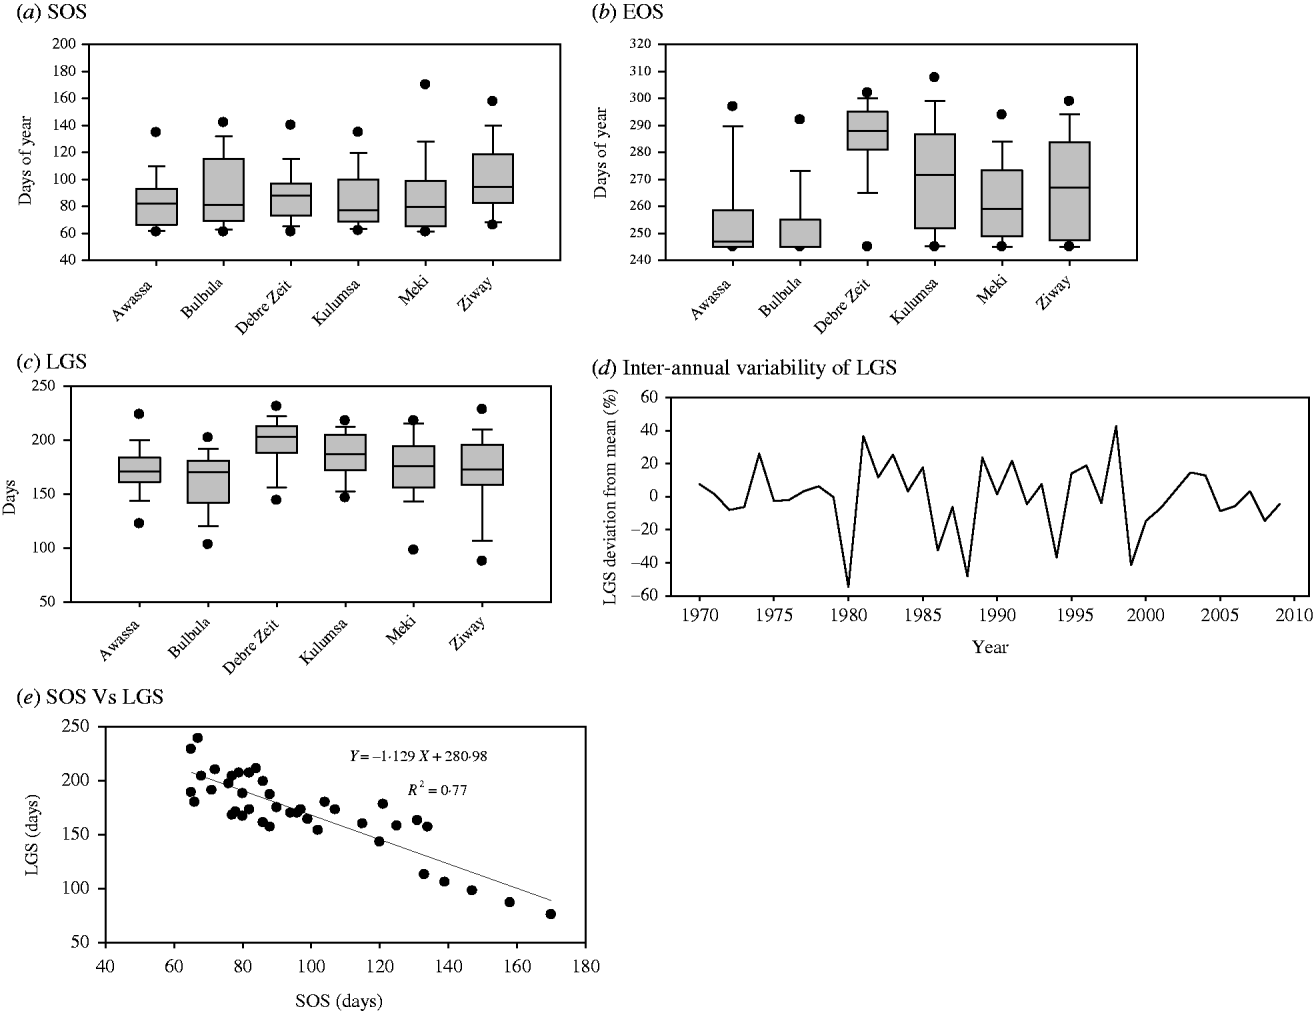
Figures 5(a) and (b) present the inter-annual variability of the start and EOS for six stations in the CRV. The mean potential onset date of the growing season in the CRV ranged from Julian day number 86–101 (i.e. 26 March–10 April). The CV for the start of the season (SOS) ranged from 24 to 33%. The earliest potential onset date of the growing season is day 66 (6 March) and the latest is day 184 (2 July).
Characteristics of the growing season in the CRV. The Box and whisker plots in (a–c) depicts the start of the season (SOS, end of the season (EOS and length of the season (LGS), respectively, for representative stations (Awassa, Bulbula, Debre Zeit, Kulumsa, Meki and Ziway). Boxes indicate the lower and upper quartiles. The solid line within the box is the median. Whiskers indicate the minimum and maximum values and dots are outliers; (d) shows the year to year variability of LGS at Ziway presented in terms of percentage of deviation from the mean (anomalies); (e) indicates the relation between LGS and start of the season for Ziway station.
The mean end date of the growing season (EOS) for the study area ranged from days 253 to 286 (9 September–12 October) with a CV of 5–7%. The earliest possible end date of the growing season is day 245 (1 September).
Analysis of the risk of failure in early planting due to false start of the rainfall season (not shown here) indicates that at Ziway, the first planting was not successful in 65% of the 40 years. The extra time before a successful planting had a mean of 26 days with a standard deviation of 27 days.
Length of growing season
The mean LGS of six stations in the study area ranged from 161 to 197 days (CV% 13–21) (Figs. 5c and d). The s.d. for the length of the growing season is 24–35 days. The inter-annual variability of LGS is illustrated for Ziway station in Fig. 5d. Some of the years in Ziway had a short growing season and some had extended growing seasons. Statistically, it varies from a minimum of 76 days to maximum of 239 days.
The LGS is highly correlated with the starting date of the growing season (r = 0·7–0·9). For instance, 77% of the variability in length of the growing season at Ziway is explained by the starting time of the growing season (Fig. 5e). Weak correlations exist between start and end date of the season as well as between LGS and end date of the season (r < 0·5).
Crop water requirement satisfaction index
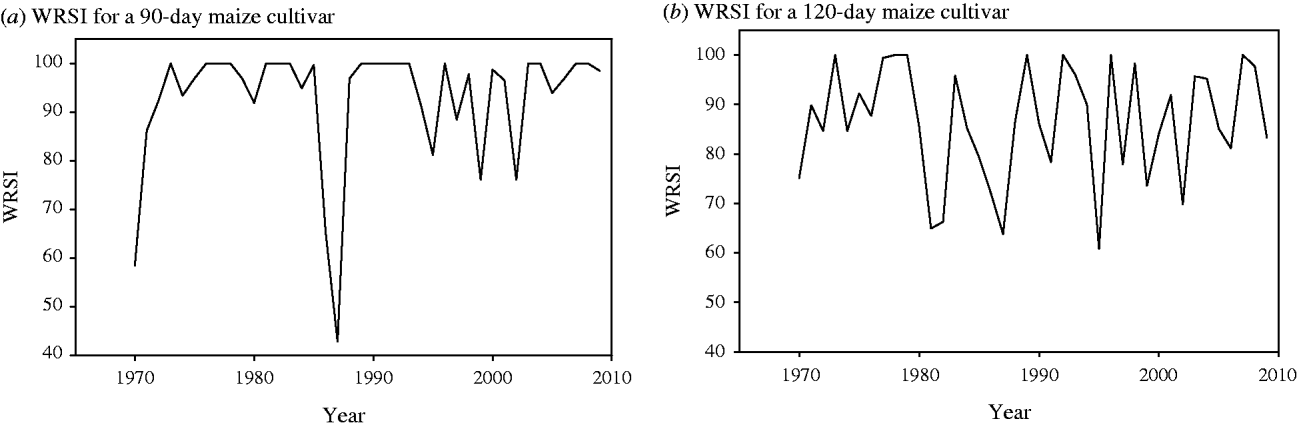
Figures 6(a) and (b) present the seasonal WRSI for a 90-day and 120-day maize cultivar at Ziway between 1970 and 2009. The WRSI for a 90-day-maize cultivar varies from 76 to 100% except for 3 years (1970, 1986 and 1987). The exceptionally low values in these 3 years were due to the early termination of rain and long dry spells during the growing season. The index was <100% in 55% of all seasons analysed. For a 120-day maize cultivar, the index varies from 64 to 100% and in 83% of the seasons the WRSI was <100%. Index values lower than 100% generally indicate inadequate rainfall during the growing season.
WRSI: (a) for a 90-day maize cultivar and (b) for a 120-day maize cultivar at Ziway in the CRV of Ethiopia. The WRSI indicates the extent to which the water requirements of a given crop have been satisfied during its growth cycle.
Dry spells during the growing season
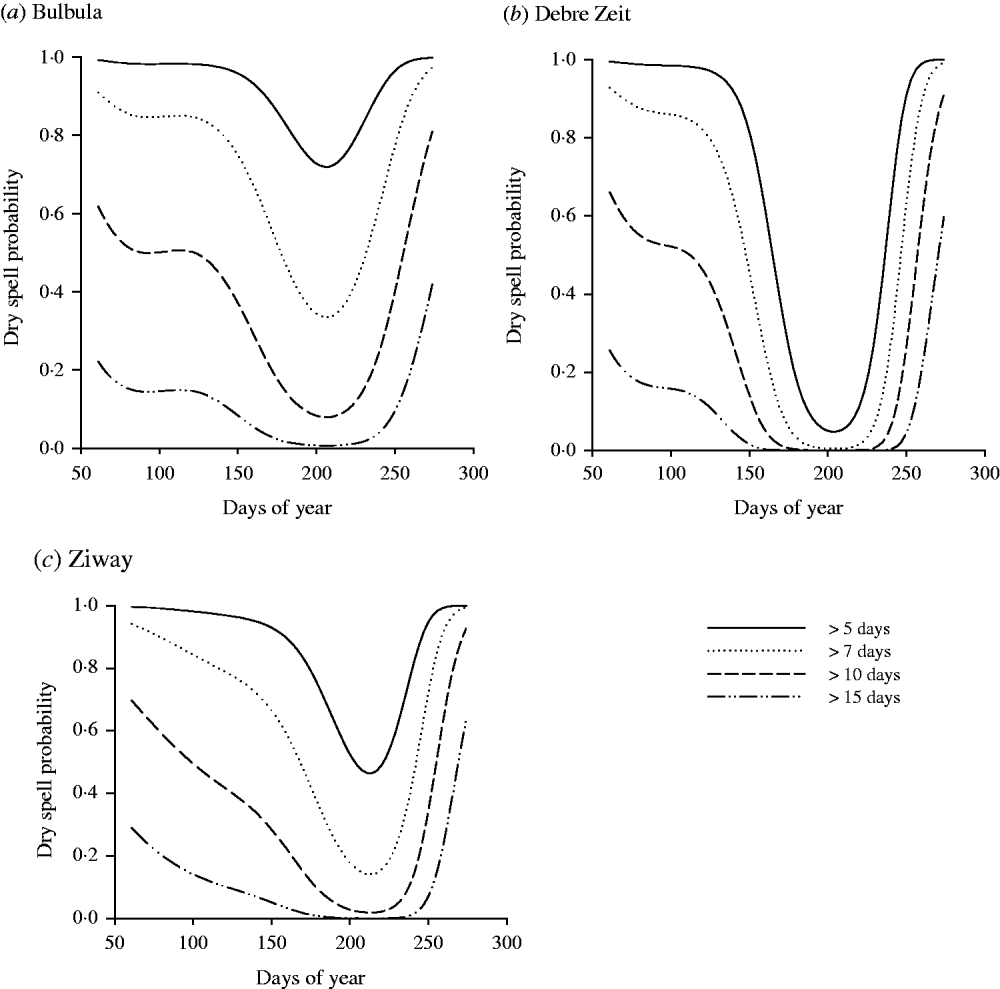
For three selected stations, the probability of occurrence of longer dry spells (longer than 15 days) is 0·2 in March and decreases to 0 from middle to the end of June and increases again after the end of August (Fig. 7). The probability of dry spells of 5 and 7 days is 1 during the earlier months. All dry spell probability curves converge to their minimum during the peak rain season (Days 184–244) and increase again around September (Days 245–274), signalling the end of the growing season. In general, the Belg has higher probability of dry spells than the Kiremt.
Probability of dry spells longer than 5, 7, 10 and 15 days length during the growing season for three stations (Bulbula, Debre Zeit and Ziway) of the CRV.
Future climate scenarios
Projected changes in rainfall
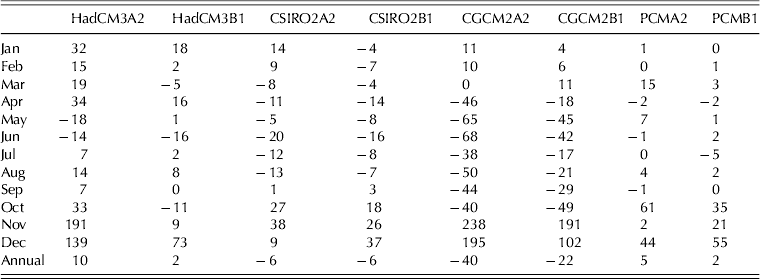
Projections based on eight combinations, i.e. four GCMs with two IPCC emission scenarios, suggested that the annual and seasonal rainfall will probably decline by 2080 relative to the current baseline (1971–90). The range of projected rainfall changes is presented for Ziway station in Table 5. The change in annual rainfall range from +10% (by HadCM3A2) to −40% (by CGCM2A2). The most relevant months from the point of view of rainfed crop production (i.e. March–September) showed declining rainfall in most projections. The Kiremt rainfall shows an extremely wide range of projected changes from −20% (by CSIRO2) to −68% (by CGCM2A2). The rainfall change for the Belg season is also extremely wide from −18% (by HadCM3) to −65% (by CGCM2). A substantial increase in rainfall is expected for those months that are less relevant for agriculture (November–December).
Ranges of percentage changes in monthly and annual rainfall as projected by different General Climate Models (GCMs) for two emission scenarios for the 2080s relative to the baseline period (1971–90) at Ziway station, CRV, Ethiopia
Note: the combination CGCM2A2, for example, is composed of the GCM named CGCM2 and emission scenario A2.
The GCM projections suggest that the LGS will vary in the range of +16 to −35% by 2080 relative to the current climatic conditions (Table 6). Highest changes are projected by the CGCM2 model for A2 emission scenario, showing a decline of the LGS by 22% at Ziway, 35% at Debre Zeit and 12% at Kulumsa.
Projected percentage change in LGS for three representative stations of the CRV, Ethiopia, based on the combination of four GCMs and two emission scenarios by the 2080s relative to the current baseline period (1971–90); GCM-emission scenario combinations as in Table 5

Projected changes in temperature
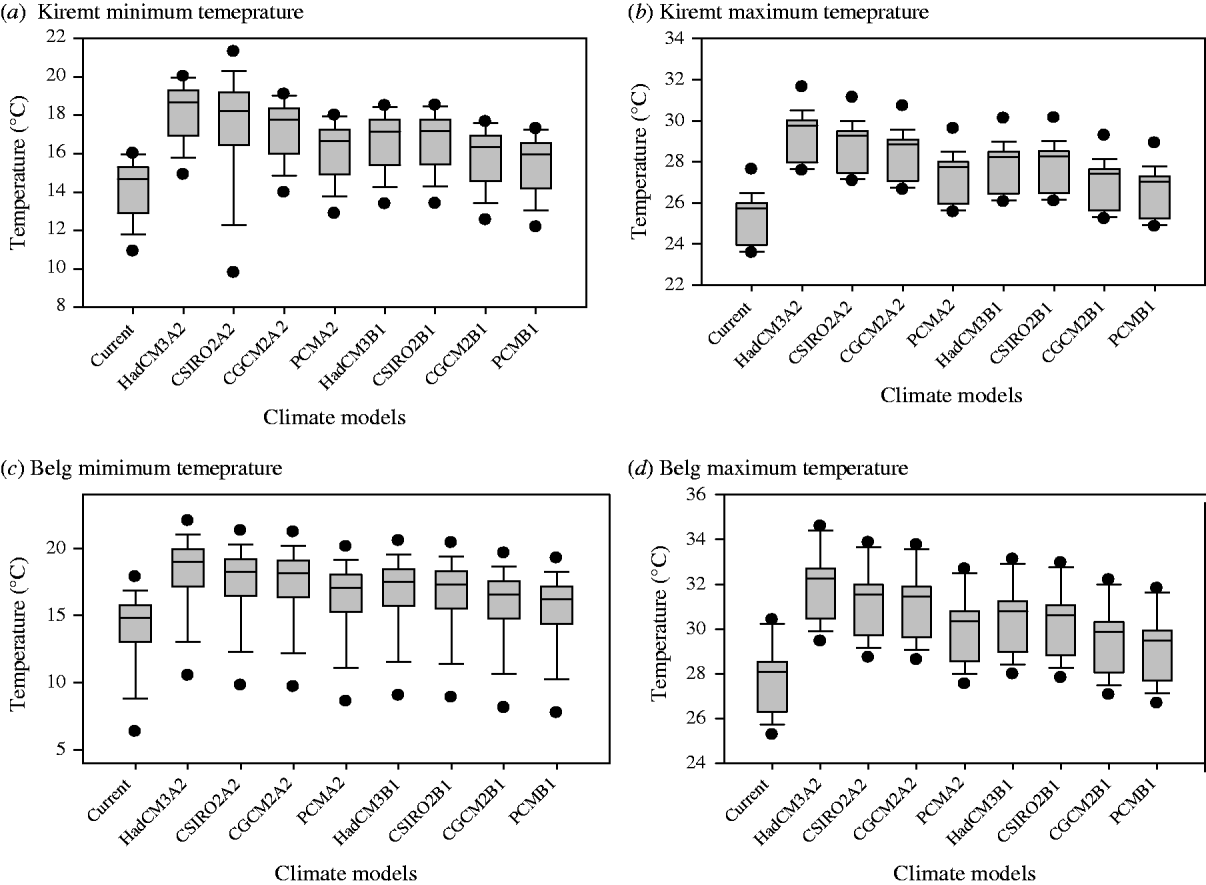
All four GCMs under the two emission scenarios suggested an increasing trend in temperature. For Ziway, the Kiremt maximum temperature is expected to increase in the range of 2–4 °C under the A2 scenario and 1·3–2·5 °C for the B1 scenario (Fig. 8). The Kiremt minimum temperature is also expected to increase by 2–4 °C under the A2 scenario and by 1·2–2·4 °C under the B1 scenario. For the Belg, the maximum temperature is expected to increase by 2·3–4·2 °C under the A2 scenario and 1·8–2·7 °C under the B1 scenario and the minimum temperature is expected to increase by 2·3–4·2 °C (A2 scenario) and 1·4–2·7 °C (B1 scenario).
Box and whisker plots of the minimum and maximum temperatures projected under the A2 and B1 emission scenarios and four climate models by the end of the century relative to the current base period (1971–90). Lower and upper boundaries of the boxes indicate the 25th and 75th percentiles, respectively. A line within the box marks the median. Whiskers above and below the box indicate the 90th percentiles. Dots are outliers with criteria of 5th and 95th percentiles. GCM2 is a climate model from the Canadian Centre for Climate Modelling and Analysis, Canada; CISRO2 is the Australian Common Wealth Scientific and Industrial Organization, Australia; HadCM3 is the Hadley Centre for Climate Prediction and Research, UK; PCM is Parallel climate model of the National Centre for the Atmospheric Research, USA. A2 and B1 indicate the mid-range and low emission scenarios of the IPCC (Mitchell et al. Reference Mitchell, Carter, Jones, Hulme and New2004; Meehl et al. Reference Meehl, Stocker, Collins, Friedlingstein, Gaye, Gregory, Kitoh, Knutti, Murphy, Noda, Raper, Watterson, Weaver, Zhao, Solomon, Qin, Manning, Chen, Marquis, Averyt, Tignor and Miller2007). The models represent moderate-(+2·5 °C)-to-high (+4 °C) global warming estimates for the end of the century.
DISCUSSION
Current climate and its implication for rainfed crop production
The analysis on long-term rainfall data for the CRV showed large inter-annual and season-to-season variation in the amount and distribution of rainfall. The analysis of trends revealed that the growing season rainfall generally exhibited a slight but statistically insignificant decline. A decrease in the number of rainy days with an increase in the mean rainfall per rainy day has been observed over the past few decades, signifying an increase in the intensity of rainfall, particularly for the Kiremt. The trends observed are, however, not statistically significant. This result is in agreement with other studies in parts of the country. For instance, Cheung et al. (Reference Cheung, Senay and Singh2008) found a decline in the Kiremt rainfall for watersheds located in the south western and central parts of the country, but their observed changes were also not statistically significant for any of the watersheds examined. Osman & Sauerborn (Reference Osman, Sauerborn and Deininger2002) also found negative anomalies with Kiremt rainfall frequently being lower than the long-term average for the north-central highlands of Ethiopia. Despite the absence of significant trends in rainfall patterns, the high inter-annual variability and season to season variation implies a challenge to rainfed agriculture. The declining trend in Kiremt rainfall and increase in daily rainfall intensity disadvantages rainfed crop production. Various studies indicate that the amount and temporal distribution of rainfall is generally the most important determinant of inter-annual fluctuations in crop production in Ethiopia and has been reported to have significant effects on the country's economy and food production for the last three decades (World Bank 2006; Bewket & Conway Reference Bewket and Conway2007; Hellmuth et al. Reference Hellmuth, Moorhead, Thomson and Williams2007; Araya & Stroosnijder Reference Araya and Stroosnijder2011; Conway & Schipper Reference Conway and Schipper2011; Demeke et al. Reference Demeke, Keil and Zeller2011). Large variability of Belg rainfall already makes this season unsuitable for rainfed agriculture (Rosell Reference Rosell2011). Higher rainfall intensities during the main rainy season could increase the rate of erosion and loss of nutrients from arable soils, thereby reducing soil fertility (Yengoh et al. Reference Yengoh, Armah, Onumah and Odoi2010) and consequently impacting on crop productivity.
The length of the growing season and its reliability (Jaetzold & Kutsch Reference Jaetzold and Kutsch1982) determines the suitability of crops and cultivars that can be cultivated in a given area and is an important indicator of yield potential. The length of the growing season in the CRV exhibits a high inter-annual variability with slight declining trend. The onset date of the growing season shows a trend towards late starting. With a high correlation between the starting date of the growing season and length of the growing season, delay of the onset implies a shortened growing period leading to low crop productivity. Earlier studies have also provided evidence that uncertainty of the growing season is one of the main challenges for rainfed crop production. World Bank (2006), for instance, reported that the late start of the Kiremt in 1997 caused a reduction in average yield of cereals by 10% across Ethiopia. Camberlin & Okoola (Reference Camberlin and Okoola2003) observed a reduction of 25–30% in maize yield in Kenya due to a 20-day delay of the main rainfall season. The CRV is further characterized by intermittent dry spells with higher probabilities of occurrence during the growing season. Most of the crops cultivated in the CRV are most likely to be exposed to moisture stress. For instance, at Ziway, there is a chance of 26% of getting dry spells of longer than 7 days at the early growth stage of a crop and the probability is higher (92%) during the late development stage of the crop. Earlier studies by Segele & Lamb (Reference Segele and Lamb2005) and Araya & Stroosnijder (Reference Araya and Stroosnijder2011) also indicate that dry spells of c. 10 days are among the major causes of crop failure in rainfed farming systems of Ethiopia. Araya & Stroosnijder (Reference Araya and Stroosnijder2011) indicate that 20% of crop failure in drought-prone parts of Ethiopia is due to dry spells during the growing season. In general, the Belg has higher probability of dry spells than the Kiremt. This may be because Belg rainfall is influenced much more by cyclonic activity than the Kiremt period and negative anomalies in sea surface temperature (SST) are strongly associated with rainfall deficiency in the Belg season (Seleshi & Camberlin Reference Seleshi and Camberlin2006).
The WRSI calculated for 90-day and 120-day cycled maize cultivars indicates that the effective rainfall available during the growing season is not sufficient for maximum production of crops in most of the seasons. Crops, particularly long-cycle varieties, experience water stress during the growing season and farmers need to shift to short-cycle crops as long as rainfall is the only source of water for crop production. The analysis provides an indication for the necessity of improved farm management practices to support production of short cycled varieties.
The inter-annual and intra-seasonal rainfall variability in the CRV is accompanied by a significant warming trend in temperature, which can add stress to crop growth during periods of already high temperatures. The mean annual temperature increased in the range of 0·12–0·54 °C per decade during the study period. Previous studies also indicate that warming has occurred across Ethiopia (Conway Reference Conway2000; Boko et al. Reference Boko, Niang, Nyong, Vogel, Githeko, Medany, Osman-Elasha, Tabo, Yanda, Parry, Canziani, Palutikof, van der Linden and Hanson2007; NMA 2007), particularly since the 1970s, at variable rates but broadly consistent with global and African trends. It was indicated by NMA (2007) that between 1960 and 2006, the mean annual temperature has increased at an average rate of 0·2 °C per decade. The warming trend imposes its impact on crop production by raising the evaporative demand, particularly in regions such as the CRV where rainfall is already scarce. Reduced growing season rainfall with high evaporative demand will increase the risks of low yields in rainfed crop production.
Projected climate change and possible implications
Projection of future rainfall conditions suggest that the annual and seasonal rainfall in the study area is most likely to decrease. Associated with the declining trends in seasonal rainfall, the growing season in the CRV is also predicted to be shortened. Other reports on future rainfall projections for Ethiopia support the present results. For instance, Arndt et al. (Reference Arndt, Robinson and Willenbockel2011) indicate that the Kiremt rainfall will decline by 20% and the Belg rainfall will decline by 5–6% by the 2080s relative to the 1960–90 period. Thornton et al. (Reference Thornton, Jones, Owiyo, Kruska, Herrero, Kristjanson, Notenbaert, Bekele, Omolo, Orindi, Otiende, Ochieng, Bhadwal, Anantram, Nair, Kumar and Kulkar2006) reported that in many of the regions across Africa including Ethiopia, there will be little to moderate reduction in the length of the growing period (<20%) and in other parts the reduction will be more severe (>20%). The present analysis for future temperature also revealed that the warming trend will continue and the annual temperature is expected to increase in the range of 1·4–4·1 °C by the end of the 21st century. This result is consistent with reports for other countries as well as global projections. For Ethiopia, NMA (2007) reported that the annual temperature is expected to increase in the range of 2·7–3·4 °C by the 2080s compared with the 1961–90 base period. For global scale projection, the Fourth IPCC assessment report suggested an increasing trend of temperature in the range of 1·5–4·5 °C by the end of the century (Meehl et al. Reference Meehl, Stocker, Collins, Friedlingstein, Gaye, Gregory, Kitoh, Knutti, Murphy, Noda, Raper, Watterson, Weaver, Zhao, Solomon, Qin, Manning, Chen, Marquis, Averyt, Tignor and Miller2007).
The present study used a delta change approach which assumes that the behaviour of current climate variability stays the same in the future. However, such an assumption may not be true as climatic extremes (e.g. heat waves; high-intensity rainfall) are expected to become more frequent and severe under a changing climate. However, climate models (both GCMs and RCMs) still have a number of deficiencies that make projections, especially those on changes in variability, quite uncertain, even in well-studied European regions as shown by Boberg & Christensen (Reference Boberg and Christensen2012). Future progress in dynamic downscaling combined with improvements of stochastic weather generators, calibrated for the region, and their application will allow examination of what the effects of plausible changes in extreme events under future climates would be. Considering this limitation, the analysis on projected rainfall and temperature changes provides indication that rainfed crop production in the CRV, which is already affected by current climate variability, is most likely to be further challenged under the changing climate. The projected decline in growing season rainfall and the continuing warming trend will further increase moisture stress in the future. Several climate change impact studies revealed that there could be considerable yield reduction, particularly in Sub-Saharan countries including Ethiopia. Parry et al. (Reference Parry, Rosenzweig, Iglesias, Livermore and Fischer2004), for instance, reported that cereal yields in east Africa will decline by 5–20% by the 2080s and NMSA (2001) reported a decrease in wheat yield of 24–33% in Ethiopia by 2080.
CONCLUSIONS
Past and future trends in inter-annual and inter-seasonal rainfall variability, declining rainfall amount, variability in the length of the growing seasons and in-season dry spells together with increasing temperature generally indicate an increasing risk for rainfed crop production in the CRV. However, the severity of risk varies spatially and depends on the climate change scenario, whereby some of them also show a reduced risk. Shorter growing seasons due to a delayed start of rainfall hampers soil preparation and exposes crops to increased terminal moisture stress during grain filling, reducing crop yields. Increased rainfall intensities can cause increased soil erosion and losses of nutrients from arable soils impacting crop production. The increasing temperature will increase the rate of evapotranspiration and crop water requirements, adding to the currently frequent water stress of crops. Rainfed crop production in the CRV, which is already impacted by the current climate variability, is likely to be further challenged with future climate change. As a consequence, specific impact-based adaptation strategies are essential to reduce the vulnerability of rainfed crop production in the CRV.
The authors acknowledge the National Meteorological Agency (NMA) of Ethiopia for providing climate data and Amhara Regional Agricultural Research Institute (ARARI) for support in obtaining the climate data from NMA. Thanks to Stefan Fronzek and Nina K. Virtanen (Finnish Environment Institute, Helsinki) for their support in obtaining climate scenario data from the TYN CY 3·0 data set. We thank Yared Assefa (Kansas State University, USA) for his support in statistical analysis and Karoliina Rimhanen (MTT Agrifood Research Finland) for providing supplementary data. Authors are grateful to the Academy of Finland (Decision no. 127405) for funding this research as part of the AlterCLIMA project.