Implications
CLA c9, t11-18:2 has been shown to be beneficial to human health, and its concentration in milk of dairy cows was increased when cows were grazed on fresh pasture compared with receiving conserved feeds. The increase was not explained by more production in the rumen, but likely because of increased synthesis in the mammary gland.
Introduction
C9, t11-18:2 is the most abundant isomer of CLA in milk of dairy cows, and because of its health benefits to humans, various feeding strategies have been studied for their effect on the content of the fatty acid in milk (Palmquist et al., Reference Palmquist, Lock, Shingfield and Bauman2005). Grazing (Kelly et al., Reference Kelly, Kolver, Bauman, VanAmburgh and Muller1998; Dhiman et al., Reference Dhiman, Anada, Satter and Pariza1999; Schroeder et al., Reference Schroeder, Delahoy, Vidaurreta, Bargo, Gagliostro and Muller2003) is one of the most effective approaches identified for increasing CLA, compared with feeding stored feeds, the most common practice in the modern dairy industry.
Understanding the origin of milk CLA is important, and sources include both ruminal synthesis and endogenous contributions (Palmquist et al., Reference Palmquist, Lock, Shingfield and Bauman2005). Ruminal synthesis is a result of partial biohydrogenation of 18:2n-6 and 18:3n-3. The biohydrogenation of 18:2n-6 initiates with isomerization of c9, c12-18:2 into c9, t11-18:2, the primary isomer of CLA, as the first intermediate (Kepler et al., Reference Kepler, Hirons, McNeill and Tove1966). The subsequent step is reduction of the cis-9 double bond, resulting in t11-18:1 as the second intermediate. The final step is another reduction, resulting in 18:0. The rumen bacterium Butyrivibrio fibrisolvens is the primary species that carries out the isomerization and the first reduction step (Kepler et al., Reference Kepler, Hirons, McNeill and Tove1966). Bacteria that carry out the last reduction are separate species, including some Fusocillus and Ruminococcus strains (Kemp et al., Reference Kemp, White and Lander1975). Formation of intermediates during biohydrogenation of 18:3n-3 is not well understood. The biohydrogenation pathway begins with isomerization of the double bond at carbon 12, forming a conjugated cis-9, trans-11, cis-15 triene (Kim et al., Reference Kim, Huws, Lee and Scollan2009). Hydrogen is subsequently added to the double bonds, likely in the order of carbon positions 9, 15 and 11 (Dawson and Kemp, Reference Dawson and Kemp1970). Loor et al. (Reference Loor, Herbein and Polan2002) reported distinct increases in t11, c15-18:2 in blood plasma and milk when cows were grazed compared with being fed a total mixed ration. However, no typical CLA would be formed with this 9>15>11 preference order (Jenkins et al., Reference Jenkins, Wallace, Moate and Mosley2008). Other preference scenarios are 9>11>15 and 15>9>11, with the latter being the one that would yield c9, t11-18:2 as an intermediate. However, such a preference order has not been documented (Dawson and Kemp, Reference Dawson and Kemp1970; Destaillats et al., Reference Destaillats, Trottier, Galvez and Angers2005). Observed increases in milk CLA when cows are grazed have not been well explained by ruminal biohydrogenation because the main fatty acid in grasses and clovers is 18:3n-3 (Palmquist, Reference Palmquist1988).
Endogenous synthesis is a result of Δ9 desaturation of t11-18:1 (Griinari et al., Reference Griinari, Corl, Lacy, Chouinard, Nurmela and Bauman2000; Morales et al., Reference Morales, Palmquist and Weiss2000). T11-18:1, derived from the rumen during biohydrogenation of 18:2n-6, as discussed above, can be desaturated as a result of the action of Δ9-desaturase (Palmquist et al., Reference Palmquist, Lock, Shingfield and Bauman2005; Mosley et al., Reference Mosley, Shafii, Moate and McGuire2006), forming c9, t11-18:2. The enzyme acts on the bond at carbon 9 in 16:0, 18:0 as well as t11-18:1 in the presence of NADPH, flavin and ferrous ion (Moore and Christie, Reference Moore and Christie1979).
The most recent studies have shown that endogenous synthesis contributes a large proportion of total CLA in milk, with estimates including 64 (Griinari et al., Reference Griinari, Corl, Lacy, Chouinard, Nurmela and Bauman2000), 78 (Corl et al., Reference Corl, Baumgard, Dwyer, Griinari, Philipis and Bauman2001), 94 (Kay et al., Reference Kay, Mackle, Auldist, Thompson and Bauman2004) and 93% to 97% (Piperova et al., Reference Piperova, Sampugna, Teter, Kalscheur, Yurawecz, Ku, Morehouse and Erdman2002; Mohammed et al., Reference Mohammed, Stanton, Kennelly, Kramer, Mee, Glimm, O’Donovan and Murphy2009), depending on diet composition, oil supplementation and grazing. However, reasons for increased synthesis with regimens that are known to be effective in increasing milk CLA remain unclear. The objective of this study was to determine the concentration of CLA in ruminal and omasal contents and in milk of cows fed conserved forages or pasture to gain insights into the mechanism of observed increases in milk CLA.
Material and methods
The experimental protocol was approved by the Institutional Animal Care and Use Committee of the College of Agricultural and Life Sciences, University of Wisconsin, Madison, United States of America.
Animals and dietary treatments
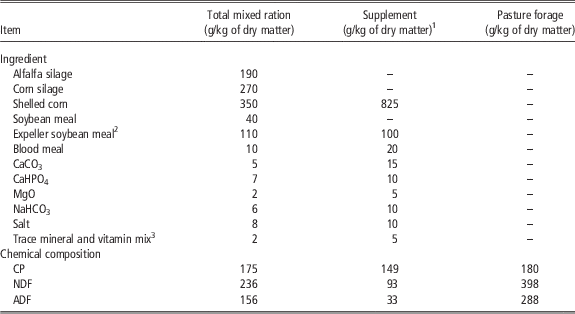
Eight ruminally cannulated multiparous Holsteins were paired based on milk yield and days in milk (ranging from 16 to 290) and utilized in a replicated crossover design in June to July. Cows within a pair were fed a total mixed ration consisting of alfalfa silage, corn silage and a concentrate mix (Table 1) or grazed for 21 days, and then switched to the other regimen for 21 more days. In each period, the first 14 days served as adaptation and the last 7 days for sample collection. Grazed cows were also offered a supplement mix at 10 kg/day (dry matter basis) using ingredients similar to those included in the concentrate portion of the total mixed ration for the other group of cows. The allowance was used to provide 40% of the total feed intake, assuming that animals would obtain 60% of their intake from the pasture based on previous season estimates (Wu et al., Reference Wu, Kanneganti, Massingill, Wiltbank, Walgenbach and Satter2001). The use of these values before the commencement of the experiment was necessary, but as reported below, the actual amount of the supplement consumed was less than offered.
Ingredients and composition of the total mixed ration, supplement and pasture forage

1 The supplement was offered to grazing cows at 10 kg/day (dry matter).
2 SoyPlus (West Central Coop; Ralston, IA, USA).
3 Each kilogram contained 0.32 g of Se, 0.43 g of Co, 1.03 g of I, 13.35 g of Cu, 23.99 g of Fe, 51.00 g of Mn, 62.01 g of Zn, 7,000,000 IU of vitamin A, 2,222,000 IU of vitamin D and 17,630 IU of vitamin E.
Cows in the total mixed ration group were housed in tie stalls and offered the diet at 0830 h daily for ad libitum consumption (5% to 10% refusal). Actual amounts of feed offered and refused by individual animals were recorded daily to obtain net intake. Cows in the pasture group grazed continuously except for ∼6 h/day when taken to the milking parlor and then tie stalls to receive the supplement. Refusals of the supplement were recorded.
The pasture was about 20 ha in size, divided into 0.4 to 0.8 ha paddocks by electric fences. It was routinely fertilized with 56 kg/ha of nitrogen in two applications annually, one in June and one in August. The June application for the year the experiment was conducted fell 2 weeks before the beginning of the trial and the August application occurred after the trial. Determined as described below, the pasture used for this experiment contained grasses (bluegrass 35%, quackgrass 28%, timothy grass 16%, and bromegrass, orchardgrass and unidentified species 21%) and clovers (red clover 70%, white clover 30%) at ∼55 : 45, as well as some dead matter (∼10%, dry matter basis). A new paddock was allocated every 3 days, and the stocking rate was estimated to be ∼6 cows/ha. Rotation length was 28 days, and grazed forages were a result of re-growth, thus similar in phenological stage between the two periods. Water was available all times in paddocks.
Sampling and analysis
Cows were milked at 0600 and 1700 h, with milk weights recorded each time. Milk samples were collected at milking on days 16 and 20 of each period and analyzed for fat, protein, lactose and solid-not-fat (AgSource Milk Analysis Laboratory, Menomonie, WI, USA). An aliquot of the milk samples was pooled, extracted for fat with hexane and analyzed for fatty acids upon methylation with 1.097 M methanolic HCl (Chin et al., Reference Chin, Liu, Storkson, Ha and Pariza1992) using a gas chromatograph (Hewlett-Packard model 5890 Series II; Hewlett-Packard, Brookfield, WI, USA) fitted with a flame ionization detector and a 3396 A auto-integrator. The analysis used a fused silica capillary column (60 m×0.32 mm i.d., 0.25 μm film thickness; Supelco, Inc., Bellefonte, PA, USA). A mixture of known fatty acids was used as a standard (Nu-Chek Prep, Inc., Elysian, MN, USA). The peaks identified for CLA included a major one for c9, t11-18:2 and a minor one for t10, c12-18:2. Because the minor peak was identified for only some samples, the two were combined when identified in calculating the proportion of total CLA. Likewise, other isomers such as t7, c9-18:2 and t8, c10-18:2 were not separated from these peaks, and were included in total CLA.
Blood was sampled (10 ml) 3 h after feeding on day 19 in each period from the coccygeal vessels into heparinized vacutainers, and centrifuged at 2200×g for 15 min. Plasma was kept at −20°C before analysis for CLA (c9, t11-18:2) (Chin et al., Reference Chin, Liu, Storkson, Ha and Pariza1992) using HPLC (Beckman 125/166; Beckman Instruments, Inc., Palo Alto, CA, USA).
Alfalfa silage, corn silage and refusals were sampled daily and kept frozen to generate weekly composites. Corn, soybean meal and blood meal were sampled weekly. All weekly samples were determined for dry matter by oven-drying at 60°C for 48 h. Refusals were used only for net intake calculations. Pasture forage was sampled before grazing from alternate paddocks for botanical and nutrient (CP, NDF, ADF) composition analysis; a total of four paddocks were sampled in each period. For botanical analysis, herbage from 10 randomly selected strips (0.01×1.0 m each) in each of the sampling paddocks was cut at ground level and separated into plant species by hand; the species profile was determined on the dry weight of samples (60°C oven-dried). For nutrient analysis, herbage from a second randomly selected area was cut at 9 cm above the ground to obtain 0.5 kg of wet material. Ten such areas were cut in each of the sampling paddocks. The collected herbage was subsampled, oven-dried (60oC), and pooled within paddock to generate four composites for each period.
Ruminal samples were collected every 2 h on day 19 of each period, beginning at 0830 h, until six samples were collected, representing 0, 2, 4, 6, 8 and 10 h after feeding. This schedule did not include night times, and thus could result in biases if changes in rumen contents over time were different between the dietary treatments. Samples were strained through two layers of cheesecloth. The liquid was measured for pH (Corning® pH Meter 360i; Corning, Inc., Corning, NY, USA) and kept at −20°C until analyzed for NH3-N (Broderick and Kang, Reference Broderick and Kang1980) using an auto analyzer (Technicon Auto Analyzer II; Technicon Instruments Corp., Tarrytown, NY, USA) and for volatile fatty acids (Brotz and Schaefer, Reference Brotz and Schaefer1987) using GLC (Varian Vista 6000; Varian Instrument Group, Walnut Creek, CA, USA). The solids were pooled within animal and period and lyophilized.
Omasal samples were obtained at 0830 and 1530 h during days 16 and 19 in each period. A one-hand opening and closing flip-top vial (35 ml; www.capitol-dairy-solutions.com) was held in the left hand with the cap closed and inserted through the rumen cannula into the omasum. The cap then was opened using the thumb to allow the vial to be filled with digesta. The vial was then closed and withdrawn. Two vials of samples were obtained at each sampling time. The samples (16 vials) were pooled within cow and period and lyophilized.
Dried samples of feeds (including pasture forage), ruminal contents and omasal contents were ground through a Wiley mill using a 1-mm screen (Arthur H. Thomas, Philadelphia, PA, USA). Ground feed samples were analyzed for dry matter (105°C), CP (LECO FP-2000 Nitrogen Analyzer; Leco Instruments, Inc., St. Joseph, MI, USA) and NDF (using heat stable α-amylase and Na2SO3) plus ADF (Robertson and Van Soest, Reference Robertson and Van Soest1981) using the ANKOM200 Fiber Analyzer (ANKOM Technology, Fairport, NY, USA). Chemical analyses were expressed on a dry matter basis (105°C). Nutrient content of the total mixed ration and the supplement was computed from average analyses of the ingredients over the experiment. Ground ruminal and omasal samples were analyzed for fatty-acid concentration and profile (Chin et al., Reference Chin, Liu, Storkson, Ha and Pariza1992) using the same gas chromatograph used for milk fatty-acid analysis described above. Heptadecanoic acid was used as an internal standard, assuming sample content of this acid was negligible. Peaks for c9, t11 and t10, c12 isomers were detected for most of the digesta samples.
Statistical analysis
Data were processed for ANOVA using two models by the GLMs procedure of SAS (2000). Model 1 was based on a crossover design and used for all data except for ruminal pH, volatile fatty acids and NH3-N, all of which were analyzed with Model 2 according to a crossover split-plot design. The two models were as follows:
 $$Y=\mu {\plus}R{\plus}C\left( R \right){\plus}P{\plus}T{\plus}E$$
 $$\eqalignno{Y= \ \mu {\plus}R{\plus}C\left( R \right){\plus}P{\plus}T{\plus}RT{\plus}H{\plus}RH{\plus}HC\left( R \right){\plus}HP \cr {\plus}TH{\plus}RTH{\plus}E$$
where Y is the observation, μ the overall mean, R the replicate, C(R) the cow within replicate, P the period, T the treatment, E the error term, RT the interaction between replicate and treatment, H the hour, RH the interaction between replicate and hour, HC(R) the interaction between hour and cow within replicate, HP the interaction between hour and period, TH the interaction between treatment and hour and RTH the interaction among replicate, treatment and hour. In Model 2, replicate, cow within replicate, period and treatment were in the main plot and the remaining terms were in the subplot. Treatment effects were tested by replicate and treatment interactions.
Results and discussion
One cow in the total mixed ration group during period 1 was off feed before sample collection began and was removed from the trial, leaving seven cows contributing to the data analyzed. In addition, as mentioned above, some fatty acids in some of the milk and digesta samples were not identified, including those of 10 carbons or shorter, t10, c12-18:2 and t11-18:1. We did not think it appropriate or meaningful to assign a ‘0’ to these samples and then conduct a statistical analysis to compare treatment means. Instead, the values for t10, c12-18:2, minor if detected, were combined with c9, t11-18:2 and reported as ‘CLA.’ T11-18:1 was detected in most of the milk and digesta samples and thus reported separately.
Lactation performance and ruminal fermentation
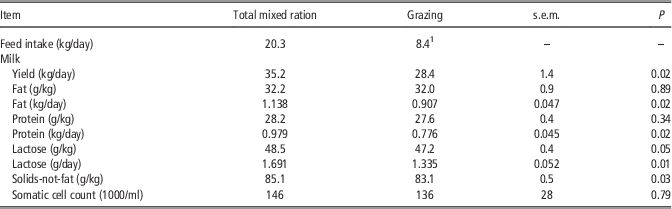
Mean consumption of the supplement by grazing cows was 8.4 kg/day (dry matter; Table 2). Using the 40 : 60 split for intake from the supplement and pasture and the nutrient content of the feed sources (Table 1), the diet consumed by grazing cows would contain 168, 276 and 186 g/kg CP, NDF and NDF, respectively, compared with 175, 236 and 156 g/kg for the total mixed ration (Table 1). Feed starch was not analyzed, but the ration formulation showed 350 g/kg for the total mixed ration and 620 g/kg for the supplement. These values were relatively high because of the use of high amounts of corn. Likewise, feed ingredients were not analyzed for fatty acids for this experiment, but forages from the same pasture were analyzed in the previous season, and the analysis showed 174 and 393 g/kg of the total fatty acids as 18:2n-6 and 18:3n-3, respectively (unpublished). Using these values and values listed in the NRC guidelines (2001) for the other feed ingredients, as well as the 40 : 60 split for supplement and pasture intake, the total mixed ration and the diet consumed during grazing were calculated to contain 33 and 35 g/kg long-chain fatty acids, of which 48.1% and 32.4% were 18:2n-6 and 9.4% and 24.7% were 18:3n-3, respectively. The estimated intake was 322 and 235 g/day for 18:2n-6 and 63 and 179 g/day for 18:3n-3, totaling 385 and 404 g/day, for the two regimens, respectively. These estimates were consistent with observations that the predominant fatty acid is 18:2n-6 in cereal grains and 18:3n-3 in grasses and clovers. The estimates also suggest that, because both fatty acids are extensively biohydrogenated, combined outflow of these fatty acids from the rumen would be similar between the diets.
Feed intake and milk production of cows fed a total mixed ration or grazed

1 Supplement intake only; forage intake from pasture is not included.
Milk yield was 6.8 kg/day lower (P<0.05) for cows grazed than fed the total mixed ration (Table 2). The concentrations of milk fat were similar between the feeding systems, and both were low, reflecting the estimated high dietary starch content. The solids-not-fat proportion of milk of grazing cows was reduced compared with those on the total mixed ration (P<0.05), largely because of a lower (P<0.05) lactose concentration. Yield of milk protein also was lower (P<0.05) when cows were grazed than fed the total mixed ration. A balance calculation showed that cows would consume 7 kg/day forage from the pasture, in addition to the 8.4 kg/day from the supplement, to produce 28.4 kg/day milk when their energy balance was zero and protein balance was positive (180 g/day). The intake from the pasture would be even lower if cows were in fact losing BW, which was likely the case based on visual observations (cows were not weighed). In contrast, cows fed the total mixed ration had an energy balance of 21 MJ/day and a protein balance of 400 g/day with 35.2 kg/day milk. These estimates suggest that the intake from the pasture was not sufficient to support a higher milk yield above the energy maintenance requirement that usually substantially increases because of grazing activities (NRC, 2001). Milk decreases are a common observation when cows are changed from a total mixed ration to grazing, often accompanied with BW losses, and the change is considered to result from insufficient intake from pasture because of small bite sizes (Wu et al., Reference Wu, Kanneganti, Massingill, Wiltbank, Walgenbach and Satter2001).
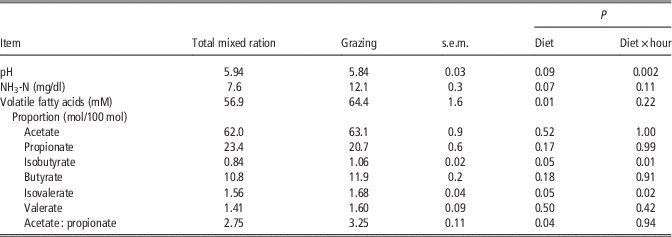
Mean ruminal pH, obtained from measurements taken during a 10-h period after feeding, was low for both treatments (5.84 and 5.94 for grazing and total mixed ration, respectively, P<0.10; Table 3), reflecting the high starch content of the diets. The NH3-N and total volatile fatty-acid concentrations were higher (P<0.10) for grazing, reflecting more rapid fermentation and degradation of protein for fresh herbage than conserved forages. Isobutyrate and isovalerate were slightly higher (P<0.05) for grazing cows, as was the acetate to propionate ratio.
Ruminal pH, NH3-N concentration and volatile fatty-acid profile measured during a 10-h period after feeding in cows fed a total mixed ration or grazed

CLA
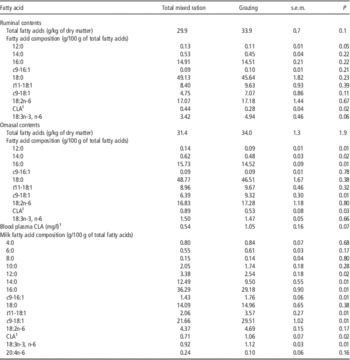
Total fatty-acid concentration in ruminal digesta was higher (P<0.01) for cows grazed than fed the total mixed ration (Table 4). The concentration for c9-18:1 tended to be higher (P<0.01) in ruminal digesta of grazed cows than for those fed the total mixed ration. Also, CLA concentration in ruminal digesta was lower (P<0.05) for grazing cows. Some small decreases in 12:0, 14:0 and 16:0 were observed (P<0.10) in omasal digesta during grazing relative to total mixed ration feeding. However, the concentration of c9-18:1 increased (P<0.01). The concentration of CLA in blood plasma was higher (P<0.10) for grazing than for the total mixed ration. The CLA proportion of milk fatty acids was ∼50% higher (P<0.05) during grazing than during total mixed ration feeding (1.06 v. 0.71 g/100 g). The proportions for 4:0, 6:0 and 8:0 in milk fat are listed in Table 4, but because not all of them were detected in some of the samples, as indicated above, the values may have been underestimated and could be biased. Low values could be a result of loss of methyl esters during analysis or extremely low concentrations that were below the sensitivity of the flame ionization detector. The proportions for 12:0, 14:0 and 16:0 were lower (P<0.05) for grazing cows than for those fed the total mixed ration. In contrast, c9-16:1, t11-18:1, c11-18:1 and 18:3n-3 and n-6 were present in higher (P<0.05) concentrations, along with CLA, in milk fat of grazing cows.
Fatty acids in ruminal contents, omasal contents, blood plasma and milk fat of cows fed a total mixed ration or grazed

1 Primarily c9, t11-18:2, including t10, c12-18:2, if any.
The increase in the concentration of CLA in milk during grazing compared with feeding a total mixed ration observed in this experiment was in accordance with previous reports (Kelly et al., Reference Kelly, Kolver, Bauman, VanAmburgh and Muller1998; Dhiman et al., Reference Dhiman, Anada, Satter and Pariza1999; Loor et al., Reference Loor, Herbein and Polan2002). These studies showed that grazing can effectively increase milk CLA, and the CLA concentration is somewhat proportional to the contribution of pasture to the total feed intake.
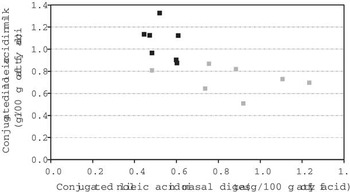
The origin of milk CLA has been ascribed to both ruminal and endogenous syntheses. Rumen-based theories concerning the mechanism of increased milk CLA synthesis when cows are grazed include: (1) reduced digesta retention in the rumen, which would increase the passage of biohydrogenation intermediates from the rumen to the small intestine (Kay et al., Reference Kay, Mackle, Auldist, Thompson and Bauman2004); (2) rapid release of fatty acids from grazed herbage in the rumen, which would result in inhibited biohydrogenation at the latter step, thus causing accumulation of intermediates formed in the rumen (Noble et al., Reference Noble, Moore and Harfoot1974; Kim et al., Reference Kim, Huws, Lee and Scollan2009); (3) altered microbial populations and associated biohydrogenation pathways (Polan et al., Reference Polan, McNell and Tove1964) and (4) decreased ruminal pH (as shown in Table 3), which would result in shifts in bacterial populations (Kim et al., Reference Kim, Liu, Rychlik and Russell2002; Piperova et al., Reference Piperova, Sampugna, Teter, Kalscheur, Yurawecz, Ku, Morehouse and Erdman2002; Palmquist et al., Reference Palmquist, Lock, Shingfield and Bauman2005). None of these hypotheses is relevant for the present study because grazing cows had ruminal and omasal CLA concentrations that were only about 60% of the cows fed the total mixed ration (Table 4), despite their higher milk CLA concentrations. In addition, a plot (Figure 1) using cows from both treatments reveals a trend for a negative relationship between the proportion of CLA in milk fat and the proportion in omasal fat; the CLA in milk would include isomers that are usually present in higher amounts in milk than in the rumen (such as t7, c9-18:2). These data suggest that increased milk CLA during grazing observed in this experiment was not a result of more production in the rumen. The observation is consistent with the analysis of Mohammed et al. (Reference Mohammed, Stanton, Kennelly, Kramer, Mee, Glimm, O’Donovan and Murphy2009) and Halmemies-Beauchet-Filleau et al. (Reference Halmemies-Beauchet-Filleau, Kairenius, Ahvenjärvi, Crosley, Muetzel, Huhtanen, Vanhatalo, Toivonen, Wallace and Shingfield2013a and Reference Halmemies-Beauchet-Filleau, Kairenius, Ahvenjärvi, Toivonen, Huhtanen, Vanhatalo, Givens and Shingfield2013b) for the effect of grazing on milk CLA compared with feeding chopped grass or hay.
Concentration of CLA (primarily c9, t11-18:2, including t10, c12-18:2, if any) in milk and omasal digesta when cows were fed conserved forages (light markers) or grazed (dark markers).

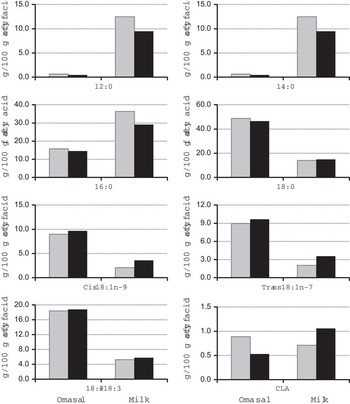
Discussion should be made on several other factors that could be related to increased milk CLA in this study. First, while cows usually lose BW after taken onto a pasture, the data on milk fatty acids for this short-term experiment might not have been confounded by adipose mobilization, as suggested by the similar low proportions of 18:0 in milk, a pre-formed, major fatty acid in the adipose tissue, for both feeding systems (Figure 2). These proportions were also lower than those in the omasal contents, contrasting to those for 12:0, 14:0 and 16:0 that can be synthesized in the mammary gland. On the other hand, milk c9-18:1 was higher for grazing, which would suggest increased adipose contribution, but its omasal concentration was also higher. Second, milk CLA was reported to increase when dietary starch was increased from 150 to 250 g/kg (Cabrita et al., Reference Cabrita, Bessa, Alves, Dewhurst and Fonseca2007), but decreased when corn, a starchy feed source, was increased from 365 to 588 g/kg of the diet (Griinari et al., Reference Griinari, Dwyer, McGuire, Bauman, Palmquist and Nurmela1998), or remained unchanged when corn was replaced by citrus pulp, a non-starch feed source (Solomon et al., Reference Solomon, Chase, Ben-Ghedalia and Bauman2000). Regardless of the inconsistency of reports in the literature, changes in milk CLA observed in these studies were extremely small, especially compared with those caused by oil supplementation. Dietary starch in the present study would be within the range of the amounts used in the above-cited studies. Furthermore, the amounts would be similar between the treatments based on formulation and milk fat concentrations. It was unlikely that dietary starch caused a bias for the effect of pasture v. conserved feeds on milk CLA. Lastly, red clover contains polyphenol oxidase, which may have a protective effect on lipids from ruminal metabolism, thus increasing the transfer of polyunsaturated fatty acids from the forge to milk (Lee et al., Reference Lee, Theobald, Tweed, Winters and Scollan2009). However, substituting red clover for grasses in the diet had little effect on milk CLA (Lee et al., Reference Lee, Theobald, Tweed, Winters and Scollan2009) or the formation of c9, t11-18:2 or t11-18:1 in the rumen (Halmemies-Beauchet-Filleau et al., Reference Halmemies-Beauchet-Filleau, Vanhatalo, Toivonen, Heikkilä, Lee and Shingfield2013c), although flows of 18:2n-6 and 18:3n-3 at the omasum showed some increases (Halmemies-Beauchet-Filleau et al., Reference Halmemies-Beauchet-Filleau, Vanhatalo, Toivonen, Heikkilä, Lee and Shingfield2013c).
Omasal and milk fatty-acid proportions when cows were fed conserved forages (light bars) or grazed (dark bars).

From results of the present study, endogenous synthesis was more likely responsible for increased milk CLA when cows were fed pasture compared with conserved feeds. The proportion of fatty acids as CLA increased in milk compared with omasal contents for both regimens, as did the proportions for 12:0, 14:0 and 16:0 (Figure 2), all of which are known to be synthesized entirely or partially in the mammary gland. In addition, CLA was the only fatty-acid group that had a lower concentration in omasal contents but a higher concentration in milk during grazing than during total mixed ration feeding. Lastly, the proportion of t11-18:1 was lower in milk than in the digesta (Figure 2). While this was the case for both treatments, the observation is consistent with the understanding that CLA can be formed from t11-18:1 in the mammary gland. More directly, calculated product-to-substrate ratios for Δ9-desaturase (Perfield et al., Reference Perfield, Bernal-Santos, Overton and Bauman2002) for grazed cows were 0.06, 1.97 and 0.30 for c9-16:1/16:0, c9-18:1/18:0 and c9, t11-18:2/t11-18:1 in milk, respectively, compared with 0.01, 0.20 and 0.05 in omasal contents; the ratio for the c9, t11-18:2/t11-18:1 pair was sixfold higher in milk than in omasal contents, and the difference was 1.5 times that when cows were fed the total mixed ration. Data from all these lines suggest that CLA in milk was synthesized to a large extent at a post-absorptive stage and the synthesis increased when cows were grazed. The results are consistent with the report of Yang et al. (Reference Yang, Larsen, Smith and Tume1999) that the activity of Δ9-desaturase was higher in grazing beef cattle than in feedlot cattle, and of Mohammed et al. (Reference Mohammed, Stanton, Kennelly, Kramer, Mee, Glimm, O’Donovan and Murphy2009) that ruminal concentration of CLA has little to do with its final concentration in milk because of the involvement of de novo synthesis.
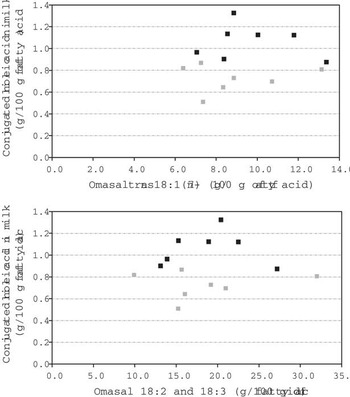
There are several possible reasons for endogenous synthesis of CLA to increase when cows are grazed. First, greater formation of t11-18:1 in the rumen could lead to more c9, t11-18:2 synthesized in the mammary gland through increased substrate availability (Halmemies-Beauchet-Filleau et al., Reference Halmemies-Beauchet-Filleau, Kairenius, Ahvenjärvi, Crosley, Muetzel, Huhtanen, Vanhatalo, Toivonen, Wallace and Shingfield2013a and Reference Halmemies-Beauchet-Filleau, Kairenius, Ahvenjärvi, Toivonen, Huhtanen, Vanhatalo, Givens and Shingfield2013b). This mechanism may also offer some explanations for increased production of CLA in milk associated with 18:3n-3, whose classical biohydrogenation pathway does not involve formation of c9, t11-18:2, as discussed above. Mohammed et al. (Reference Mohammed, Stanton, Kennelly, Kramer, Mee, Glimm, O’Donovan and Murphy2009) also reported that increased CLA cannot be fully explained by the outflow of 18:2n-6 and 18:3n-3 from the rumen and suggested that the effect of these fatty acids on milk CLA is primarily through formation of t11-18:1 during their biohydrogenation. However, no relationship was shown between omasal t11-18:1 proportion and milk CLA proportion in this experiment (Figure 3). Piperova et al. (Reference Piperova, Sampugna, Teter, Kalscheur, Yurawecz, Ku, Morehouse and Erdman2002) also reported that duodenal flow of t11-18:1 was larger than milk CLA output. Included in Figure 3 also is a plot of milk CLA against omasal 18:2n-6 and 18:3n-3 concentrations, a measure that reflects the intake, and more importantly, the metabolism of these fatty acids in the rumen through biohydrogenation. The plot shows no relationships between omasal and milk concentrations of these fatty acids, consistent with the report of Mohammed et al. (Reference Mohammed, Stanton, Kennelly, Kramer, Mee, Glimm, O’Donovan and Murphy2009). Second, the availability of the essential cofactors involved in the desaturase activity could increase when the forage source was grazed pasture. The third possibility is related to milk fat liquidity. According to Moore and Christie (Reference Moore and Christie1979), a liquid form is necessary for milk fat droplets to move to the surface of the secretory cells to be pinched off during milk fat secretion and for fat globules to be suspended in milk. Normally, fat liquidity is assured by acylation of short-chain fatty acids (low melting point) to the sn-3 position of the glycerol moiety. In the absence of short-chain fatty acids, c9-18:1, also low in melting point (14°C), could be substituted. In the present study, fatty acids of 10:0 to 16:0 carbons decreased from 52.2 to 43.0 g/100 g in milk fat during grazing compared with total mixed ration feeding (Table 4), consistent with the literature (Christie, Reference Christie1979; Timmen and Patton, Reference Timmen and Patton1988; Kelly et al., Reference Kelly, Kolver, Bauman, VanAmburgh and Muller1998) that short-and medium-chain fatty acids (C4–16) decrease when cows receive their forage from pasture. In that case, CLA synthesis may increase as a compensatory mechanism to maintain milk fat liquidity, because t11-18:1 (melting point 44oC) does not exist in a liquid form at body temperature and physicochemically resembles 18:0 (melting point 69oC) rather than c9-18:1 (melting point 14oC). While plausible, the liquidity theory is difficult to study. Toral et al. (Reference Toral, Bernard, Chilliard and Glasser2013) found in a meta-analysis that the variability of the melting point of milk fatty acids was narrower than the variability of milk fatty-acid concentrations, suggesting that melting point may be involved in the control of milk fatty-acid composition, although the effect might be small.
Relationship between the concentration of t11-18:1 and polyunsaturated octadecenoic acids (18:2n-6 and 18:3n-3) in omasal fatty acids and the concentration of CLA (primarily c9, t11-18:2, including t10, c12-18:2, if any) in milk fatty acids when cows were fed conserved forages (light markers) or grazed (dark markers).

Conclusions
It has been amply demonstrated that grazing dairy cows increases the CLA concentration in milk compared with feeding stored feeds, and this was again shown in the current study. In addition, this study showed that CLA accounted for a smaller proportion of long-chain fatty acids in ruminal and omasal digesta in pasture-fed cows than in cows fed stored feeds, thus discounting increased ruminal formation as a reason for increased CLA concentrations in milk. Rather, increased endogenous synthesis via desaturation of t11-18:1 might be the primary mechanism for the increase. Current hypotheses for increased endogenous synthesis include increased substrate availability and compensation for deceased short- and medium-chain fatty acids that are important for milk fat liquidity.
Acknowledgments
This study was supported in part by a grant from the American Cancer Society, grant number IRG-58-41-10. The authors wish to acknowledge the leadership Dr L. D. Satter played in the project. In addition, J. E. Delahoy helped verify the identification of fatty acids on the gas chromatograph.