INTRODUCTION
Shade-tolerance, here defined as a capacity to survive under shaded conditions, has been considered as the important life-history trait that influences forest dynamics and structure (Bazzaz Reference BAZZAZ1979, Canham et al. Reference CANHAM, FINZI, PACALA and BURBANK1994, Valladares & Niinemets Reference VALLADARES and NIINEMETS2008, Wright et al. Reference WRIGHT, MULLER-LANDAU, CONDIT and HUBBELL2003). Many previous studies demonstrated differences in shade-tolerance among species associated with different successional stages or co-existing species in a forest (Agyeman et al. Reference AGYEMAN, SWAINE and THOMPSON1999, Aiba & Nakashizuka Reference AIBA and NAKASHIZUKA2007, Baltzer & Thomas Reference BALTZER and THOMAS2007, Baraloto et al. Reference BARALOTO, GOLDBERG and BONAL2005, Bloor & Grubb Reference BLOOR and GRUBB2003, Kitajima Reference KITAJIMA1994, Lusk Reference LUSK2002, Reference LUSK2004; Montgomery & Chazdon Reference MONTGOMERY and CHAZDON2002). Such a variation in shade-tolerance is derived from differences in traits associated with whole-plant carbon (C) balance in relation to light conditions (Givnish Reference GIVNISH1988, Poorter & Kitajima Reference POORTER and KITAJIMA2007, Walters & Reich Reference WALTERS and REICH1999). On the other hand, environmental factors other than light conditions (e.g. soil nutrient availability) may also affect plant C balance. If so, soil nutrients can affect tree dynamics via influences on shade-tolerance of canopy tree species. However, the effects of factors other than light on shade-tolerance have not been studied well (Valladares & Niinemets Reference VALLADARES and NIINEMETS2008), and it remains unclear how or if shade-tolerance of tree juveniles differs among species adapted to different levels of nutrient availability.
The evolutionary consequence of nutrient limitation on shade-tolerance is predicted by two hypotheses that are mutually exclusive: the resource ratio hypothesis (Tilman Reference TILMAN1985) and the growth-survival trade-off hypothesis (Fine et al. Reference FINE, MILLER, MESONES, IRAZUZTA, APPEL, STEVENS, SÄÄKSJÄRVI, SCHULTZ and COLEY2006, Russo et al. Reference RUSSO, BROWN, TAN and DAVIES2007). Tilman (Reference TILMAN1985) hypothesized that species with an ability to use one resource efficiently use the other resources inefficiently. If so, plants adapted to the environments with severe nutrient limitation inherently show lower shade-tolerance because they cannot enhance abilities to utilize both nutrients and light efficiently. In line with the resource ratio hypothesis, Baltzer & Thomas (Reference BALTZER and THOMAS2007) demonstrated that tree saplings occurring on a ridge, where the availability of both water and nutrients is low, require a higher light intensity for positive growth. However, it is rarely tested in other studies whether tree species occurring in nutrient-poor environments demonstrate lower shade-tolerance than those occurring in nutrient-rich environments.
The growth-survival trade-off hypothesis expects the contrasting pattern; plants growing in nutrient-poor environments should show greater shade-tolerance. Plants adapted to poor resources (light and nutrient) have a suite of traits to acquire and use those resources efficiently (reviewed by Chapin Reference CHAPIN1980, Craine Reference CRAINE2009, Valladares & Niinemets Reference VALLADARES and NIINEMETS2008). Craine (Reference CRAINE2009) noted that some of the traits adaptive to nutrient impoverishments converge with those traits to enhance shade-tolerance, supporting the growth-survival trade-off hypothesis. For instance, plants growing in nutrient-poor environments tend to have leaves with a lower foliar nutrient concentration, a lower maximum photosynthetic C assimilation rate, a lower dark respiration rate and a higher concentration of defensive compounds (e.g. phenols) (Chapin Reference CHAPIN1980, Craine Reference CRAINE2009, Fine et al. Reference FINE, MILLER, MESONES, IRAZUZTA, APPEL, STEVENS, SÄÄKSJÄRVI, SCHULTZ and COLEY2006), which should minimize C losses under shaded conditions, i.e. greater shade-tolerance (Baltzer & Thomas Reference BALTZER and THOMAS2007, Givnish Reference GIVNISH1988, Kitajima Reference KITAJIMA1994, Walters & Reich Reference WALTERS and REICH1999).
Answering the question of which hypothesis is applicable to tropical rain-forest species needs further study. We examined the interspecific variation in survival and traits (biomass allocation, leaf dynamics and leaf chemistry) as a function of light conditions for saplings of 13 canopy tree species in three Bornean rain forests with different nutrient availabilities. Specifically, we tested the following hypotheses: (1) Shade-tolerance (i.e. survival at low light) is greater for species occurring in a low-nutrient environment than those in a high-nutrient environment. (2) Functional traits associated with nutrient impoverishment contribute to improving shade-tolerance via C conservation (minimizing C losses) in canopy species of tropical forests with different levels of nutrient availabilities.
METHODS
Study sites and species
Study sites were located in the forests of the Tawau Hills Park (4°27’N, 117°56’E, c. 300 m asl), the Deramakot Forest Reserve (5°22’N, 117°25’E, c. 250 m asl) and Nabawan (5°05’N, 116°29’E, c. 500 m asl) in Sabah, the north part of Borneo. The vegetation is a mixed dipterocarp forest in Tawau (Seino et al. Reference SEINO, KITAYAMA and LAKIM2007) and Deramakot (Imai et al. Reference IMAI, KITAYAMA and TITIN2010), and a tropical heath forest in Nabawan (Takahashi unpubl. data). These sites considerably differ in soil characteristics. Inorganic P was sequentially extracted by 0.5 M NaHCO3 adjusted to pH 8.5 (HCO3-Pi) followed by 0.1 M NaOH (OH-Pi). The concentration of inorganic P (the sum of HCO3-Pi and OH-Pi) in topsoils is 74.0 μg g−1 in Tawau (Matsushima unpubl. data), 3.5 μg g−1 in Deramakot (Imai et al. Reference IMAI, KITAYAMA and TITIN2010), and 10.0 μg g−1 in Nabawan (Takahashi unpubl. data). On the other hand, the concentration of inorganic N (the sum of NH4+-N and NO3−-N) extracted by 1.5 N KCl is 143.4 μg g−1 in Tawau (Matsushima unpubl. data), 24.1 μg g−1 in Deramakot (Imai unpubl. data), and 11.0 μg g−1 in Nabawan (Takahashi unpubl. data). Soil pH is 4.7 in Tawau (Matsushima unpubl. data), 3.4 in Deramakot (Imai et al. Reference IMAI, KITAYAMA and TITIN2010) and 3.7 in Nabawan. Previous studies demonstrated that plants in tropical heath forests are characterized by a greater magnitude of nutrient impoverishment than those in mixed dipterocarp forests according to the physiological and morphological characteristics of leaves (i.e. a lower foliar nutrient concentration and smaller/thicker leaves for species in tropical heath forests) (Chua et al. Reference CHUA, KOH, LAU, LEE, MATHIAS, TURNER and YONG1995, Reich et al. Reference REICH, WALTERS, ELLSWORTH and UHL1994, Turner et al. Reference TURNER, LUCAS, BECKER, WONG, YONG and CHOONG2000). Therefore, we considered those forests in Tawau, Deramakot and Nabawan as a cline of nutrient availability; i.e. fertile, moderately nutrient-poor and severely nutrient-poor sites, respectively.
We selected three or four most abundant species in Dipterocarpaceae, which comprised 25% relative basal area in each site. However, species evenness was high in the Deramakot Forest Reserve (36 dipterocarp species co-occurred in a 2-ha vegetation plot), and we could not meet this criterion. Instead, we selected five abundant dipterocarp species that have a high sapling density. The selected species included Parashorea tomentella, Shorea johorensis, Shorea macrophylla and Shorea parvifolia in the Tawau Hills Park; Dryobalanops lanceolata, Parashorea malaanonan, Shorea atrinervosa, Shorea multiflora and S. parvifolia in the Deramakot Forest Reserve; and Cotylelobium melanoxylon, Dacrydium pectinatum, Hopea pentanervia and Shorea venulosa in Nabawan. Dacrydium pectinatum, which is a gymnosperm in the Podocarpaceae, was included in the study because this species comprises 40% of basal area in Nabawan (Takahashi unpubl. data) and the traits of the species can have significant influences on forest dynamics.
Sapling census, assessment of light condition and chemical analysis
Field survey was carried out from September 2011 to February 2013. In the three forests, we tagged 40 saplings or more, defined as individuals less than 1 cm in diameter at ground height (DGH), across understorey to forest gaps for each study species. Bamboos, lianas and herbaceous plants in the census plots under canopy gaps were cut off so as not to affect light conditions of censused saplings. DGH and status (i.e. living or dead) of each sapling were recorded three times at 8-mo intervals. In addition to this, all leaves of each sapling were numbered using numbered tapes, and the occurrence of new leaves was recorded at each census. Leaf dynamics was measured for all species except for D. pectinatum because of the difficulty in measuring dynamics of coniferous leaves of the species. To determine the light conditions of each sapling, we took hemispherical photographs on the top of saplings at the first and second censuses. Photographs were taken under an overcast sky with a Coolpix 990 digital camera equipped with a FC-E8 fish-eye converter (Nikon). Each photograph was processed using the HemiView image analysis software (ver. 2.1, Delta-T Devices), which allowed determination of indirect site factor (ISF), direct site factor (DSF) and global site factor (GSF). GSF is calculated as a weighted average of ISF and DSF. GSF at the initial census or at the time of harvesting was used as an index of the light condition for each sapling.
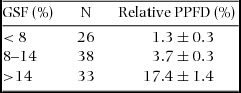
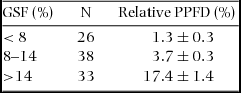
Coomes & Grubb (Reference COOMES and GRUBB2000) demonstrated that forests on nutrient-poor soils showed a higher light intensity in the understorey than forests on nutrient-rich soils probably reflecting differences in foliage reflectance and arrangement. To validate the light availability derived from hemispherical photography (which may include the effects of foliage arrangement) in the nutrient-poor heath forest, we directly measured relative photosynthetic photon flux density (relative PPFD) in the heath forest. To determine relative PPFD at the points where the hemispherical photographs were taken, we measured PPFD on the top of each censused sapling (A) and under an open sky (B) at the same time using two quantum sensors (Apogee MQ-100). We found that the mean (± SE) relative photosynthetic photon flux density (PPFD) calculated by the measurement of sensor A (under canopy) divided by the ones of sensor B (open sky) was 1.3% ± 0.3% at GSF <8%, which was considered as a threshold of a low-light regime (Appendix 1). This result was comparable with the data of other studies in tropical evergreen forests; relative PPFD beneath closed-canopy ranges from 0.4% to 2.0% (reviewed by Coomes & Grubb Reference COOMES and GRUBB2000). This indicates that saplings with <8% GSF in the tropical heath forest grow under very low light availability.
To estimate biomass allocation, more than 19 saplings of each species (ranging from 19 to 31; Appendix 2) were harvested at the second or third census after DGH and light conditions were measured. The saplings were divided into three organs (leaves, stems and roots) and oven-dried at 60ºC for 4 d. Dry weight of three organs was measured separately.
Four saplings under high-light conditions (over 14% GSF) for each species were chosen, and C, N and P concentrations of each foliar sample were determined. C and N concentrations were analysed by the dry combustion method with an NC analyser (JM1000CN). To determine P concentration, each sample was digested on a block digester with concentrated H2SO4 and H2O2. Solutions were filtered through Advantec 5C filter paper and made up to 50 ml with deionized water. P concentration in the solutions was determined using an inductively coupled plasma atomic emission spectrometer (ICPS-7510, Shimadzu Co., Kyoto, Japan).
Data analysis
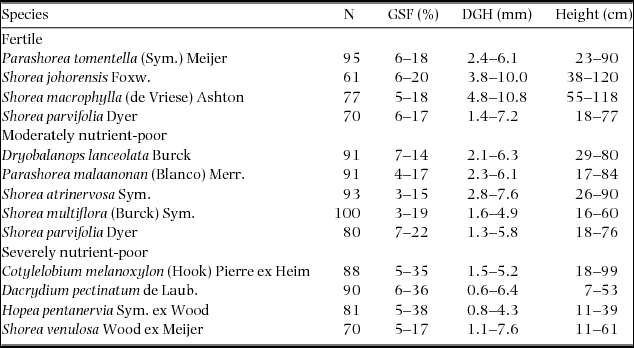
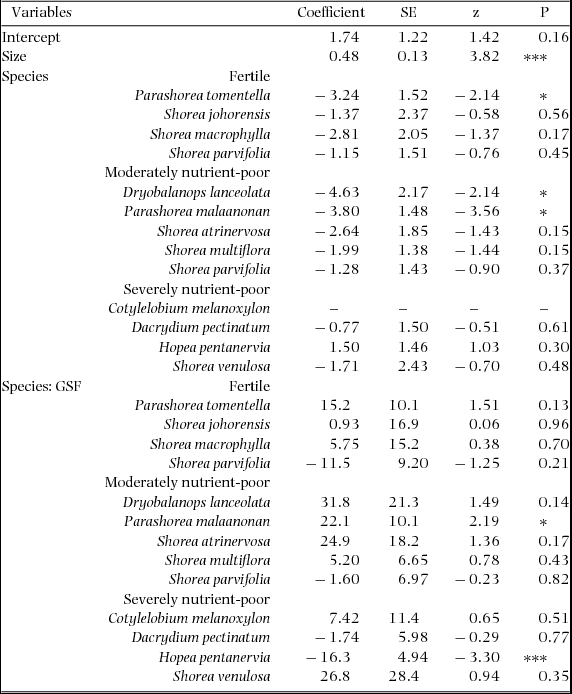
We examined plant survival and functional traits (biomass allocation, leaf dynamics and leaf chemistry) as a function of light conditions using GSF. We estimated the probability of survival between the censuses (survival) using generalized linear mixed models (GLMMs) with binomial error distribution (Aiba & Nakashizuka Reference AIBA and NAKASHIZUKA2007). The number of observations and light conditions of censused saplings used for the GLMMs are summarized in Table 1. The binary variable (living or dead in the terminal censuses) was regressed by explanatory variables at initial censuses; size (DGH), light conditions (GSF) and species as well as the interactions of DGH, GSF and species. Census period (first and second) was considered as a random effect for the intercept of the models. At the step-wise model selection process, the model with the lowest Akaike information criterion (AIC) was considered as the best-fit model. The number of observation, estimates and z values for Wald statistics of the best-fit model are described in Appendix 3. Using the models, the probability of survival at low (5% GSF) and high light (15% GSF) at 3-mm DGH was estimated for each species, and survival at low light was considered as shade-tolerance of each species.
Ranges of light conditions (global site factor, GSF), diameter at ground height (DGH) and height of the saplings censused for the generalized linear mixed model (GLMM) to estimate probability of survival for the 13 tree species in the three Bornean rain forests; fertile, the Tawau Hills Park; moderately nutrient-poor, the Deramakot Forest Reserve; severely nutrient-poor, Nabawan. Number of observations (N) is also shown.

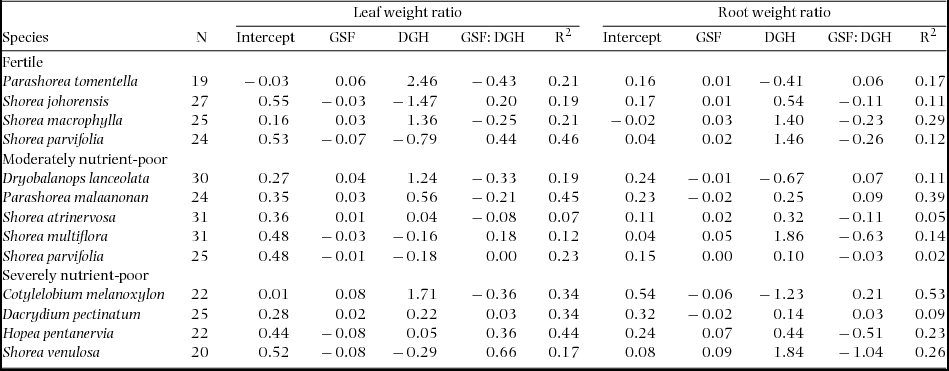
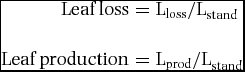
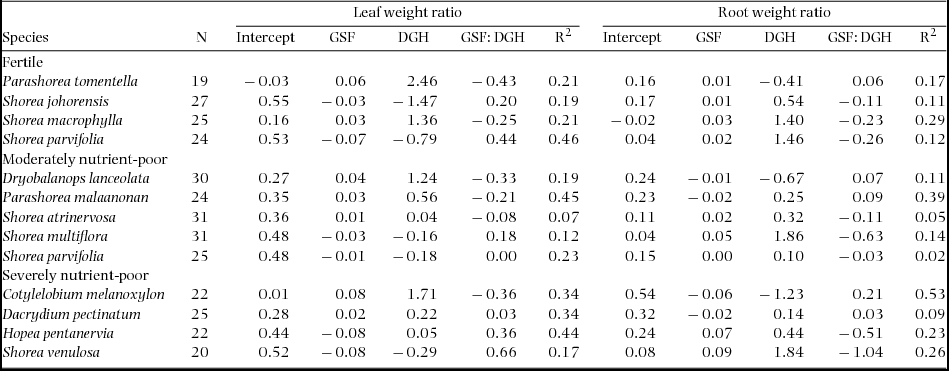
Leaf and root weight ratios were calculated for each harvested sapling as biomass ratios of leaves and roots to whole-plant, respectively. Subsequently, we regressed the biomass allocations by size (DGH), light conditions (GSF) and the interaction of DGH and GSF using multi-linear models for each species. Biomass allocations at low (5% GSF) and high light (15% GSF) at 3-mm DGH were calculated for each species. Model coefficients and coefficients of determination (R2) were described in Appendix 2. To describe leaf dynamics of the 12 species (except for D. pectinatum), leaf loss and production were calculated for each censused sapling following the equations below:
 \begin{eqnarray*}
{\rm Leaf}\,{\rm loss} &=& {\rm L}_{{\rm loss}} {\rm /L}_{{\rm stand}}\\[8pt]
{\rm Leaf}\,{\rm production} &=& {\rm L}_{{\rm prod}} {\rm /L}_{{\rm stand}}
\end{eqnarray*}
where Lloss and Lprod are the numbers of lost and produced leaves between the censuses, respectively. Lstand is the standing number of leaves at the initial census. We calculated the mean values of leaf dynamics of the saplings at low (< 8% GSF) and high light (> 14% GSF). For S. venulosa, leaf dynamics at high light was calculated as mean values of saplings > 8% GSF because of the limited sample number.
The differences in survival and traits among the three sites were tested by an analysis of variance (ANOVA). Pairwise differences between the groups were tested by the Tukey post hoc test at P = 0.05. We performed standardized major axis (SMA) slope-fitting techniques using the sma function in the package smart of the R software for the analysis of the relationship among survival and functional traits (biomass allocation, leaf dynamics and leaf chemistry) at each light condition (low and high). All statistical analyses were performed by the R software, version 3.1.0 (R Foundation for Statistical Computing, Vienna; http://www.R-project.org/).
RESULTS
Survival and traits in relation to light condition
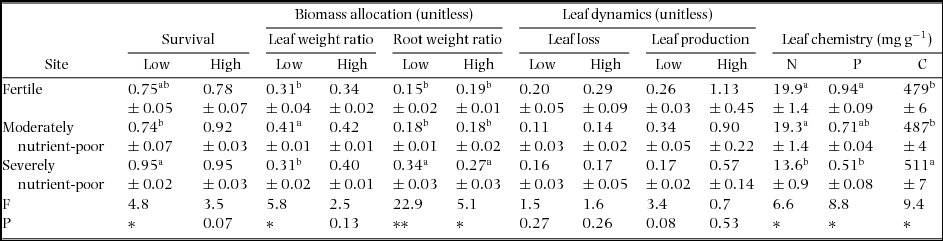
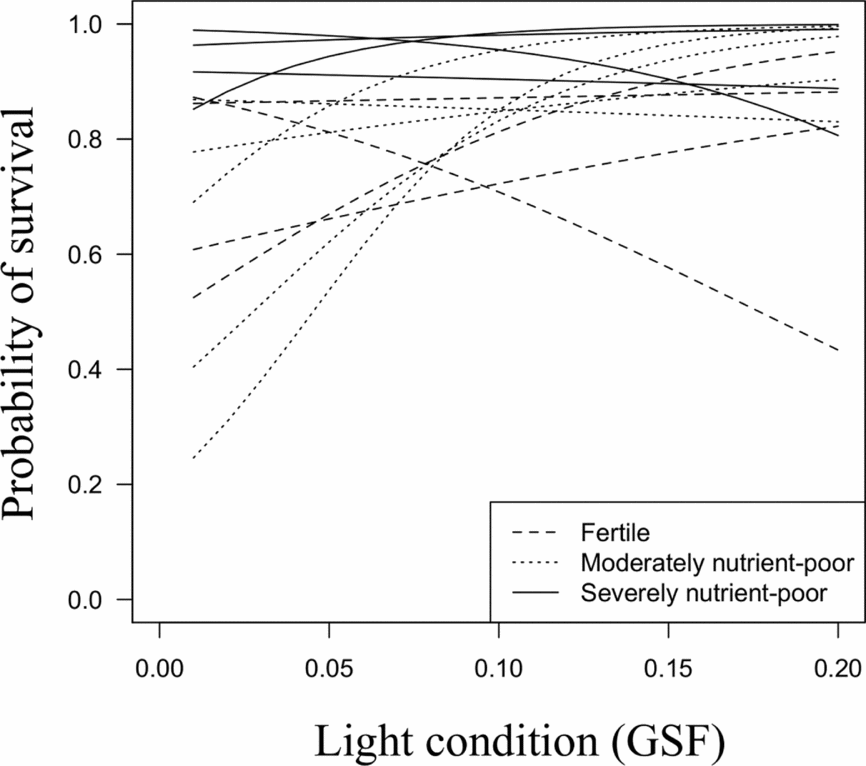
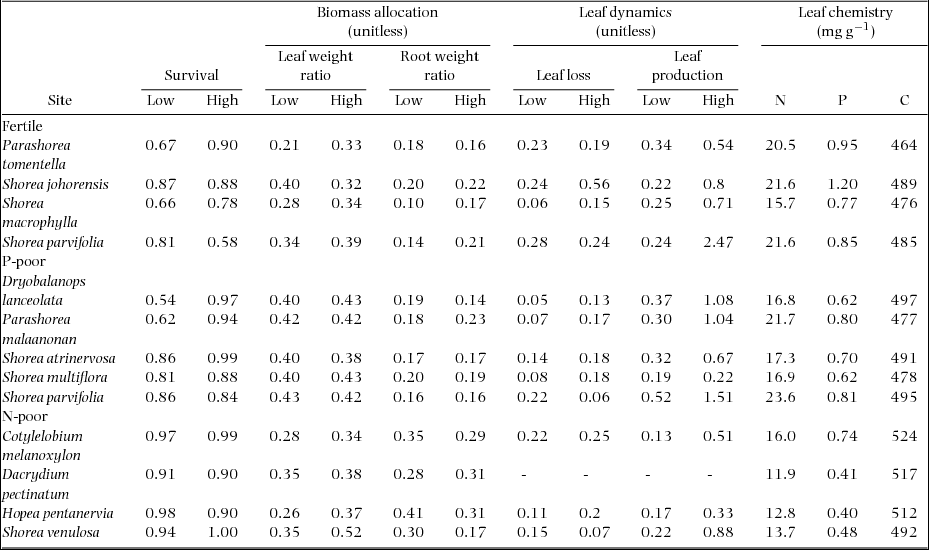
The equation of the best-fit model for probability of survival between the censuses (survival) was as follows: Survival ~ Size (DGH) + Species + GSF: Species. The estimated survival of each species varied with light conditions (Figure 1) and size (Appendix 3). Survival at low light significantly differed among the sites (ANOVA, P < 0.05, Table 2). The rank of mean values of survival at low light was severely nutrient-poor > fertile > moderately nutrient-poor site (Table 2). The difference in survival at high light among the sites was not significant (ANOVA, P = 0.07, Table 2).
Mean (± SE) of probability of survival (survival) and functional traits (biomass allocation, leaf dynamics and leaf chemistry) at low (5% global site factor) and high light (15% global site factor) for the 13 tree species in the three Bornean rain forests; fertile, the Tawau Hills Park; moderately nutrient-poor, the Deramakot Forest Reserve; severely nutrient-poor, Nabawan. The difference among the sites was analysed by an ANOVA. F and P values are shown (degree of significance, * P < 0.05, ** P < 0.005, N = 13). Groups sharing the same letters do not significantly different from each other at P = 0.05 (Tukey's HSD). Leaf dynamics was measured for the species other than Dacrydium pectinatum (N = 12).
The model predictions of probability of survival between the censuses (8 mo interval) for each species at 3-mm DGH in relation to light conditions (global site factor, GSF) for the 13 tree species in the three Bornean rain forests; fertile, the Tawau Hills Park; moderately nutrient-poor, the Deramakot Forest Reserve; severely nutrient-poor, Nabawan. Species of different sites are indicated with different line types.
Biomass allocation of each species varied with light condition and size, and there were no consistent trends of responses to light and size across the species (Appendix 2). Leaf weight ratio at low light significantly differed among the sites (ANOVA, P < 0.05, Table 2), whereas leaf weight ratio at high light did not (ANOVA, P = 0.13, Table 2). Root weight ratio significantly differed among the sites both at low and high light (ANOVA; P < 0.005, < 0.05, respectively; Table 2). Leaf loss varied with light conditions (Table 2), and there were no consistent trends across the study species (Appendix 4). Leaf production increased with increasing light conditions (Table 2). Both leaf loss and production did not significantly differ among the sites at low (ANOVA; P = 0.27 and 0.08, respectively; Table 2) and high light (ANOVA; P = 0.26 and 0.53, respectively; Table 2). Foliar N, P and C concentrations significantly differed among the sites (P < 0.05 in each case, Table 2).
Correlation among performances and traits
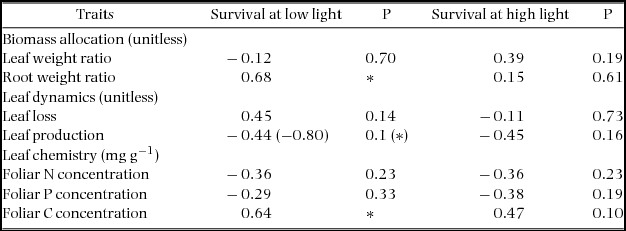
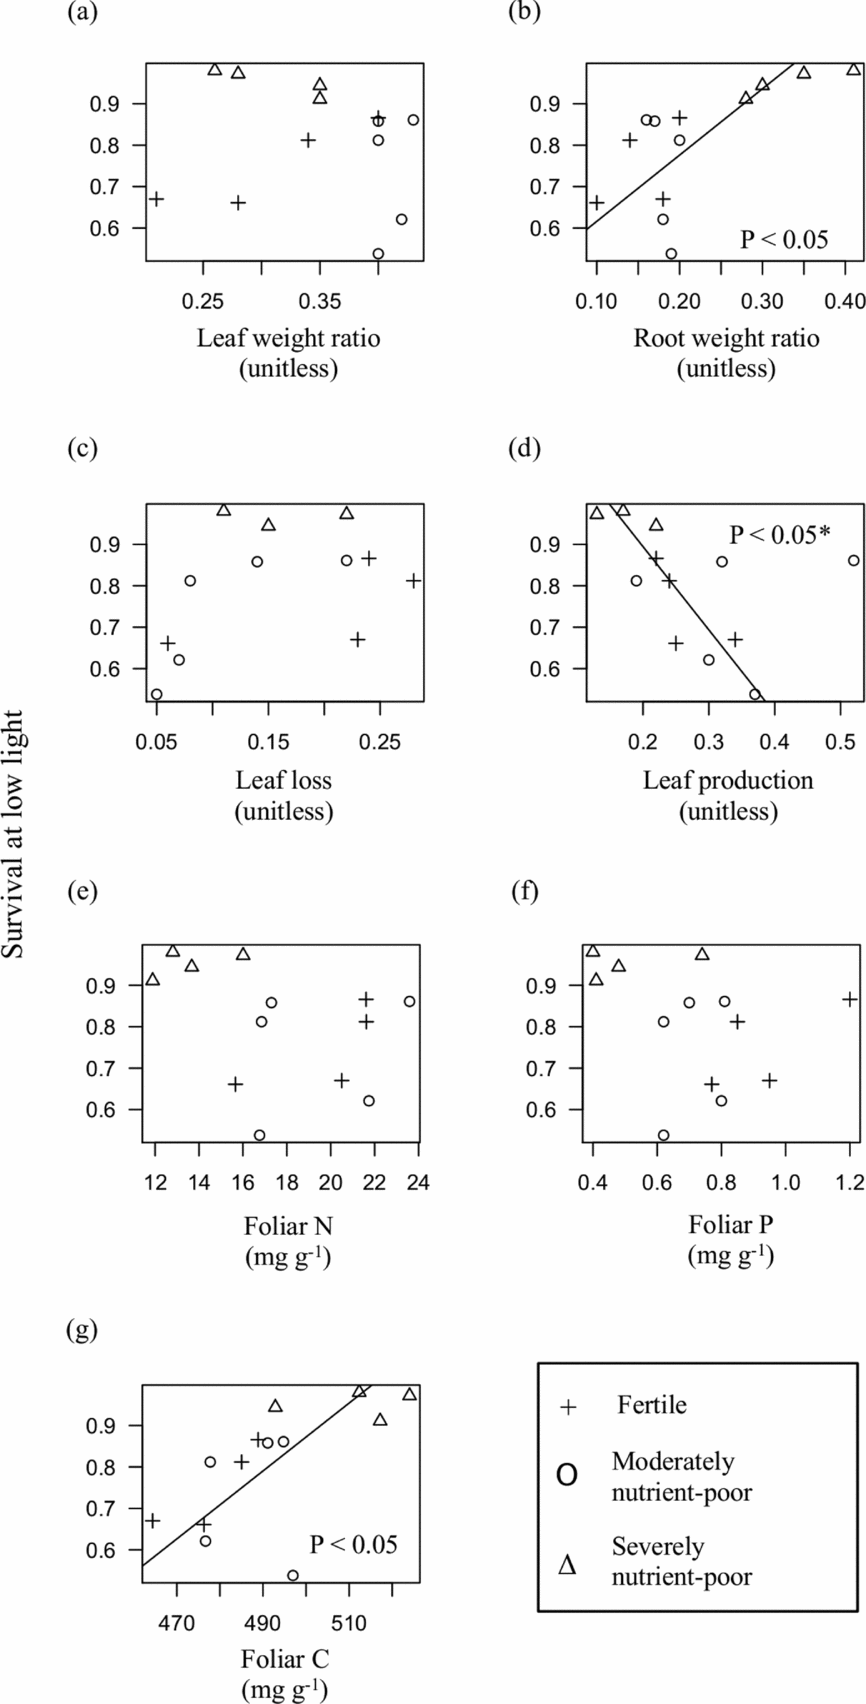
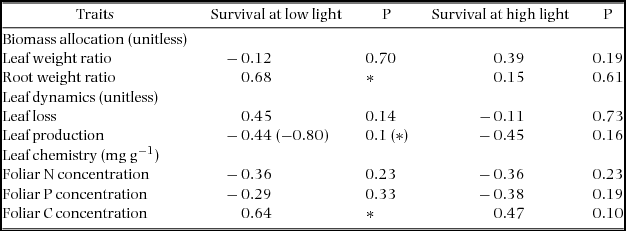
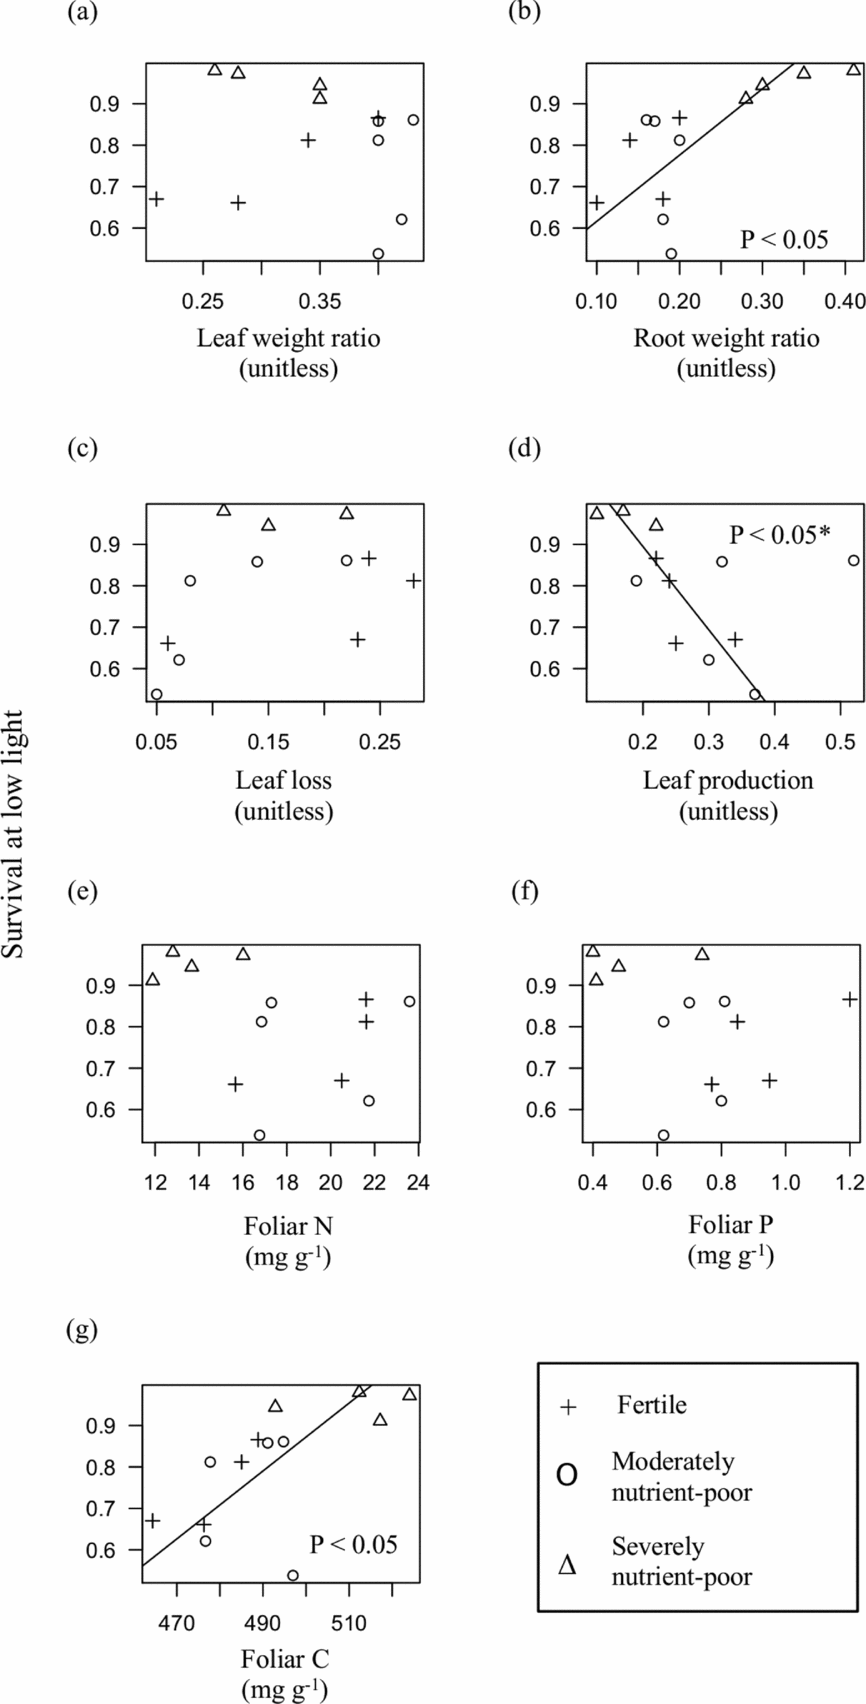
Figure 2 demonstrates the relationships between survival at low light (i.e. shade-tolerance) and functional traits among the study species. Survival at low light increased with increasing root weight ratio (r = 0.68, Figure 2b, Table 3) and foliar C concentration (r = 0.64, Figure 2g, Table 3), and with decreasing leaf production (if S. parvifolia in the moderately nutrient-poor site was excluded) (r = −0.80, Figure 2d, Table 3). On the other hand, survival at high light did not correlate with any of the functional traits (Table 3).
The coefficient of determination (r) of standardized major axis (sma) analysis for the relationship between survival and functional traits at low (5% global site factor) and high (15% global site factor) light for the 13 tree species in the three Bornean rain forests; fertile, the Tawau Hills Park; moderately nutrient-poor, the Deramakot Forest Reserve; severely nutrient-poor, Nabawan. P values are also shown (Degree of significance; * P < 0.05). The relationship between survival at low light and leaf production was significant if Shorea parvifolia in the moderately nutrient-poor site was excluded (r = −0.80, P < 0.05, N = 11).
The relationships between survival at low light (5% global site factor) and functional traits: leaf weight ratio (a), root weight ratio (b), leaf loss (c), leaf production (d), foliar N concentration (e), foliar P concentration (f), foliar C concentration (g) for the 13 tree species in the three Bornean rain forests; fertile, the Tawau Hills Park; moderately nutrient-poor, the Deramakot Forest Reserve; severely nutrient-poor, Nabawan. *, the relationship between survival at low light and leaf production was significant if Shorea parvifolia in the moderately nutrient-poor site was excluded (P < 0.05, N = 11).
DISCUSSION
We determined the responses of shade-tolerance (defined as survivorship at 5% GSF) to different levels of nutrient limitation. The resource ratio hypothesis (Tilman Reference TILMAN1985) and the growth-survival trade-off hypothesis (Fine et al. Reference FINE, MILLER, MESONES, IRAZUZTA, APPEL, STEVENS, SÄÄKSJÄRVI, SCHULTZ and COLEY2006, Russo et al. Reference RUSSO, BROWN, TAN and DAVIES2007) predict the contrasting patterns of shade-tolerance in relation to nutrient availability. All species in the severely nutrient-poor site (tropical heath forest) showed greater shade-tolerance (over 91% survival for 8 mo) than species in the other sites (54–87% survival for 8 mo) (Figure 1, Appendix 4), which supports the growth-survival trade-off hypothesis. Consistent with our results, Fine et al. (Reference FINE, MESONES and COLEY2004) showed that specialist species in an Amazonian forest on white sandy soils (lower nutrient availability) showed a higher survival than those in a forest on clay soils (higher nutrient availability).
On the other hand, dipterocarp species in the mixed dipterocarp forests (i.e. fertile and moderately nutrient-poor sites) did not significantly differ in shade-tolerance (Table 2) despite the considerable difference in nutrient availability, especially for P. This pattern was in accordance with the results of previous studies (Dent & Burslem Reference DENT and BURSLEM2009, Palmiotto et al. Reference PALMIOTTO, DAVIES, VOGT, ASHTON, VOGT and ASHTON2004). It is widely known that soil P availability is an important factor limiting tree growth and forest productivity in tropical forests (Kitayama et al. Reference KITAYAMA, NOREEN and SHINICHIRO2000, Paoli & Curran Reference PAOLI and CURRAN2007, Vitousek et al. Reference VITOUSEK, PORDER, HOULTON and CHADWICK2010, Walker & Syers Reference WALKER and SYERS1976). The results of this study suggest that reduced P availability does not strongly influence shade-tolerance of dipterocarp species because the survival at low light did not differ between the fertile and the moderately nutrient-poor sites, which greatly differ in P availability. The question why species in infertile mixed dipterocarp forests do not show greater shade-tolerance remains unclear. This question needs to be investigated in further studies.
Greater shade-tolerance was associated with a higher root weight ratio, a slower leaf production and a higher foliar C concentration among the canopy tree species in three Bornean rain forests (Figure 2, Table 3). Previous studies demonstrated the same relationship between these traits and shade-tolerance among sympatric tree species or between pioneer and shade-tolerant species (Aiba & Nakashizuka Reference AIBA and NAKASHIZUKA2007, Canham et al. Reference CANHAM, KOBE, LATTY and CHAZDON1999, Kitajima Reference KITAJIMA1994, Walters & Reich Reference WALTERS and REICH1999). A higher root weight ratio, a slower leaf turnover and a higher foliar C concentration can enhance shade-tolerance via minimizing C loss under shaded conditions (Walters & Reich Reference WALTERS and REICH1999). Higher allocation to roots may allow plants to reduce the risk of biomass loss caused by herbivores and fallen debris (Aiba & Nakashizuka Reference AIBA and NAKASHIZUKA2007). Producing new leaves inevitably involves a high respiration rate, causing a certain C loss under shaded conditions (Kobe Reference KOBE1997). In addition, a higher C concentration in leaves may indicate a higher C allocation to structural and/or defensive compounds (Sterner & Elser Reference STERNER and ELSER2002). High allocation to structural and defensive compounds such as cell walls and phenols allows plants to minimize C losses caused by biological and physical damage (Fine et al. Reference FINE, MILLER, MESONES, IRAZUZTA, APPEL, STEVENS, SÄÄKSJÄRVI, SCHULTZ and COLEY2006). The positive correlation between foliar C concentration and shade-tolerance (Figure 2g, Table 3) may support this idea. Our results showed that the factor (minimizing C losses) might be the important drivers that underlie the interspecific variation in shade-tolerance not only among co-occurring species but also across the 13 species growing in the forests with contrasting nutrient availabilities.
Furthermore, these C-conservation traits (i.e. a higher root weight ratio, a slower leaf turnover and a higher foliar C concentration) were found in the most nutrient-impoverished environment in this study (Table 2); this suggests that these traits are adaptive also to nutrient impoverishment and is in accordance with the reviews by Chapin (Reference CHAPIN1980) and Craine (Reference CRAINE2009). We suggest that the dominant species in the tropical heath forests showed the greatest survival in shaded conditions because the traits for nutrient impoverishment had the same C-conservation mechanism as the traits to shade did.
We demonstrated that the difference in survival at high light among the sites was not significant (Table 2) and did not correlate with any of the functional traits (Table 3). These results suggest that different mechanisms underlie the interspecific variation in survival at high and low light. This is not surprising because traits for enhancing shade-tolerance may not be important for plants in high-light conditions, where the plants can amply assimilate C. Factors underlying the interspecific variation in survival at high light were not elucidated (Table 3). It remains unclear what is the major driver for the interspecific variation in survival at high light. Future studies should focus on this question to understand the mechanisms regulating population dynamics of tree juveniles.
Our study demonstrated that adaptations to nutrient impoverishment and shade were intricately related with each other via C-conservation mechanisms in juvenile trees of Bornean tropical rain forests. The dynamics and structure of tropical rain forests may thus be influenced by soil-nutrient availability via effects on shade-tolerance of canopy tree species.
ACKNOWLEDGEMENTS
We thank Erik, L. Ajon, P. Lagan, N. Imai, T. Seino and K. Miyamoto for assisting our fieldwork and providing valuable suggestions. Permission to conduct our research was granted by the Sabah Parks and Sabah Forestry Department. This study was supported by the grant-in-aid from the Japanese MESSC (22255002) to K.K. and by the Global Environment Research Fund D-1006 & I-1403 of the Ministry of the Environment, Japan, to K.K.
APPENDICES
Relative photosynthetic photon flux density (relative PPFD) (mean ± SE) at the three levels of global site factor (GSF) in the tropical heath forest of Nabawan. The number of observation (N) is also shown. Hemispherical photographs were taken at the top of each censused sapling to calculate GSF. To determine relative PPFD at the points where the hemispherical photographs were taken, we measured PPFD at the top of each censused sapling (A) and under the open sky (B) at the same time using the two quantum sensors (Apogee MQ-100). Relative PPFD was calculated as the measurements of sensor A divided by the ones of sensor B.
Coefficients of multiple linear models for estimating biomass allocations by global site factor (GSF), diameter at ground height (DGH) and the interaction of GSF and DGH (GSF:DGH) for the 13 tree species in the three Bornean rain forests; fertile, the Tawau Hills Park; moderately nutrient-poor, the Deramakot Forest Reserve; severely nutrient-poor, Nabawan. Sample numbers (N), the ranges of GSF and DGH of the saplings used for the models, coefficients of determination (R2) are also shown.
Coefficients, standard error (SE), z values (z) and P values (P) of the best-fit generalized linear mixed model (GLMM) with the binomial error distribution to estimate the probability of survival for the 13 tree species in the three Bornean rain forests; fertile, the Tawau Hills Park; moderately nutrient-poor, the Deramakot Forest Reserve; severely nutrient-poor, Nabawan. The best-fit model was determined as the model with the minimum AIC. Equations of the full and the best fit model are as follow: Probability of survival ~ DGH (diameter at ground height) + GSF (global site factor) + Species (13 species) + Interaction of DGH, GSF and species for the full model (AIC = 725.5), and Probability of survival ~ DGH + Species + GSF:Species for the best fit model (AIC = 720.6).
Probability of survival and functional traits (biomass allocation, leaf dynamics and leaf chemistry) at each light condition (low and high) for the 13 tree species in the three Bornean rain forests; fertile, the Tawau Hills Park; moderately nutrient-poor, the Deramakot Forest Reserve; severely nutrient-poor, Nabawan