Implications
The lean and fat chicken lines are unique and ideal animal model for chicken lipid metabolism studying. Our results inspire that 4 weeks of age is a more important stage on chicken liver lipogenesis compared to 1 week and 7 weeks of age. The difference of glycometabolism could be another potential reason for the fat and lean phenotype occurrence besides the difference of lipogenesis in chicken liver.
Introduction
Chicken is a key model organism for fundamental biology, as well as many agricultural research applications. The meat and eggs produced from chicken are also important protein sources throughout the world. The increasing demand for high-quality protein in the developing world is expected to be one of the most significant trends in the future of agriculture. The modern commercial broiler is the product of intensive selection over many generations for rapid growth and enhanced muscle mass. The growth rate of commercial broilers has changed tremendously. Associated with these successes there have been an increase in the incidence of congenital disorders, such as ascites and lameness, reduced fertility, and reduced resistance to infectious diseases (Burt, Reference Burt2002). Excessive fat is one of the principal problems faced by the broiler industry nowadays, since it does not only reduce carcass yield and feed efficiency, but also cause rejection of the meat by the consumers (Kessler et al., Reference Kessler, Snizek and Brugalli2000) and difficulties in processing (Chambers, Reference Chambers1990).
It will result in healthier flocks with fewer diseases in chicken if we can improve understanding of gene expression and regulation of lipid metabolism. Additionally, a better knowledge of the chicken fatness ontogenesis will be an enormous benefit to chicken research communities as well as researches that use the chicken as a model organism for developmental biology and human therapeutics.
In chicken, lipogenesis occurs essentially in the liver, in which much of the triglycerides (TGs) that accumulate in avian adipose tissue are synthesized (O’Hea and Leveille, Reference O’Hea and Leveille1968; Griffin et al., Reference Griffin, Guo, Windsor and Butterwith1992). Thus, liver is considered as one of the most important organ involved in lipid metabolism. Many studies have been performed to investigate the differential expression of genes involved in lipid synthesis and secretion in the liver of lean and fat chickens (Daval et al., Reference Daval, Lagarrigue and Douaire2000; Carre et al., Reference Carre, Bourneuf, Douaire and Diot2002; Bourneuf et al., Reference Bourneuf, Hérault, Chicault, Carré, Assaf, Monnier, Mottier, Lagarrigue, Douaire, Mosser and Diot2006). Because most of these researches were performed at 8 weeks of age only, few studies were conducted to analyze the temporal expression of genes in the liver, so the genetic mechanisms that are involved in adiposity during the developmental stage are largely unknown.
In order to further characterize the mechanisms and genes leading to adiposity, cDNA microarray analyses were developed to construct gene expression profile and screen differentially expressed (DE) genes in the liver at different developmental stages between lean and fat lines. This study will be beneficial in elucidating the molecular mechanism of lipid metabolism in chickens.
Material and methods
Lean and fat lines of chickens
The Northeast Agricultural University (NEAU) broiler lines divergently selected for abdominal fat content (NEAUHLF) in lean and fat chicken lines (Wang et al., Reference Wang, Li, Wang, Zhang, Wang, Wang and Wang2007a) derived from a commercial Arbor Acres grandsire line were created at the NEAU Animal Breeding Center in 1996. The two lines chicken has been selected divergently using percentage of abdominal fat weight (%AFW) and plasma very low-density lipoprotein (VLDL) concentration as selection criteria. Birds, which have lower (lean line) or higher (fat line) plasma VLDL concentration and percentage of abdominal fat (AFP) than that of the groups average, were selected as candidates of breeders to reproduce offspring, considering the body weight (BW) of male birds and egg production of female birds. Birds were kept in similar environmental conditions and had access to feed and water ad libitum, and fed with commercial corn-soybean-based diet that met all National Research Council requirements (National Research Council, 1994). From hatch to 3 weeks of age, birds received a starter feed (3000 kcal ME/kg and 210 g/kg CP) and from 4 weeks of age to slaughter, they were fed with a grower diet (3100 kcal ME/kg and 190 g/kg CP). Plasma VLDL concentration were measured for all birds at 7 weeks of age. Abdominal fat weight (AFW) of the male birds in the first hatch was measured and adjusted (%AFW) for BW after slaughtered at 7 weeks of age. The detailed description of the selection history could be found in Wang et al. (Reference Wang, Li, Leng, Wang, Tang, Li and Zhang2007b).
Sample preparation
Birds were slaughtered at 1, 4 and 7-week-old, respectively; liver was isolated, and then immediately frozen in liquid nitrogen and conserved at −80°C. Total RNA was isolated using the Trizol reagent (Invitrogen, Carlsbad, CA, USA) and quantified by spectrophotometer. mRNA was isolated using Oligotex mRNA Mini Kit (QIAGEN, Valencia, CA, USA). cDNA was prepared by oligo-dT-primed reverse transcription reaction using Superscript II (Life Technologies, Inc., Carlsbad, CA, USA). Labeled cDNA probes were prepared using CyScribe GFX Purification Kit (Amershan Biosciences, Uppsala, Sweden) according to the manufacturer’s protocol.
Microarray and experiment design
cDNA microarrays, containing 9024 chicken cDNA fragments, 192 housekeeping genes and negative controls, were purchased from Beijing Genomics Institute, China. Every sequence was printed triply on the chip. Total RNA was extracted from 300 mg bulk liver tissue and quantified by spectrophotometry. mRNA isolation and cDNA preparations were according to the manufacturer’s protocol. In this study, two fat line and two lean line birds in each week were used and a reference RNA was used which was a RNA pool made from equal amount of total RNA from chicken liver and muscle RNA. Both line chickens were labeled with Cy3 and the reference RNA were labeled with Cy5. Both fat line and lean line chickens were hybridized with the same reference RNA. The ratio between fat line chicken and the reference were recorded as F/R, and the ratio between lean line chicken and the reference were recorded as L/R. Therefore, the DE genes between two chicken lines (F/L) could be screened out indirectly, by comparing every ratio of F/R with L/R. Schematic experimental design is shown in Figure 1.
The design of microarray experiment,  indicates the labeling of RNA with Cy3,
 indicates the labeling of RNA with Cy5, R represent reference RNA, which is the RNA pool of liver and muscle. DE genes are the differentially expressed genes between fat and lean line chickens.

Microarray hybridization and scanning
Before hybridization, microarrays were prehybridized in hybridization buffer (5 × saline-sodium citrate, 0.2% SDS, 5 × Denhardt’s solution, 50% (vol/vol) formamide, 0.2 mg/ml bovine serum albumin) at 42°C for 1 h. After prehybridization, slides were rinsed twice in Millipore filtered water, once in isopropanol and then dried by centrifugation (2 min, 470 g). Cy3- and Cy5-labeled cDNA probes were purified using Microcon 30 (Millipore, Billerica, MA, USA), and then mixed at a ratio of 1 : 1 by volume. The final volume was adjusted to 32 ul with hybridization buffer. After heating at 100°C for 2 min, the probes were added to the array and covered with a 24 × 60 mm coverslip. The array chip was placed in a sealed hybridization chamber, and the hybridization was performed overnight at 42°C. After hybridization, slides were washed at room temperature first in 1 × SSC/0.1% SDS (5 min), subsequently in 0.1 × SSC/0.1% SDS (5 min), and lastly in 0.1 × SSC (1 min), and then dried by centrifugation (2 min, 470 g). The arrays were then immediately scanned using an Axon4100A scanner (Axon Instruments Inc., Union City, CA, USA).
Data normalization
The scanned images were analyzed using GenePix Pro3.0 software (Axon Instruments, Union City, CA, USA). The net fluorescent signal at each spot from Cy5 and Cy3 dyes were compared. Automatic and manual flagging were used to locate absent spots, which were then excluded from analysis. In addition, very weak spots, with a mean of Cy3 and Cy5 signals lower than twice of the mean background, were also excluded from data analysis. The signal from each spot was calculated as the average intensity of the spot minus the background. Average spot intensities were collected for each individual spot and stored for further data processing in Microsoft Excel.
Identification of DE genes
DE genes were identified from normalized data using significance analysis of microarrays (SAM) algorithm (Tusher, et al., Reference Tusher, Tibshirani and Chu2001) implemented in TIGR MultiExperiment Viewer (http://www.tm4.org/mev.html). SAM identifies statistically significant genes by carrying out gene specific t-tests; this analysis uses non-parametric statistics, since the data may not follow a normal distribution. In this method, repeated permutations of the data are used to determine if the expression of any gene is significant related to the response. The use of permutation-based analysis accounts for correlations in genes and avoids parametric assumptions about the distribution of individual genes. This is an advantage over other techniques. According to the SAM algorithm, a score was assigned to each gene on the basis of its change in gene expression relative to the standard deviation of repeated measurements for that gene. A gene was called significant if its score surpasses a threshold as explained below. SAM calculates a false discovery rate (FDR), which is the median percentage of genes that are likely to be identified as significant change by chance. FDR is presented as a q value for each gene in the final list of significant genes. The threshold can be adjusted to identify different sets of putatively significant genes and the FDR is changed accordingly.
Real-time quantitative RT-PCR
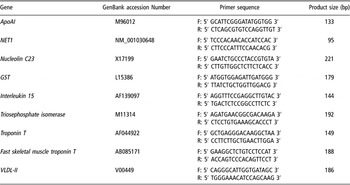
Oligonucleotide primers were designed to amplify a cDNA fragment spanning two exons intervened by a large intron in genomic sequence in order to prevent the amplification of contaminated genomic DNA if any. Glyceraldehyde-3-phosphate dehydrogenase (GAPDH) was considered to be a stably expressed housekeeping gene and was used as an internal reference. The sequences of the primers used for gene expression and the sizes of their products are shown in Table 1.
Primer pairs used to analyze gene expression by quantitative RT-PCR

cDNA was prepared using an RNA PCR Kit (avian myeloblastosis virus (AMV)) Ver3.0 (Takara, Dalian, China) starting with 500 ng of total RNA. First-strand cDNA synthesis was performed at 42°C for 30 min. The 10 μl of reaction mixture also contained 1 × AMV reaction buffer, 1 mM each dNTP, 0.125 pmol oligo-dT-adaptor primer, 5 mM MgCl2, 10 U RNase inhibitor, and 2.5 U AMV reverse transcriptase XL. After incubation, the mixture was heated at 99°C for 5 min to terminate the reaction. Relative quantification of the expression of selected genes was performed using SYBR® Premix Ex TaqTM (Takara, Dalian, China). The reaction mixtures were incubated in an ABI Prism 7300 Sequence Detection System (Applied Biosystems, Foster City, CA, USA) programmed to conduct melting at 95°C for 10 s and then 40 cycles at 95°C for 5 s and 60°C for 31 s. The dissociation curves were analyzed using Dissociation Curve 1.0 software (ABI) for each PCR reaction to detect and eliminate possible primer-dimer artifacts. Results (fold changes) were expressed as 2−ΔΔCt with ΔΔCt = (Ctij − CtGAPDHj) − (Cti1 − CtGAPDH1), where Ctij and CtGAPDHj are the Ct for gene i and for GAPDH in a pool or a sample (named j), and Cti1 and CtGAPDH1 are the Ct in pool 1 or sample 1, expressed as the standard.
Result
Differences in fat deposits and growth between two chicken lines
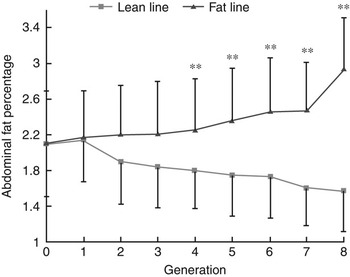
NEAUHLF have been selected using %AFW and plasma VLDL concentration as selection criteria. From G1 to G8, birds of each line were raised in two hatches and AFW of the male birds in the first hatch was measured and adjusted (%AFW) for BW after slaughtering at 7 weeks. The number of fat line chickens from G1 to G8 was: 82, 88, 75, 81, 80, 78, 179, 165, respectively; and lean line chickens from G1 to G8 was: 124, 133, 127, 141, 139, 145, 258, 219, respectively (G represents generation). It is clear that the percentage of abdominal fat between two lines were separated greatly after eight generations of selection (Figure 2). In the eighth generation, the AFP in fat chicken line is 2.95%, while it is 1.55% in lean line chicken. The chickens used in the study were chosen by their percentage of abdominal fat.
The separation of percentage of abdominal fat (AFP) between fat line and lean line chickens (Means ± s.d.). The lean and fat chicken lines derived from a commercial Arbor Acres grandsire line were created at the Northeast Agricultural University Animal Breeding Center in 1996. The selection criteria were the proportion of abdominal fat and levels of very low-density lipoproptein in males at 7 weeks of age. Significant differences in abdominal fat weight and AFP between the two lines were apparent from the fourth generation. The number of fat line chickens from G1 to G8 was: 82, 88, 75, 81, 80, 78, 179, 165, respectively; and in lean line from G1 to G8 was: 124, 133, 127, 141, 139, 145, 258, 219, respectively. G represents generation. **P < 0.01, significant difference in AFP between the two lines.

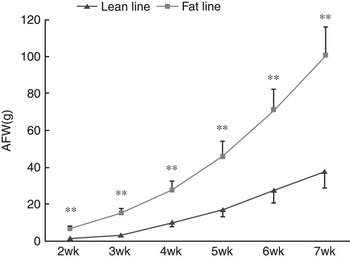
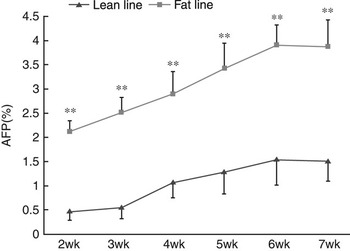
Figures 3 and 4 are the comparisons of AFW and AFP between two chicken lines plotted against their age. At the age of 1 week, there is no adipose tissue visible both in fat line and lean line chickens, but the AFW and AFP were significantly different from 2 weeks of age. The AFW of fat line chickens increased sharply compared to the lean line chickens with increasing age (see Figure 3), while the AFP increased slowly in fat line and the AFP of lean line chickens was kept steady.
The abdominal fat weight (AFW) comparisons of two chicken lines at different weeks (Means ± s.d.). Birds were slaughtered from 1 week of age to 7 weeks of ages, respectively. Abdominal fat was isolated and measured. There is little fat deposition at 1 week of age, so the statistics is start from 2 weeks of age. The number of each line birds is 10 at 1 week and 4 weeks of age, 30 at 7 weeks of age and 5 at other weeks of age (the same as below). **P<0.01, significant difference in AFW between the two lines.

The percentage of abdominal fat (AFP) comparisons of two chicken lines at different weeks (Means ± s.d.). Birds were slaughtered from 1 week of age to 7 weeks of age, respectively. Abdominal fat was isolated and measured and adjusted (percentage of abdominal fat weight) for BW. There is little fat deposition at 1 week of age, so the statistics is start from 2 weeks of age. **P<0.01, significant difference in AFP between the two lines.

Differential gene expression
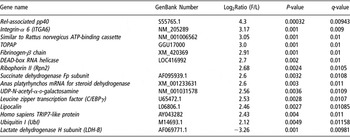
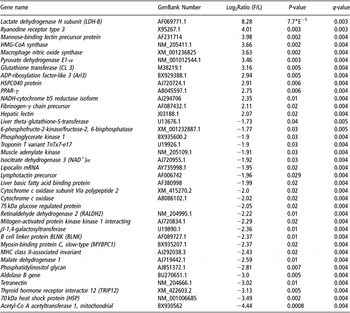
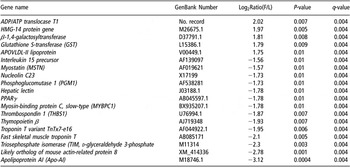
A q-value of 0.05 (FDR = 5.0) was chosen as the screening criteria of significantly different expression standard. This led to the identification of a total of 81 DE genes at 1 week of age, 966 at 4 weeks of age, and 610 at 7 weeks of age. Highly DE genes were further selected by the fold change (fat/lean). Table 2 is a summary of the most representative DE genes at 1 week of age. There seemed no noticeable group formation of these genes. Table 3 is a summary of the most representative DE genes at 4 weeks of age. There were much more DE genes at 4 weeks of age than 1 week of age, and many of the DE genes were related to lipogenesis and glucolysis, such as liver basic fatty acid (FA) binding protein, malate dehydrogenase, acetyl-Co A acetyltransferase 1, HMG-CoA synthase, pyruvate dehydrogenase E1α , isocitrate dehydrogenase 3 (NAD+)α , lactate dehydrogenase H subunit (LDH-B) etc. The number of DE genes in the liver between two chicken lines at 7 weeks of age was 610, less than the DE genes at 4 weeks of age, but much more than that at 1 week of age. These genes were involved in lipid metabolism and energy metabolism, including VLDL-II, apolipoprotein AI (ApoAI), peroxisome proliferator-activated receptor-γ (PPARγ), glutathione-S-transferase (GST), phosphoglucomutase 1, troponin T, etc (see Table 4).
Summary of differentially expressed genes between two chicken lines at 1 week of age

Note: positive value means the gene was upregulated in fat v. lean and similarly a negative number means the gene was downregulated in fat v. lean. P-value: methods based on conventional t tests provide the probability (P) that a difference in gene expression occurred by chance. q-value: SAM calculates a false discovery rate (FDR), which is the median percentage of genes that are likely to be identified as significantly changed by chance.
Summary of differentially expressed genes between two chicken lines at 4 weeks of age

Note: positive value means the gene was upregulated in fat v. lean and similarly a negative number means the gene was downregulated in fat v. lean.
Summary of differentially expressed genes between two chicken lines at 7 weeks of age

Note: positive value means the gene was upregulated in fat v. lean and similarly a negative number means the gene was downregulated in fat v. lean.
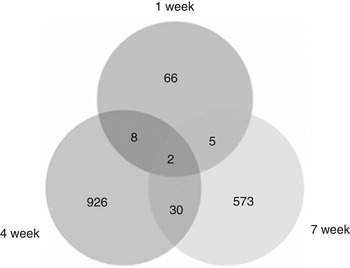
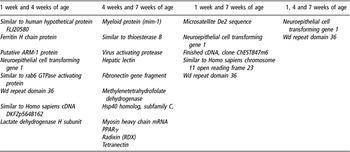
Furthermore, the DE genes were analyzed and shown in Figure 5. The results revealed that there were great differences in the quantity of DE genes among these three developmental stages, eight genes were found to be DE at both 1 week and 4 weeks of ages, five genes at both 1 week and 7 weeks of age, and 30 at both 4 weeks and 7 weeks of age. Only two genes were found to be expressed differentially at 1, 4 and 7 weeks of age. These results were shown in Table 5.
Differentially expressed genes in different ages between two chicken lines. A total of 81 genes at 1 week of age, 966 genes at 4 weeks of age and 610 genes at 7 weeks of age were differentially expressed between two lines. Eight genes were found to be differentially expressed at both 1 week and 4 weeks of age, five genes at both 1 week and 7 weeks of age, and 30 at both 4 weeks and 7 weeks of age. Only two genes were found to express differentially at 1, 4 and 7 weeks of ages.

Summary of genes differentially expressed between two lines in more than two time points

Validation of gene expression data by quantitative real-time PCR
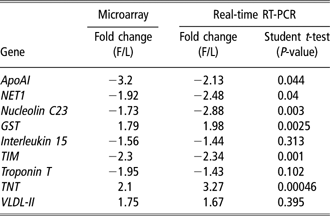
To validate the microarray results, we performed quantitative real-time PCR for 10 genes that were DE at 7 weeks of age. These genes were selected randomly. We actually targeted more than 20 genes and designed primers for these genes, but only 10 pairs of primers (corresponding 10 genes) met the requirement of real-time RT-PCR. GAPDH was used as an internal reference gene. Table 6 shows the comparison between the microarray and real-time RT-PCR results.
Comparison of microarray and real-time RT-PCR analyses
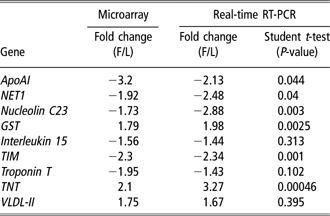
Note: positive value means the gene was upregulated in fat v. lean and similarly a negative number means the gene was downregulated in fat v. lean.
Discussion
Because de novo FA synthesis in birds takes place mainly in the liver, most studies have been performed on hepatic tissues. The expression of some genes involved in lipid synthesis and secretion has been analyzed in the liver of lean and fat chickens. Bourneuf et al. (Reference Bourneuf, Hérault, Chicault, Carré, Assaf, Monnier, Mottier, Lagarrigue, Douaire, Mosser and Diot2006) used a cDNA microarray to analyze the expression of genes in the liver that are involved in pathways and mechanisms leading to adiposity, and found some genes DE between lean and fat chickens. Their research indicated that the mechanisms involved in the expression and regulation of lipogenic genes could play a key role in the ontogenesis of fatness in chickens from lean and fat lines.
In birds, lipogenesis (the conversion of glucose to TGs) takes place primarily in the liver, whereas the adipocyte serves as the storage site for TGs (Cogburn et al., Reference Cogburn, Wang, Carre, Rejto, Aggrey, Duclos, Simon and Porter2004). Hepatic lipogenesis plays a direct role in the accumulation of lipid in the avian adipocyte, and 80% to 85% of the FAs stored in adipose tissue are generated through lipogenesis in the liver or from the diet (Richards et al., Reference Richards, Poch, Coon, Rosebrough, Ashwell and McMurtry2003).
The two chicken lines displayed great difference in the abdominal fat at 7 weeks of age after eight generations of selection (see Figure 2). There was little adipose tissue were observed at 1 week of age and the gene expression profiles of the liver tissue at this stage showed that the DE genes between two chicken lines were less than those at 4 weeks and 7 weeks of age, and these genes could not be grouped according to their metabolic pathway. There were many transcription factor genes DE between these two lines at 1 week of age, such as C/EBPγ , ATP-binding cassette, DEAD-box RNA helicase, etc. and the genes involved in glucolysis, including lactate dehydrogenase H subunit (LDH-B), succinate dehydrogenase Fp subunit, UDP-N-acetyl-α- d-galactosamine, etc. After all, as it is a short time since hatch, the organism adapts itself to the exosomatic environment, and the major metabolic adjustment that a hatchling chick must undergo is the switch between energy sources from lipids (mainly stored yolk) to, utilization of its ingested food, mainly convert dietary carbohydrates and protein into fat stores (Noy and Sklan, Reference Noy and Sklan2001). Early hepatic expression of several lipogenic enzymes provides the chick with the ability to convert dietary carbohydrate into fat stores (Speake et al., Reference Speake, Murray and Noble1998), but the liver lipogenesis at this time may be low. Along with the development of the birds, the capability of liver in lipogenesis become more and more powerful, and the adipose deposit increases in both fat line and lean line chickens (see Figures 3 and 4). From the age of 2 weeks, the AFP of two chicken lines became significantly different. The gene expression profile of the liver tissue at 4 weeks of age revealed that more than 900 genes were DE between two chicken lines, and many of these genes were involved in lipid metabolism, such as acetyl-Co A acetyltransferase 1 , malate dehydrogenase 1 , pyruvate dehydrogenase E1α, liver basic FA binding protein, lipocalin, cytochrome c oxidase subunit VIa polypeptide 2, etc. and in glycometabolism, such as β-1,4-galactosyltransferase, 75 kDa glucose-regulated protein, isocitrate dehydrogenase 3 (NAD+)α, lactate dehydrogenase H subunit (LDH-B), and so on. Acetyl coenzyme A carboxylase, the first enzyme in the FA synthesis pathway, is a rate-limiting enzyme for FA synthesis (Majerus and Kilburn, Reference Majerus and Kilburn1969). The recognition of the essential metabolic role of the enzyme in FA biosynthesis prompted numerous investigations into acetyl-CoA carboxylases from different sources (Schneiter et al., Reference Schneiter, Guerra, Lampl, Tatzer, Zellnig, Klein and Kohlwein2000; Rosa et al., Reference Rosa, Manco, Vega, Greco, Castagneto, Vidal and Mingrone2003; Zhang et al., Reference Zhang, Yang, Shen and Tong2003). Malic enzyme is a cytoplasmic protein (l-malate-NADP+ oxidoreductase) (decarboxylating), which catalyzes the oxidative decarboxylation of malate to pyruvate and CO2, simultaneously generating NADPH from NADP+. In liver, the primary site for the de novo synthesis of long-chain FAs in birds, the most of the NADPH required for this process is furnished via malic enzyme (Wakil et al., Reference Wakil, Stoops and Joshi1983; Volpe and Vagelos, Reference Volpe and Vagelos1973). It is reported that the malic enzyme activity is positively correlated with abdominal fat proportion (Grisoni et al., Reference Grisoni, Uzu, Larbier and Geraert1991), whereas in this study, both acetyl CoA carboxylase and malate dehydrogenase were downregulated in fat line chickens. This may not preclude a major involvement of these factors in regulating lipid metabolism in chicken, and further work on their protein expression is needed to better understand the metabolism of liver. The abdominal fat continued to increase from 5 weeks to 7 weeks of age, the gene expression profiles of 7 weeks of age showed about 600 DE genes in the liver tissue between two chicken lines. Some important genes implicated in lipid metabolism and energy metabolism were identified, such as VLDL-II, ApoAI, PPARγ, triosephosphate isomerase, myostatin etc. ApoAI is a lipid-binding protein that participates in the transport of cholesterol and other lipids in the plasma. It is a major protein component of plasma high-density lipoprotein in all species, and plays an important role in cholesterol homeostasis (Bhattacharyya et al., Reference Bhattacharyya, Chattapadhyay, Oddoux and Banerjee1993). In our previous study (Wang et al., Reference Wang, Li, Wang, Wang, Han and Shi2006), ApoAI were found to be DE in adipose tissue between broilers and layers. Bourneuf et al. (Reference Bourneuf, Hérault, Chicault, Carré, Assaf, Monnier, Mottier, Lagarrigue, Douaire, Mosser and Diot2006) found the expression level of ApoAI in fat lean was higher than lean line chickens, but the results of real-time RT PCR was not consistent with the microarray results. Taking these reported results and our present data into consideration; we presumed that ApoAI is worthwhile for further study.
PPARγ is a member of the nuclear hormone receptor superfamily of ligand-activated transcription factors that have central roles in regulating adipocyte differentiation, cell growth, and inflammation (Guan et al., Reference Guan, Zhang and Breyer2002). PPARγ is expressed predominantly in adipose tissue, and its expression is induced very early in the adipocyte differentiation process (Tontonoz et al., Reference Tontonoz, Hu, Graves, Budavari and Spiegelman1994). In contrast to adipose tissues or cells, the expression of PPARγ in the liver is very low. PPARγ is normally expressed in both human and murine liver at only 10% to 30% of the level in adipose tissue (Tontonoz et al., Reference Tontonoz, Hu, Graves, Budavari and Spiegelman1994; Peters et al., Reference Peters, Rusyn, Rose, Gonzalez and Thurman2000). The function of PPARγ in the liver is not clear. Gavrilova (2003) reported that the liver PPARγ regulates TG homeostasis, contributing to hepatic steatosis, but protecting other tissues from TG accumulation and insulin resistance (Gavrilova et al., Reference Gavrilova, Haluzik, Matsusue, Cutson, Johnson, Dietz, Nicol, Vinson, Gonzalez and Reitman2003). Matsusue et al. (Reference Matsusue, Haluzik, Lambert, Yim, Gavrilova, Ward, Brewer, Reitman and Gonzalez2003) reported that hepatic PPARγ plays a critical role in the regulation of TG content and in the homeostasis of blood glucose and insulin resistance in steatotic diabetic mice. PPARγ is absolutely required for differentiation of preadipocytes to mature adipocytes in adipose tissue. In this study, PPARγ was found to be DE in liver tissue between the two lines both at 4 and 7 weeks of age, which suggested that in liver PPARγ may play an important role in chicken lipid metabolism.
Glucose and FAs are the two main metabolic substrates oxidized by animals for energy production. In humans, glucose was shown to decrease the mobilization of fat stores by both inhibiting lipolysis and stimulating primary reesterification, and the stimulation of primary reesterification is dependent upon the rate of glucose infusion (Wolfe and Peters, Reference Wolfe and Peters1987). The liver may be a pivotal site for glycometabolism and lipid metabolism, since it can store (via glycogen synthesis and lipogenesis) or release glucose (via glycogenolysis and gluconeogenesis), and release lipid fuels (as lipoproteins) (Kotani et al., Reference Kotani, Peroni, Minokoshi, Boss and Kahn2004). In our study, many of the DE genes in the liver were involved in these two biological responses, which suggested that both glycometabolism and lipid metabolism in chicken have a great effect on the occurrences of fat and lean phenotypes in both two lines. However, the interaction of the two processes in chicken liver is unknown and it will be an interesting subject to be investigated.
Conclusion
The gene expression profiles of liver tissue at different developmental stages of chicken (1 week, 4 weeks and 7 weeks of age) were investigated and DE genes between lean and fat chicken lines divergently selected for abdominal fat content for eight generations were screened. Based on our study, we can draw the conclusion that at about 4-week-old broiler displays the exuberant capability of lipogenesis, and there are more DE genes between the two chicken lines at this stage than the other two stages. Another remarkable result is that many of the DE genes in the liver at 4 and 7 weeks of age were related to glycometabolism, which suggested that the differences in glycometabolism could be a potential reason for the fat and lean phenotype occurrence, but further studies are needed to validate this hypothesis.
Acknowledgement
The authors would like to acknowledge the members of the Poultry Breeding Group in the College of Animal Science and Technology at the Northeast Agricultural University for managing the birds and collecting data, and the expert technical support of Harbin Gene-Tech Biochip Developmenting Company. This research was supported by National 973 Project of China (2006CB102105)(No. 2006CB102105), National 863 project of China (No. 2006AA10A120) and Natural Science Foundation Key Project of Hei Longjiang Province (No. ZJN0604-01).