I. INTRODUCTION
With the rapid applications of electromagnetic waves in both civil and military fields, it becomes urgent to design and fabricate microwave absorbers to eliminate the problems of electromagnetic interference (EMI). EMI pollution can induce significant disturbances in relative systems. Reference Tong, Wu, Qiao, Yuan, Guan and Qian1,Reference Tong, Ma, Wu, Hua, Qiao and Qian2 Enormous studies have been attracted to seek suitable electromagnetic wave absorption materials, such as ferrites, Reference Gong, Zhen, Jiang, Xu, Wang and Shao3,Reference Du, Du, Li, Wang, Wang, Wang, Xu and Han4 polymorphous ZnO, Reference Hu, Tong, Wu, Liu, Qian and Hong5,Reference Du, Tong, Tong, Liu and Tao6 soft magnetic metal, Reference He, Qiu, Wang, Liu, Luan, Liu, Itoh and Machida7–Reference Yu, Yao, Zhang, Wang, Li, Han, Wu and Jiang9 and carbon nanotubes. Reference Wu and Kong10–Reference Tong, Liu, Wu, Du and Guan12 Among the candidates for microwave absorbing materials, metallic soft magnetic materials possess many unique features of large saturation magnetization values, Snoek's limit, Curie temperature, and high relative complex magnetic permeability at high frequency ranges. Reference He, Qiu, Wang, Liu, Luan, Liu, Itoh and Machida7,Reference Tong, Hu, Wu, Li, Qian and Liang13,Reference Sun, Dong, Cao, Wei and Hu14 Therefore, it is always possible to make thin absorbers using soft magnetic materials as fillers. As one of the typical example of soft magnetic materials, Ni has been attracted great attentions with different structures of micro and/or nanometers in the area of microwave absorption. Gao Reference Gao, Qiao, Wang, Liu, Li, Feng and Xue15 found that the minimum reflection loss (RL) of Ni nanowires reaches −8.5 dB at 10 GHz and the absorption range under −5 dB is from 8.5 to 12.5 GHz with the sample thickness of 3 mm. Wang Reference Wang, Zou, Ding, Wu, Wang, Jin and Bi16 synthesized and investigated branchlike and flowerslike Ni samples for microwave absorption purpose. Tong Reference Tong, Hu, Wu, Li, Qian and Liang13 reported octahedral Ni exhibited excellent matching and absorbing properties with a minimum RL value of −37.93 dB at 12.80 GHz. Liu Reference Liu, Zhou, Xie and Deng17 presented that urchinlike Ni owned the minimum RL of −43 dB at about 10 GHz with 2 mm in absorber thickness. The electromagnetic performances of ultrafine Ni fibers were also investigated. Reference Gong, Zhang, Zhang, Yu, Zhang, Wu and Zhang8 It can be found that the morphologies play a vital role on their microwave absorption performances. However, the fabrication processes of the above mentioned materials are complex and costly. To the best of our knowledge, there are no public reports on the preparation of pyramidal nano/microstructures of Ni through a simple solvothermal method.
In this paper, a simple, economic chemical-reduction method was applied to synthesize pyramidal nickel by reduction of NiCl2 with glycerol. It is the first reported of pyramidal nickel obtained with glycerol as solvent and reducer. The growth mechanism of Ni pyramidal structures was discussed. The electromagnetic properties were investigated in the range of 1–18 GHz, and the microwave absorption performance was evaluated according to transmission line theory.
II. EXPERIMENTAL
A. Preparation
All chemicals in this experiment were of analytical grade and without further purification. In a typical procedure, first, a solution was prepared by dissolving 0.005 mol nickel chloride hexahydrate and 0.09 mol sodium hydroxide in 60 mL glycerol, vigorously stirred for 1 h. Second, the mixture solution was transferred into a Teflon-lined stainless-steel autoclave and maintained at 200 °C for 15 h. When the reaction was completed, dark substances were deposited on the bottom of the Teflon cup. The target products were collected and rinsed with distilled water and ethanol for several times and then dried in a vacuum oven at 60 °C for 12 h. In addition, the effects on the morphologies of nickel samples, such as the types of solvent, time, and concentration of sodium hydroxide, were also considered.
B. Characterization
The structural information of the samples was characterized by a powder x-ray diffraction (XRD) method. Diffraction patterns of intensity versus 2θ were recorded using a XD-3 (Beijing Purkinje General Instrument Co. Ltd., Beijing, China) diffractometer equipped with a Cu Kα radiation source (λ = 0.15418 nm) from 20° to 80°, which operated at 36 kV and 20 mA. The morphology of the products was observed using field emission scanning electron microscopy (FESEM; … model JEOL JSM-7001F, Tokyo, Japan) operated at 15 kV. The element composition was carried out by an energy dispersive x-ray spectroscopy (EDS, Oxford Instruments) associated with FESEM. Fourier transform infrared (FTIR) spectra were recorded on a Nicolet iS10 FTIR spectrometer (Tewksbury, MA). The thermogravimetric (TG) was studied by a STA 409/PC simultaneous thermal analyzer (Netzsch, Selb, Germany) from room temperature to 800 °C with a heating rate of 10 °C in flowing air.
The relative permeability (µr = µ − jµ″) and permittivity (εr = ε′ − jε″) during 1.0–18.0 GHz were determined via Agilent N5244A vector network analyzer (Santa Clara, CA). A microwave measurement sample containing 70 wt% of Ni cones and 30 wt% wax which was considered as binder was pressed into a ring with the outer diameter of 7.00 mm, the inner diameter of 3.04 mm, and the thickness of 2 mm. The relative complex permittivity (εr = ε′ − jε″) and permeability (μr = μ′ − jμ″) of the mixture were evaluated in the frequency range of 1–18 GHz by measuring the reflection coefficient S 11 and the transmission coefficient S 21.
III. RESULT AND DISCUSSION
A. Structural and morphological characterization
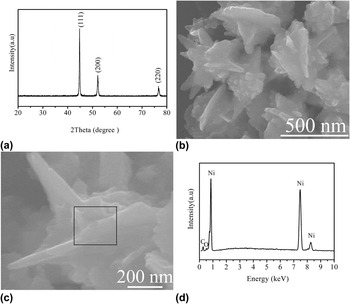
The pyramidal Ni sample obtained at 200 °C for 15 h in 60 mL glycerol is characterized by XRD, as shown in Fig. 1(a). The diffraction peaks can be indexed to the fcc structure Ni (JCPDS 04-0850, α = 3.524 Å), Reference Ni, Zhao, Zheng, Li, Song, Zhang and Zhang18 indicating that single phase of nickel can be obtained under such condition.
(a) XRD pattern and (b) low-magnification, (c) high-magnification FESEM images of as-synthesized pyramidal Ni; (d) EDS pattern of the marked area in (c).

The field emission scanning electron microscopy (FESEM) images of the obtained products with different magnifications are presented in Figs. 1(b) and 1(c). Figure 1(b) is the overall morphology of the sample, which indicates the as-prepared products consist of pyramidal superstructures with the average diameter of about 1–2 μm. The magnified SEM image in Fig. 1(c) indicates that the superstructures comprise dozens of cones radiating from the center. The length of cone ranges from 200 to 600 nm. EDS spectrum of as-prepared Ni samples was shown in Fig. 1(d). EDS analysis of the prepared products confirms the Ni element, consistent with the XRD results. The occurrence of C peak in the EDS spectrum comes from the carbon conductive tape for supporting the samples during the test or some organic derivant products.
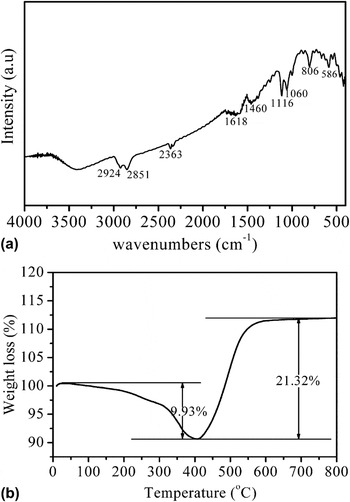
FTIR technique is used to detect the surface state of Ni cones, as shown in Fig. 2(a). The emerged peaks at 2924 and 2851 cm−1 are the vibration of C–H bond in a methyl group. Reference Carenco, Boissière, Nicole, Sanchez, Le Floch and Mézailles19 The absorption centered at 1618 cm−1 is corresponding to the hydrogen bonded O–H stretching. The bands at 1462 cm−1 is ascribed to the symmetric stretching vibration of carboxyl group. Reference Chen, Deng, Zhu, Chen, Sun, Ma and Yang20 The appearance of adsorption peak at 1116 cm−1 is ascribed to the C–O–H stretching vibration. The occurrence at 806 cm−1 is attributed to the C–H out-of-plane ring deformation vibration. The absorptions of 586 cm−1 is contributed to the vibrations of Ni–O bonds. Reference Wang, Jiao and Chen21 From above analysis, we can deduce that there are organic derivant and NiO on the surface of Ni cones. The oxidization stability of pyramidal Ni has also been characterized with TG [Fig. 2(b)]. The TG curve of Ni indicates that there are one weight loss and one weight gain. The drop of approximately 9.93% from room temperature to 390 °C is attributed to the removal of absorbed H2O, glycerol and pyrolysis of organics on the particle surface. Reference Wang, Jiao and Chen21 The weight gain of 21.32% is due to the oxidation of Ni to NiO, started at 390 °C and stopped at 680 °C. It can be calculated that the Ni content is approximately 70.45% in the as-prepared Ni cones. The pyramidal Ni presents better oxidization stability than that of previously reported papers. Reference Wang, Jiao and Chen21,Reference An, Pan and Zhang22
(a) FTIR pattern and (b) TG curve of the as-received Ni products.

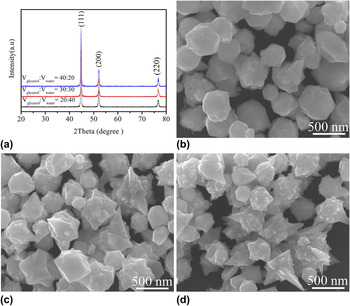
In liquid chemistry reaction systems, solvent plays a crucial role in determining the morphology of final products. Reference Guan, Liu, Xu, Sun and Zhang23,Reference Zhao, Zhang, Xing, Song, Yu, Shi, Guo, Yang, Lei and Cao24 In this work, amounts of water are introduced in the polyol reduction system. It is revealed that the volume ratios of glycerol to water have a great effect on the morphology of the obtained products, while the total of amount of solvents is kept at 60 mL. Figure 3(a) shows that the as-received products at various volume ratios of glycerol to water are all metallic nickel. When the volume ratio of glycerol to water is 20:40, the resultant product presents irregular polyhedron structures, along with some quasi-microspheres [Fig. 3(b)]. With increasing the volume ratio to 30:30, the final products consist of irregular polyhedron and a minor amount of pyramidal structures [Fig. 3(c)]. When the volume ratio is further increased to 40:20, the obtained products mostly exhibit pyramidal structures [Fig. 3(d)]. From above analysis, it can be noted that the shapes of final products transform from irregular polyhedrons to pyramidal structures by increasing the amount of glycerol. Solvent can influence the reactivity, diffusion, and solubility behavior of the reagents, and thus influence the growth and morphologies of final products. The viscosity ranking of water and glycerol is υwater < υglycerol, to some extent, higher viscosity can slow down the growth rate and benefit the isotropic growth. Reference Zhao, Zhang, Xing, Song, Yu, Shi, Guo, Yang, Lei and Cao24 On the other hand, glycerol with higher viscosity restrained the diffusion of Ni nuclei and resulted in the formation of pyramidal crystals. Reference Ni, Zhang, Song and Zheng25
(a) XRD patterns and (b–d) SEM images of the products obtained from the solvent with different volume ratios of glycerol to water: (b) 20:40, (c) 30:30, (d) 40:20.

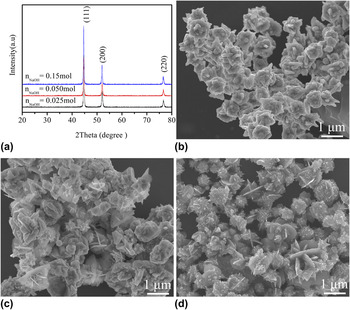
In addition, the volume ratios of glycerol to water and the amounts of NaOH have significant effects on morphologies of the final Ni products. The XRD pattern in Fig. 4(a) reveals that the obtained products are single phase of metallic Ni under different concentrations of NaOH. The SEM images in Fig. 4(b)–4(d) show typical morphologies of three samples obtained at different alkali concentrations with the other reaction conditions constant. At a low NaOH concentration of 0.025 mol, the product exhibits quasiflowerlike crystallites with average diameter of 1–2 μm [Fig. 4(b)]. When the NaOH concentration reached 0.05 mol, the product consisted of irregular granules and flowerlike crystallites [Fig. 4(c)]. When the NaOH concentration was further increased to 0.15 mol, the product becomes a mixture of urchinlike and flowerlike Ni particles [Fig. 4(d)]. When NaOH concentration is 0, the Ni2+ ions still could not be reduced by glycerol even though reaction time is prolonged up to 48 h (not shown here). It is confirmed that NaOH has two meaningful roles during the polyol reduction process. Reference Guan, Liu, Xu, Sun and Zhang23,Reference Joseyphus, Matsumoto, Takahashi, Kodama, Tohji and Jeyadevan26 On the one hand, the reducing ability of polyol can be enhanced with increasing alkalinity, thus it can accelerate the reduction of metal ions. Reference Ung, Viau, Ricolleau, Warmont, Gredin and Fiévet27 On the other hand, high NaOH concentration can decrease Ni2+ concentration in the solution and subsequently slow down the reduction reaction. The morphology evolution process mentioned above indicates that a suitable NaOH concentration can effectively control the producing rate of nickel atoms, thus kinetically control the aggregation and growth of the nickel crystallites and further determine the morphology of final products. Reference An, Pan and Zhang22,Reference Ni, Zhao, Zhang, Zhang and Zheng28
(a) XRD patterns and (b–d) SEM images of the as-prepared Ni samples produced at the different concentration of NaOH (b) 0.025 mol, (c) 0.05 mol, (d) 0.15 mol.

B. Dielectric and dynamic magnetic properties
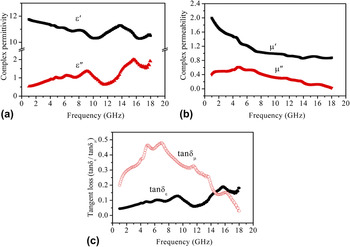
The electromagnetic wave absorption property of materials is generally determined by the complex relative permittivity and permeability as well as the tangent loss (dielectric tangent loss: tanδε = ε″/ε′; magnetic tangent loss: tanδμ = μ″/μ′). The electromagnetic parameters (relative complex permittivity, εr, and relative complex permeability, µr) of the wax composites containing 70 wt% of the pyramidal Ni were measured at the range of 1.0–18.0 GHz for the investigation of electromagnetic (EM) absorption properties of the obtained products. As it is well known, the real permittivity (ε′) and real permeability (μ′) symbolize the storage ability of electromagnetic energy, while the imaginary permittivity (ε″) and imaginary permeability (μ″) are related to the dissipation of electromagnetic energy. Reference Zhou, Hu, Bai, Zhou, Sun, Yan and Chen29 Fig. 5(a) shows the frequency dependence of the real part (ε′) and imaginary part (ε″) of relative complex permittivity (εr = ε′ − jε″) of the composites. The ε′ value is in the range of 10.30–11.76 and the ε″ value is in the range of 0.53–2.01. Compared with the Ni octahedra or hollow microspheres as reported in the literatures, Reference Tong, Hu, Wu, Li, Qian and Liang13,Reference Deng, Liu, Shen, Liu and Hu30 the Ni submicrometer horns have relatively low ε′ values. This is advantageous for keeping a good impedance matching between the composites based on Ni submicrometer horns and free space, thus consequently decreasing the reflection coefficient for EM waves. The real part (μ′) and the imaginary part (μ″) of the relative permeability are plotted as a function of frequency in Fig. 5(b). It indicates that the μ′ values gradually decrease from 2.00 to 0.86 over the whole frequency range of 1.0–18.0 GHz. Meanwhile, the image part (μ″) is in the range of 0.02–0.62 over 1.0–18.0 GHz. The imaginary part of relative permeability (μ″) exhibited a broad peak in the 2.0–8.0 GHz range with a maximum point of 0.62 at 4.8 GHz, which may be ascribed to the natural resonance of pyramidal Ni structure.
(a) Frequency dependence of complex relative permittivity, and (b) permeability, and (c) tangent loss for the paraffin-based composites containing 70 wt% pyramidal Ni.

In general, the excellent EM wave absorptions are strongly dependent on the efficient complementarities between the relative permeability and permittivity. If there is only dielectric loss or only magnetic loss, the EM attenuation will be very weak. Reference Chen, Gao, Wang, Zhu, Wang, Cao and Jin31 Therefore, the dielectric tangent loss (tanδε) and the magnetic tangent loss (tanδμ) were calculated based on the data [Figs. 5(a) and 5(b)] and the results are shown in Fig. 5(c). The values of tanδε are 0.04–0.15 between 1.0 and 14.6 GHz, whereas those of tanδμ are 0.15–0.48 between 1.0 and 14.6 GHz. This reveals that the magnetic loss plays main role in the EM absorption below 14.6 GHz, whereas the dielectric loss becomes dominant at high-frequency range. Therefore, effective complementarities between the dielectric loss and magnetic loss are realized, suggesting that these submicrometer Ni cones have excellent EM wave absorption properties.
To reveal the mechanism of dielectric loss, the complex permittivity has been analyzed according to the Debye dipolar relaxation model. The Debye dipolar relaxation of dielectric oxide can be expressed as:
 $${\left( {\varepsilon ' - {\varepsilon _\infty }} \right)^2} + {\left( {\varepsilon ''} \right)^2} = {\left( {{\varepsilon _{\rm{s}}} - {\varepsilon _\infty }} \right)^2}\quad ,$$
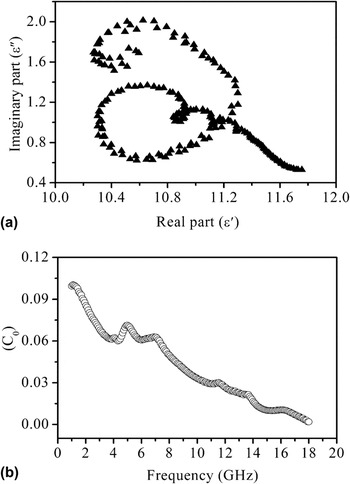
where εs and ε∞ are stationary dielectric constant and optical dielectric constant, respectively. Reference Xu, Han, Wang, Zhou, Lv, Wen, Wang and Zhang32 Theoretically, the plot of ε′ versus ε″ should be a single semicircle, which is usually defined as Cole–Cole semicircle. Reference Fang33 Figure 6(a) shows the curve characteristics of ε′ versus ε″ for the obtained sample. It is worth noting that the sample presents a clear segment of four overlapped semicircles. The presence of semicircles suggests that there are dual dielectric relaxation processes, and each semicircle corresponds to a Debye dipolar relaxation. The electrons that reside on the organic derivant may gain enough energy to surmount the interfaces among the organic derivant, wax and the pyramidal Ni, then move onto the Ni particles. Therefore, an interfacial behavior of accumulating space charges is expected for the composite, leading to a steady dielectric relaxation. However, the Cole–Cole semicircles are distorted, suggesting that besides the dielectric relaxation, other mechanisms such as the motion of conducting electrons and the particles/paraffin interfacial polarization may contribute to the permittivity spectra, too. Reference Pinna, Grancharov, Beato, Bonville, Antonietti and Niederberger34 Thus the dielectric relaxation processes and interfacial polarization are expected to result in the enhancement of dielectric loss. Furthermore, the organic derivant leads to the changes of electronic spin and charge polarization of the as-received product, which further affects the complex permittivity.
(a) The relation between real part (ε′) and imaginary part (ε″) of the complex permittivity (Cole–Cole plot). (b) The value C 0 of μ″(μ′)−2 f −1 as a function of frequency.

Generally, the microwave magnetic loss of magnetic particles originates from hysteresis, domain wall resonance, eddy current effect, natural resonance, and exchange resonance for the micro/nanostructure materials. In our case, the hysteresis loss is negligible in weak applied field. Reference Wu, Zhang, Hui, Xiao, Ge, Hines, Budnick and Taylor35 The domain wall displacement loss occurs only in the MHz range rather than GHz, so the contribution of domain wall resonance can also be excluded. Reference Gangopadhyay, Hadjipanayis, Dale, Sorensen, Klabunde, Papaefthymiou and Kostikas36 The eddy current loss is related to the diameter of nanoparticles (d) and the electric conductivity (σ), which can be expressed by Reference Guo, Wang, Miao, Liao, Zhang and Shi37
 $$\mu '' \approx 2\pi {\mu _0}{\left( {\mu '} \right)^2}\sigma {d^2}{f \mathord{\left/ {\vphantom {f 3}} \right. \kern-\nulldelimiterspace} 3}\quad ,$$
where f is the applied frequency, μ0 is the vacuum permeability. It is known from the above equation that, if magnetic loss only results from eddy current loss, the values of C 0(C 0 = μ″(μ′)−2 f −1 = 2πμ0σd 2/3) should be constant by varying frequency, which is called the skin-effect criterion. Reference Wu, Zhang, Hui, Xiao, Ge, Hines, Budnick and Taylor35 In pyramidal Ni, the values of C 0 decrease gradually with increasing frequency in the whole range of 1.0–18.0 GHz [Fig. 6(b)], the eddy current loss can be precluded, too. Thus, the magnetic loss should result from the nature resonance and exchange resonance.
C. Microwave absorbing properties
According to the measured data of permittivity and permeability, the RL usually can be evaluated by the following equation: Reference Chen, Deng, Zhu, Chen, Sun, Ma and Yang20
 $${\rm{RL}} = 20{\log _{10}}\left| {{{({Z_{{\rm{in}}}} - {Z_0})} \mathord{\left/ {\vphantom {{({Z_{{\rm{in}}}} - {Z_0})} {({Z_{{\rm{in}}}} + {Z_0})}}} \right. \kern-\nulldelimiterspace} {({Z_{{\rm{in}}}} + {Z_0})}}} \right|\quad ,$$
where Z 0 is the impedance of free space, and Z in is the input characteristic impedance, which can be expressed as
 $${Z_{{\rm{in}}}} = {Z_0}\sqrt {{{{\mu _{\rm{r}}}} \over {{\varepsilon _{\rm{r}}}}}} \tanh \left( {j{{2\pi fd\sqrt {{\mu _{\rm{r}}}{\varepsilon _{\rm{r}}}} } \over c}} \right)\quad ,$$
where μr is the complex permeability, εr is the complex permittivity, f is the frequency, c is the velocity of light, and d is the thickness of the composites. Reference Marín, Cortina and Hernando38
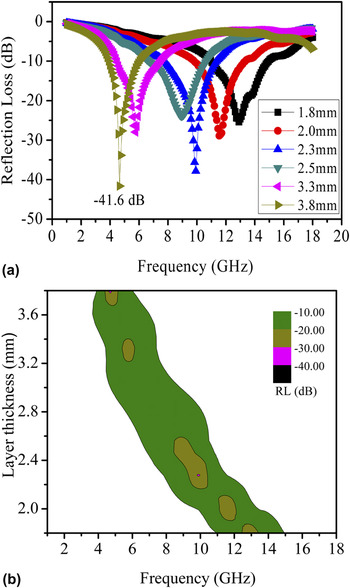
Figure 7(a) shows the calculated RL curves for the paraffin-based composites containing 70 wt% as-synthesized nickel cones with different thicknesses. The RL values of the wax composites less than −10 dB, which are comparable to 90% of EM wave absorption, were obtained in the range of 3.9–15.0 GHz with absorber thicknesses of 1.8–3.8 mm. It can be found that the minimum RL peak moves toward the lower frequency region with increasing thickness of the composite. It is worth noting that the composites with a thickness of 3.8 mm show a minimum RL value of −41.6 dB at 4.7 GHz. Figure 7(b) shows the bandwidth of the absorption frequency for RL < −10 dB in a two-dimensional contour plot. The result indicates that a thinner absorber layer has a wider frequency bandwidth. The enhanced EM wave absorption may be attributed to impedance match, and the cooperative effect between dielectric loss and magnetic loss. Apart from the dielectric loss and magnetic loss, the unique pyramidal structure is also beneficial for the enhancement of EM wave absorption. The pyramidal structure of nickel contributes to the polarization of electrical charge. The special morphology can form anisotropic antennas and discontinuous networks in the composites. Similar behavior ascribed to high aspect ratio has been observed in copper and magnetic microwire-based composites. Reference Gorriti, Marín, Cortina and Hernando39–Reference Marín, Cortina and Hernando41 It is available for the EM wave to penetrate the composites formed by the numerous conductive Ni cones and the energy will be induced into dissipative current. Therefore, EM waves will be consumed in the discontinuous networks, which lead to the energy attenuation. Reference Zhuo, Feng, Chen, Yan, Feng, Li, Geng, Cheng, Xu and Yan42 Ni horns not only lead to diffuse scattering of the incident microwaves, which results in the attenuation of EM energy, but also act as receivers of microwaves, which can produce vibrating microcurrent in the local networks and this microcurrent will be exhausted. Some works related with graphite flakes shown an equivalent behavior where a dihedral angle where the microwave reflects many times resulting in the lots of electromagnetic wave energy. Reference Zhuo, Qiao, Feng, Chen, Yan, Wu and Yan43 Besides above mentioned reasons for EM absorption, the electromagnetic wave can be absorbed via the “geometrical effect”, which means that when the thickness of absorber satisfies the equation Reference Marín, Cortina and Hernando38,Reference Wang, Han, Xu, Wang, Du, Wang, Qin and Zhang44
 $$d = {{l{\lambda _{\rm{m}}}} \over 4}\left( {l = 1,3,5,...} \right)\quad ,$$
 $${\lambda _{\rm{m}}} = {{{\lambda _0}} \over {\sqrt {\left| {{\mu _{\rm{r}}}} \right|\left| {{\varepsilon _{\rm{r}}}} \right|} }}\quad ,$$
where λm is the wavelength at certain frequency,
 $\left| {{\mu _{\rm{r}}}} \right|$
and
 $\left| {{\varepsilon _{\rm{r}}}} \right|$
are the moduli of μr and εr, and λ0 is the wavelength in the free space, the incident and reflected waves in the absorber are out of phase 180° and resulting the reflected waves in the air–absorber interface are totally canceled. We propose that the geometrical effect plays an important role in microwave absorption of pyramidal Ni. At matching frequency f
m = 4.7 GHz, by substituting the values of εr = 11.25 − j1.01, and μr = 1.41 − j0.61 into Eq. (5) with l = 1, we can get a matching thickness d = 3.84 mm, which is perfectly consistent to the thickness of 3.8 mm in the real measurement. Hence the above calculation validates our supposition that the strong microwave absorbing ability of Ni cones also arises from geometrical effect.
(a) Frequency dependence of the microwave RL and (b) contour map of the bandwidth with RL < −10 dB (90% absorption) as a function of the absorber thickness.

IV. CONCLUSION
In summary, the pyramidal Ni structures have been successfully synthesized via a facile template-free and glycerol-assist solvothermal method without surfactants or complex precursors. The glycerol served as both reducing agent and solvent in this synthesis. The influence of concentrations of NaOH and volume ratios of glycerol to water on the morphologies was investigated in detail. The paraffin-based composites containing 70 wt% Ni submicrometer cones show good electromagnetic wave absorbing characteristics and the RL values less than −10 dB are obtained in the frequency range of 3.9–15.0 GHz with corresponding absorber thicknesses of 1.8–3.8 mm. The pyramidal Ni exhibited a minimum RL value of −41.6 dB at 4.7 GHz. Such excellent microwave absorbing performance is attributed to synergic effect between dielectric loss and magnetic loss, geometrical effect and unique morphology. The results demonstrate that the Ni submicrometer cones obtained by the simple glycerol reduced method have a good application as a strong-absorption, thin-thickness, wideband and low-cost microwave absorber.