Introduction
Work and family life are key domains of adult life both associated with differential exposures to stressors and supports, and the accumulation of material and social resources known to be important for health in later life (Grundy and Sloggett, Reference Grundy and Sloggett2003; House et al., Reference House, Lantz and Herd2005; Chandola et al., Reference Chandola, Ferrie, Sacker and Marmot2007; Read et al., Reference Read, Grundy and Foverskov2016). Strong ties to the labour market bring material rewards, social links and a sense of purpose, and are generally associated with better health and wellbeing (Mirowsky and Ross, Reference Mirowsky and Ross2002; Wahrendorf et al., Reference Wahrendorf, Blane, Bartley, Dragano and Siegrist2013; Montez et al., Reference Montez, Martikainen, Remes and Avendano2015). Marriage and parenthood are also associated with more social ties, receipt of social support in later life and better health (Grundy and Tomassini, Reference Grundy and Tomassini2010; Read and Grundy, Reference Read and Grundy2011; Kravdal et al., Reference Kravdal, Grundy, Lyngstad and Wiik2012; Lacey et al., Reference Lacey, Stafford, Sacker and McMunn2016b). The impacts of work and family life trajectories on health may vary depending on the characteristics of both, and the combination of the two (Grundy and Holt, Reference Grundy and Holt2000; McMunn et al., Reference McMunn, Lacey, Kumari, Worts, McDonough and Sacker2016; Lacey et al., Reference Lacey, Sacker, Bell, Kumari, Worts, McDonough and McMunn2017). Some types of work involve exposure to specific hazards or more generalised stresses arising from the combination of high demand and low control (Siegrist and Marmot, Reference Siegrist and Marmot2004; Platts et al., Reference Platts, Netuveli, Webb, Zins, Goldberg, Blane and Wahrendorf2013). Similarly, some parenting and partnership trajectories, such as those involving early age at first birth, high parity, multiple partnerships and lone motherhood are associated with health disadvantages, with accumulated stress proposed as an important underlying mechanism (Read et al., Reference Read, Grundy and Wolf2011; Berkman et al., Reference Berkman, Zheng, Glymour, Avendano, Börsch-Supan and Sabbath2015; Grundy and Read, Reference Grundy and Read2015; O'Flaherty et al., Reference O'Flaherty, Baxter, Haynes and Turrell2016).
Strengths in one domain of life may offset disadvantages in another, e.g. having high-status work but lacking a partner or children. Conversely, the combination of less-favourable configurations in both work and family spheres may interactively amplify stresses with adverse implications for longer-term health. Such combinations, and their impact, may vary by gender, cohort and age. In current cohorts of older people highly educated women are the most likely to be never-married and childless, whereas among men marriage and parenthood are positively associated with better education and higher-status work (Kravdal and Rindfuss, Reference Kravdal and Rindfuss2008). The labour market participation of women, and more particularly mothers, has changed considerably since the mid-20th century with accompanying shifts in norms (Carr, Reference Carr2002; Worts et al., Reference Worts, Sacker, McMunn and McDonough2013), and in later-born cohorts, education, high-status work, and marriage and parenthood are more often positively correlated for women as well as for men. Longer-term impacts of work–family life trajectories may also change with age. For example, in retirement age groups sources of status, engagement and support may shift from work to family and community-orientated spheres with a corresponding increase in the importance of these domains for health.
A complicating factor is that associations between employment, family roles and health may partly reflect health-related selection. Disadvantages in childhood, for example, are linked to lower educational attainment and poorer health and health-related behaviours, all of which may lead to lower chances of finding and maintaining stable jobs and partnerships (Lacey et al., Reference Lacey, Stafford, Sacker and McMunn2016b; Arpino et al., Reference Arpino, Gumà and Julià2018). However, several studies indicate that health influences of work–family roles persist even after allowing for such selective influences (McMunn et al., Reference McMunn, Bartley, Hardy and Kuh2006; Frech and Damaske, Reference Frech and Damaske2012; Benson et al., Reference Benson, Glaser, Corna, Platts, Di Gessa, Worts and Sacker2017).
In this study, we identify classes of lifecourse types among a nationally representative sample of older people in the United Kingdom (UK) and analyse differences between these latent classes in physical and mental health, and changes in health. The contribution of this study is threefold. First, unlike the majority of previous studies, we include indicators of socio-economic position (SEP) in our identification of work–family types. Previous research has shown that health inequalities persist in later life and that indicators of SEP are associated with a range of health outcomes (Grundy and Sloggett, Reference Grundy and Sloggett2003; Read et al., Reference Read, Grundy and Foverskov2016) but these studies have not analysed how socio-economic resources, work histories and family involvement are combined in long-term trajectories as we do here. Conversely, other studies of work–family lifecourse have not considered that the impacts of these may vary depending on SEP despite indications that, for example, accumulated impacts of work may depend on the quality of the job (Platts et al., Reference Platts, Netuveli, Webb, Zins, Goldberg, Blane and Wahrendorf2013). Second, by exploiting rich longitudinal data, we are able to analyse how health differentials associated with work–family types change over a five-year follow-up period. The importance of any specific work–family combination may vary over time as people become older and their needs for social support, for example, change. Third, we examine whether associations between lifecourse trajectories and later-life health are mediated by current support from family and friends; an aspect not considered in previous studies even though work and family are important sources of social ties from which social support may be drawn.
Previous studies
One important strand of the literature that has considered joint influences of work and family domains has focused on health impacts of role conflicts and role overload among mid-life women. The role enhancement theory suggests that involvement in multiple roles promotes psychological functioning and generates health advantages (Barnett and Hyde, Reference Barnett and Hyde2001; Nordenmark, Reference Nordenmark2004). Alternatively, the role conflict theory suggests that the combination of extensive family and employment responsibilities may lead to role overload, work–family conflict and stress with negative health consequences (Gove, Reference Gove1984; Lahelma et al., Reference Lahelma, Arber, Kivelä and Roos2002). Leupp (Reference Leupp2017), for example, found in the analysis of a cohort from the United States of America (USA) that having young children was beneficial for the mental health of women not in paid work but detrimental for women in full-time work. Similarly, a recent UK study found that the overall level of 11 biomarkers related to chronic stress was 40 per cent higher among women working full-time and rearing two children than it was among childless women working full-time (Chandola et al., Reference Chandola, Booker, Kumari and Benzeval2019).
Recent studies have adopted a lifecourse approach to examine health impacts of trajectories of work and family circumstances. These studies, mainly based on data from the UK or USA, point to disadvantages for mid-life women with a combination of weak labour market ties and early motherhood (Kuh et al., Reference Kuh, Ben-Shlomo, Lynch, Hallqvist and Power2003; Sabbath et al., Reference Sabbath, Guevara, Noelke and Berkman2015b; Lacey et al., Reference Lacey, Sacker, Kumari, Worts, McDonough, Booker and McMunn2016a; McMunn et al., Reference McMunn, Lacey, Kumari, Worts, McDonough and Sacker2016; McKetta et al., Reference McKetta, Prins, Platt, Bates and Keyes2018). A Swedish study (Johansson et al., Reference Johansson, Huang and Lindfors2007), however, found that women with low education, an early start to working life and rather late first childbirth were the most disadvantaged in terms of life satisfaction and health at age 49, although effects were small. Results from a recent US study based on the analysis of data for women aged 18–50 included in the Panel Study of Income Dynamics found that mortality was lowest for non-working mothers who had married relatively late and highest for never-married mothers, whether working or not, and working never-married childless women (McKetta et al., Reference McKetta, Prins, Platt, Bates and Keyes2018).
With regard to health in older age groups, Benson et al. (Reference Benson, Glaser, Corna, Platts, Di Gessa, Worts and Sacker2017) found in a UK study that non-employed mothers with large families and those who took long career breaks had higher odds of depression and disability at around age 60, although the latter group had lower mortality from age 76. Results from analyses of the US Health and Retirement Study showed the highest mortality risk at ages 55–75 for long-term single mothers (whether working or not) and the lowest for married mothers with late childbearing and short periods out of the workforce (Sabbath et al., Reference Sabbath, Guevara, Glymour and Berkman2015a). A comparative US/European study of women aged 50–72 found that single working motherhood was consistently associated with worse cardiovascular outcomes (Van Hedel et al., Reference Van Hedel, Mejía-Guevara, Avendaño, Sabbath, Berkman, Mackenbach and van Lenthe2016). A study using similar data from the English Longitudinal Study of Ageing (ELSA) reported that among women aged 64 and older, those who had worked full-time both before and after a period focusing on family life appeared to have the best self-rated health, although results were of marginal statistical significance (Stone et al., Reference Stone, Evandrou, Falkingham and Vlachantoni2015).
A few studies have considered men as well as women. Lu et al. (Reference Lu, Benson, Glaser, Platts, Corna, Worts and Sacker2017), in a study also based on the analysis of ELSA data, reported that women who had short breaks from work for family reasons and then returned to part-time work had the lowest frailty at age 60. Women who were largely family carers or had never worked had higher frailty at age 60 but slower declines thereafter. For men there were no clear advantages of continuous full-time work until age 65. Wahrendorf (Reference Wahrendorf2015), using retrospective lifecourse data collected in the Survey of Health and Retirement in Europe (SHARE) for 13 European countries, found that women who had ‘mixed’ histories, including work and breaks for family care, had the highest quality of life in later life, whereas for men continuous long-term employment was the most beneficial. Arpino et al. (Reference Arpino, Gumà and Julià2018) also used SHARE data to investigate whether education, and family and employment trajectories mediated the effect of childhood conditions on the health of adults aged 60 and over. Results indicated linkages between childhood circumstances and later-life health with some mediation by family–work type, although for women the most important mediating influence was that of education.
These results are somewhat mixed but a common thread is of later health disadvantages for single or young mothers with weak labour market ties and, for partnered mothers, an advantage from histories including labour market involvement with breaks to focus on family responsibilities. On the basis of these previous research findings, we expect that women who had lifecourses characterised by breaks for family care will have better health in later life compared to both non-working mothers and those who worked continuously (Hypothesis 1). Additionally, we hypothesise that lifecourse types characterised by early motherhood and weak attachment to the labour market will be associated with worse health compared to groups of women who worked continuously (Hypothesis 2). Studies including men suggest health advantages for those in long-term full-time employment (Wahrendorf, Reference Wahrendorf2015); we expect, therefore, that among men lifecourses characterised by unstable work will be associated with worse health compared to those characterised by long-term employment (Hypothesis 3).
Much of the previous literature has used sequence analysis to identify lifecourse typologies and examined cross-sectional outcomes. Educational and occupational states are infrequently included in the derivation of typologies, although socio-economic resources and family involvement are entwined for both men and women (Johansson et al., Reference Johansson, Huang and Lindfors2007), and several scholars (Wahrendorf, Reference Wahrendorf2015; Arpino et al., Reference Arpino, Gumà and Julià2018) have suggested that incorporating dimensions of work and family simultaneously would be advantageous. Education and occupation may have a direct influence on mental wellbeing by promoting cognitive reserve and mental stimulation, which is protective against health deterioration in later life (Bartley and Plewis, Reference Bartley and Plewis2002; Grundy and Sloggett, Reference Grundy and Sloggett2003; Wahrendorf et al., Reference Wahrendorf, Blane, Bartley, Dragano and Siegrist2013). Socio-economic resources may also indirectly influence physical and mental health, via health behaviour, exposure to (un)stressful work conditions, and access to better housing, locations, food, leisure and health care (Mirowsky and Ross, Reference Mirowsky and Ross2002). These influences are also interconnected to differential probabilities of unemployment, part-time work, and the timing of entry to and exit from the labour force, all of which define long-term employment trajectories and influences on later-life health. We expect, therefore, that lifecourse types characterised by higher SEP will be associated with better physical and mental health in later life (Hypothesis 4).
We identify lifecourse typologies of women and men born 1933–1945 using latent class analysis of rich retrospective data drawn from the large nationally representative UK Household Longitudinal Study. Unlike previous studies, we include indicators of SEP in the derivation of typologies to capture the interplay between these indicators and work–family types. We undertake analyses separately for women and men because of the gendered nature of work and family involvement in the cohorts considered. We investigate differences between the identified latent classes in summary indicators of physical and mental health, and changes in these over a five-year follow-up period, controlling for indicators of childhood circumstances. This allows us to examine whether health disparities associated with earlier lifecourse factors decrease over time. For example, health disadvantages related to large family size and early parenthood may become smaller as people get older and rely more on their family network for support and companionship (Hypothesis 5). Studies show that spouses and children are the most important source of support for older persons (Wolff and Kasper, Reference Wolff and Kasper2006), and those lacking such a ‘safety net’ are at a higher risk of loneliness and depression (Teo et al., Reference Teo, Choi, Andrea, Valenstein, Newsom, Dobscha and Zivin2015; Tosi, Reference Tosi2017; Tosi and Grundy, Reference Tosi and Grundy2018; Grundy et al., Reference Grundy, Van den Broek and Keenan2019; Van den Broek et al., Reference Van den Broek, Tosi and Grundy2019). Although the childless may be disadvantaged in terms of support from close family, they may have more alternative links with friends and extended kin (Schnettler and Wohler, Reference Schnettler and Wohler2016). We therefore consider aspects of current relationships with family and friends as these may mediate or modify associations between work–family trajectories and later-life health. Some work–family combinations may be associated with worse physical and mental health because of a weak support network (Hypothesis 6).
Data and methods
Data were drawn from the first five waves (2009–2013) of Understanding Society, the UK Household Longitudinal Study, a population-representative survey of some 60,000 individuals in 40,000 households (Knies, Reference Knies2017; University of Essex et al., 2018). The first wave of the study collected information about marital and fertility history from all respondents and employment biographies from a quarter of the sample. Employment biographies for the other 75 per cent of sample members were gathered in Wave 5. Given the timing of the collection of employment histories, we selected respondents aged 65–75 at baseline who were present at both Waves 1 and 5. We chose this age group because respondents were likely to have completed, or nearly completed, their employment histories at baseline and, compared to older groups, relatively likely to survive over the subsequent four years. Due to mortality and attrition between Waves 1 and 5, our sample represents 60 per cent of people aged 65–75 at baseline; on the other hand, including respondents who died or dropped out during the observation window would produce a large proportion of missing values in employment variables given that these respondents were not available in Wave 5. Longitudinal weights (for main and proxy interviews) were used to adjust the estimates for selective attrition (Knies, Reference Knies2017). The analytical sample is representative of the population born between 1933 and 1945 who were present in the UK in 2009 and survived over the subsequent four years (2009–2013). The final sample includes 1,625 men and 1,854 women contributing 7,982 and 9,096 year-observations, respectively.
Outcome variables
Health was measured using the SF-12 physical and mental component summary scores. The SF-12 includes questions on physical functioning, bodily pain, general health, vitality, social functioning, emotional problems, psychological distress and wellbeing, and has been validated for the UK (Gandek et al., Reference Gandek, Ware, Aaronson, Apolone, Bjorner, Brazier and Sullivan1998). In a sensitivity analysis we applied the logarithm of the reversed scale to obtain a quasi-normal distribution and the results were similar to those presented below.
Manifest items
We used work- and family-related items to synthesise individuals’ biographies into lifecourse types. Family lifecourse histories were captured by eight items relating to marriage, co-habitation, divorce and parenthood. Experience of co-habitation was captured through a binary item identifying those who had lived with a partner before first marriage or, in case of the never-married, had ever co-habited. A binary indicator was also used to identify those who had ever experienced a divorce or separation. For those who had married or had children, we included items on age at marriage, age at first parenthood and number of children. Age at first marriage was categorised as early (before age 20 for women, age 23 for men), late (after age 29 for women, age 34 for men) or usual (the remainder). We used the same threshold ages to identify early and late transitions to parenthood. These cut points were chosen on the basis of the distribution of these variables and previous studies examining the impact of timing of partnership and parenthood on later-life health in the UK (Read et al., Reference Read, Grundy and Wolf2011; Grundy and Read, Reference Grundy and Read2015). Among intact couples, we used the timing of partnership and parenthood reported by the partner to check and replace missing values. Number of biological children ever-born was treated as a categorical variable ranging from zero to four or more.
Employment histories were collected through retrospective questions on 40 spells covering working life from leaving full-time education to retirement or current activity. Employment histories were censored at age 65 for men and 60 for women, the State Pension Age for these cohorts. We used the date of the first employment spell or, in case of missing dates, the date of leaving education, to identify respondents who started work before age 16 (early) or after age 20 (late). Reported spells of unemployment, long-term sickness or being out of the labour force due to looking after family were used to identify work interruptions. As the proportions experiencing spells of unemployment or sickness absence were relatively small, we created a dichotomous indicator of ever had a work interruption for these reasons without any distinction by duration. In the analysis for women, we also derived indicators of having worked part-time for more than three years (not necessarily consecutively) and having spent more than five years out of the labour market looking after family. We created other variables indicating the length of time spent in paid work throughout the lifecourse. For men, we distinguished between those who had worked for less than 25 years, those employed for 25–39 years and those who had worked for more than 40 years by age 65. For women, cut points were having worked for less than 20 years, 20–34 years and more than 35 years by age 60. We performed a number of sensitivity analyses changing the number of years spent in part-time work (five years), looking after family members (three years) and unemployment or illness (two and three years), and results were similar to those presented here.
SEP was measured using highest educational qualification and socio-economic classification of the last job. We distinguished between three qualification groups: those with qualifications normally taken in secondary school at around age 16 or 18 (GCSEs or ‘A’ levels), or equivalent qualifications, described as mid-level education; those with lower-level or no qualifications; and those with higher-level qualifications, including university degrees, college diplomas, teaching or nursing certificates, and equivalent qualifications. Last occupation was coded into three categories: professional (higher); intermediate; routine (lower) using the National Statistics Socio-economic Classification. We additionally included a fourth category distinguishing those who had never worked.
Background and early life characteristics
Indicators of background and childhood and youth characteristics and behaviours were included in the analysis as previous studies indicate that these are associated with work and family lifecourses and also with later-life health (Tosi and Gähler, Reference Tosi and Gähler2016; Arpino et al., Reference Arpino, Gumà and Julià2018). We included indicators of whether or not the respondent's mother was in paid work when the respondent was aged 14; whether the respondent lived in a single-parent household at any point before age 16; whether the respondent's parents had any educational qualifications; whether or not the respondent was drinking alcohol by age 16; smoking cigarettes by age 16; and whether or not the respondent had one or more diagnosed health conditions (selected from a checklist of 20) by age 25. Country of birth (UK or other) was also included.
Family and friendship support and strain
Relationships with family and friends may mediate associations between work and family lifecourses and health, e.g. childless and divorced individuals may have weaker support networks than married parents (Schnettler and Wohler, Reference Schnettler and Wohler2016; Albertini and Tosi, Reference Albertini and Tosi2018). Information on support from friends and family was collected in Waves 2 and 5 and treated as time-invariant. For people who had information from both waves, we used the one provided earlier (Wave 2). We created two additive indexes from two sets of six questions probing positive and negative aspects of respondents’ relationships with family members and friends. These were: How much do they really understand the way you feel about things? Can you rely on them? How much can you open up to them if you need to talk? How much do they criticise you? How much do they get on your nerves? Do they let you down? For each item response categories were: 1 = not at all, 2 = a little, 3 = somewhat, 4 = a lot. We created an additive score using the first three items on social support and the second three on social strain, using in the latter case reversed values, from a lot (1) to not at all (4). The Cronbach's alpha was equal to 0.75 and 0.76 for women's family and friendship support, respectively, and 0.74 and 0.72 for men's family and friendship support, respectively.
We also included two other binary variables indicating whether or not respondents lived with a partner and whether or not they were a current smoker. Both are associated with health (and with each other) as well as with SEP (McCarron et al., Reference McCarron, Smith, Okasha and McEwen2001; Marinho et al., Reference Marinho, Blay, Andreoli and Gastal2008; Keenan et al., Reference Keenan, Ploubidis, Silverwood and Grundy2017). We do not control for current drinking, because its effect may be either positive or negative depending on quantity, frequency and type of drinking, as well as whether it reflects ritual and social activities (Holdsworth et al., Reference Holdsworth, Mendonça, Pikhart, Frisher, de Oliveira and Shelton2016).
Statistical analysis
Firstly, latent class analysis was used to synthesise different lifecourse types using the manifest work, socio-economic status and family lifecourse items described above. The estimation of latent classes assumes that individuals belong to unobserved lifecourse types which can be identified from a number of observed variables. The procedure aims to identify typical patterns via a likelihood function. Since the results generated by this function depend on the starting values computed in the first interaction, we estimated the models randomly choosing different starting values 100 times. We ran latent class models with an increasing number of classes and chose the best model fit through the comparison of the Akaike information criterion and Bayesian information criterion. This technique defines the individuals’ probability of belonging to each class, hence introducing a degree of uncertainty in class membership. However, the normalised entropy was equal to 0.85 for men and 0.84 for women, indicating a good model fit and a clear delineation of classes. We therefore used the highest individual probability of class memberships to allocate individuals to a specific lifecourse type.
Missing data
Retrospective variables used to identify lifecourse types included some missing values, in the case of employment histories this reached 7.7 per cent. The latent class analysis allowed us to handle missing data using the Expectation-Maximisation algorithm for maximum likelihood estimation. Individuals with missing responses were classified into a lifecourse type using the probability generated by observed items (Dempster et al., Reference Dempster, Laird and Rubin1977). Similar results to those reported here were found using the full-information sample (see Tables 5S and 6S in the online supplementary material).
Missing data on dependent variables and covariates were multiply imputed by chained equations. This procedure uses full information maximum likelihood estimation, hence considering missing data as a function of observed covariates under the assumption of missing at random. The observed variables included in the imputation were the same as those presented in the multi-level models, plus self-reported health, having limitations in daily activities and mental wellbeing (General Health Questionnaire). Twenty imputed data-sets were created, resulting in 7,982 and 9,096 observations with full information for men and women, respectively.
Multi-level analysis
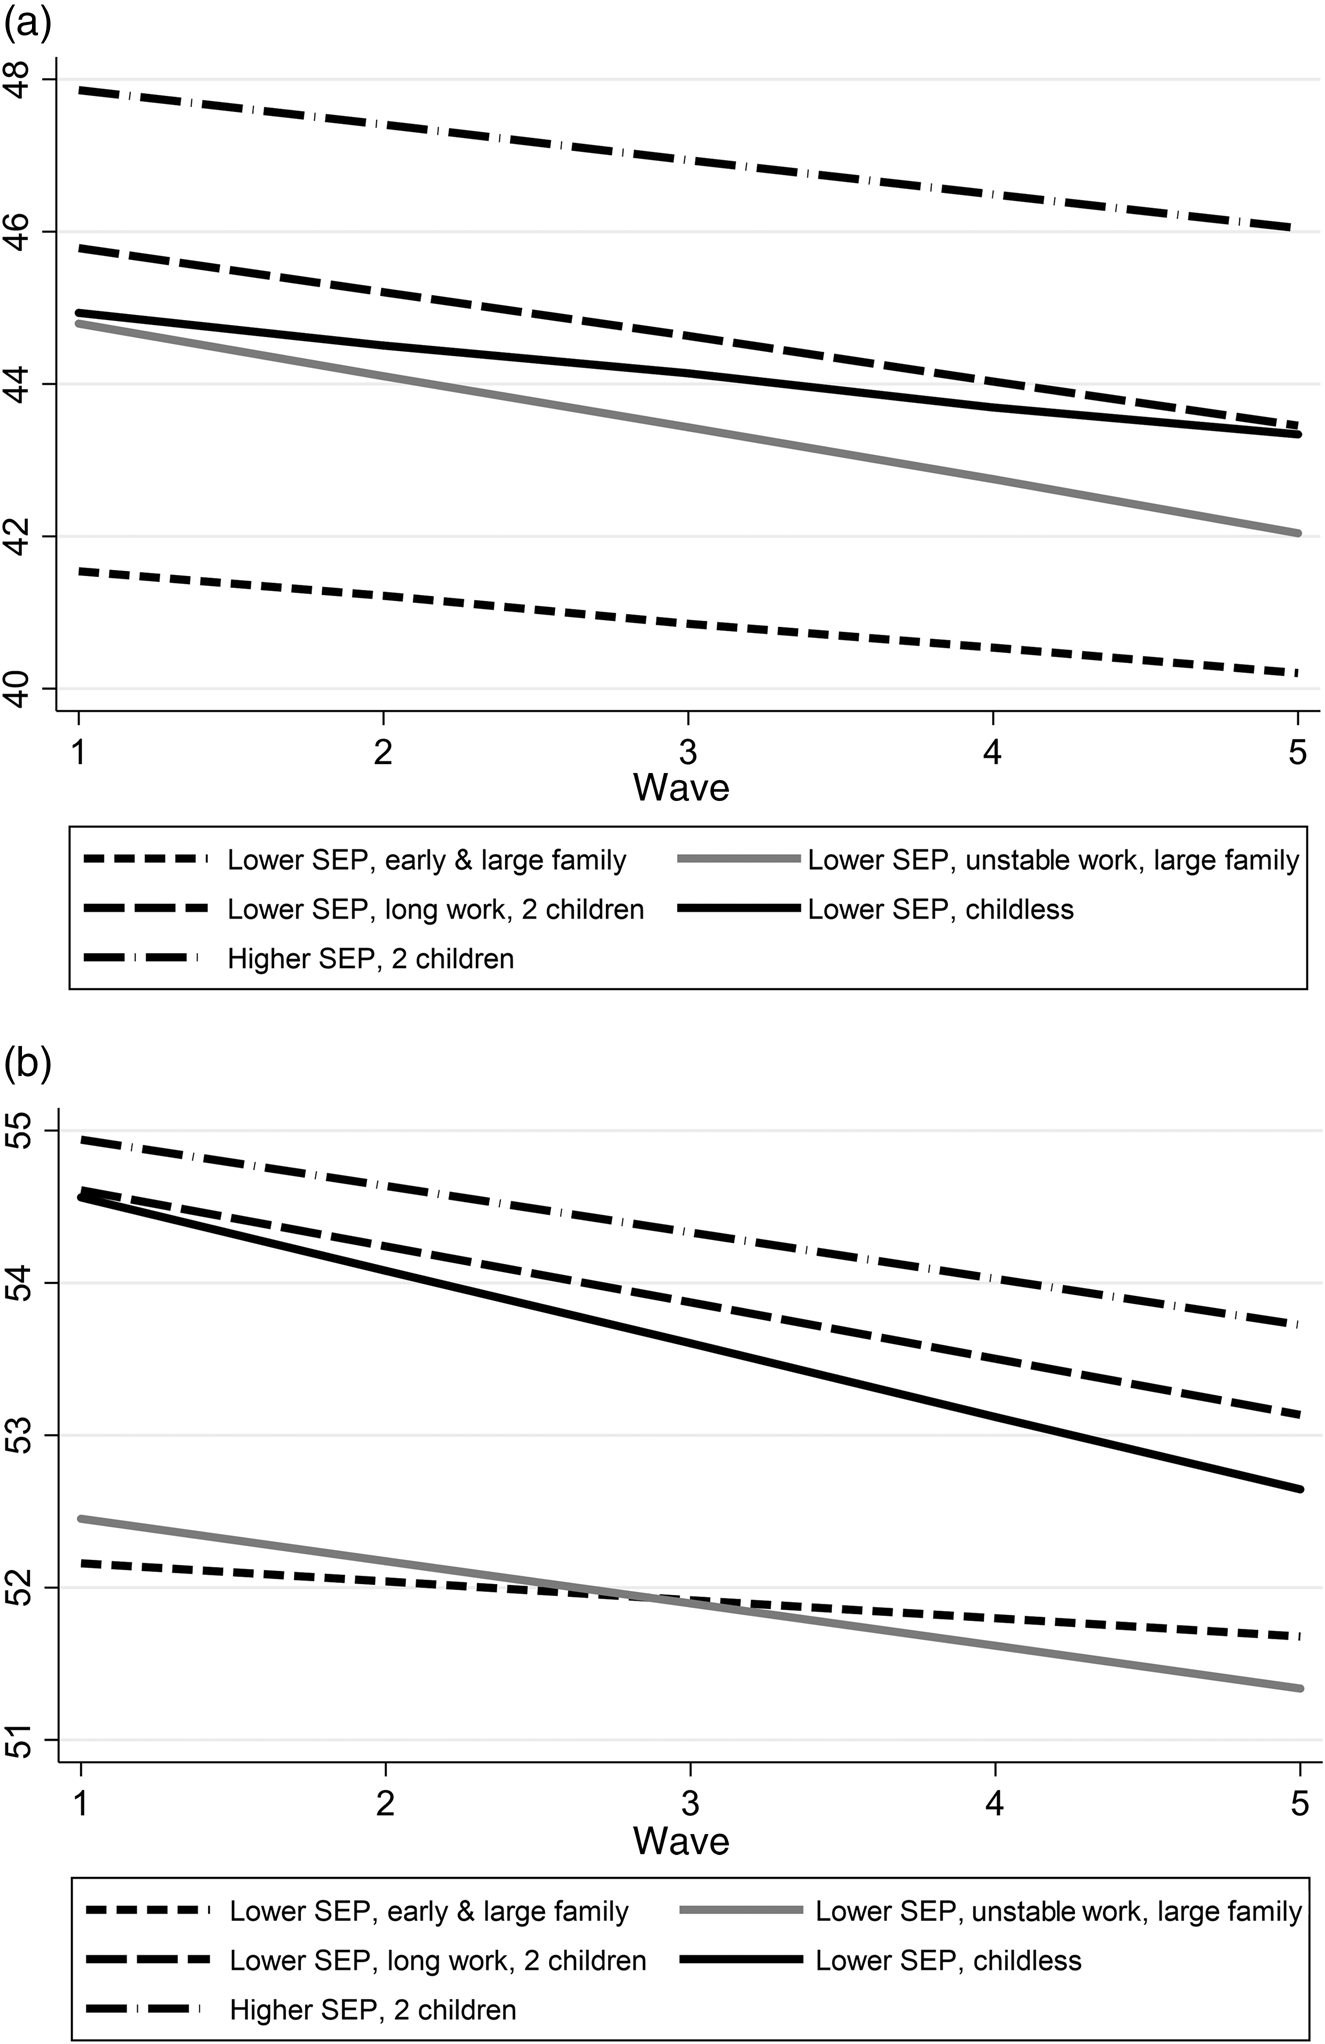
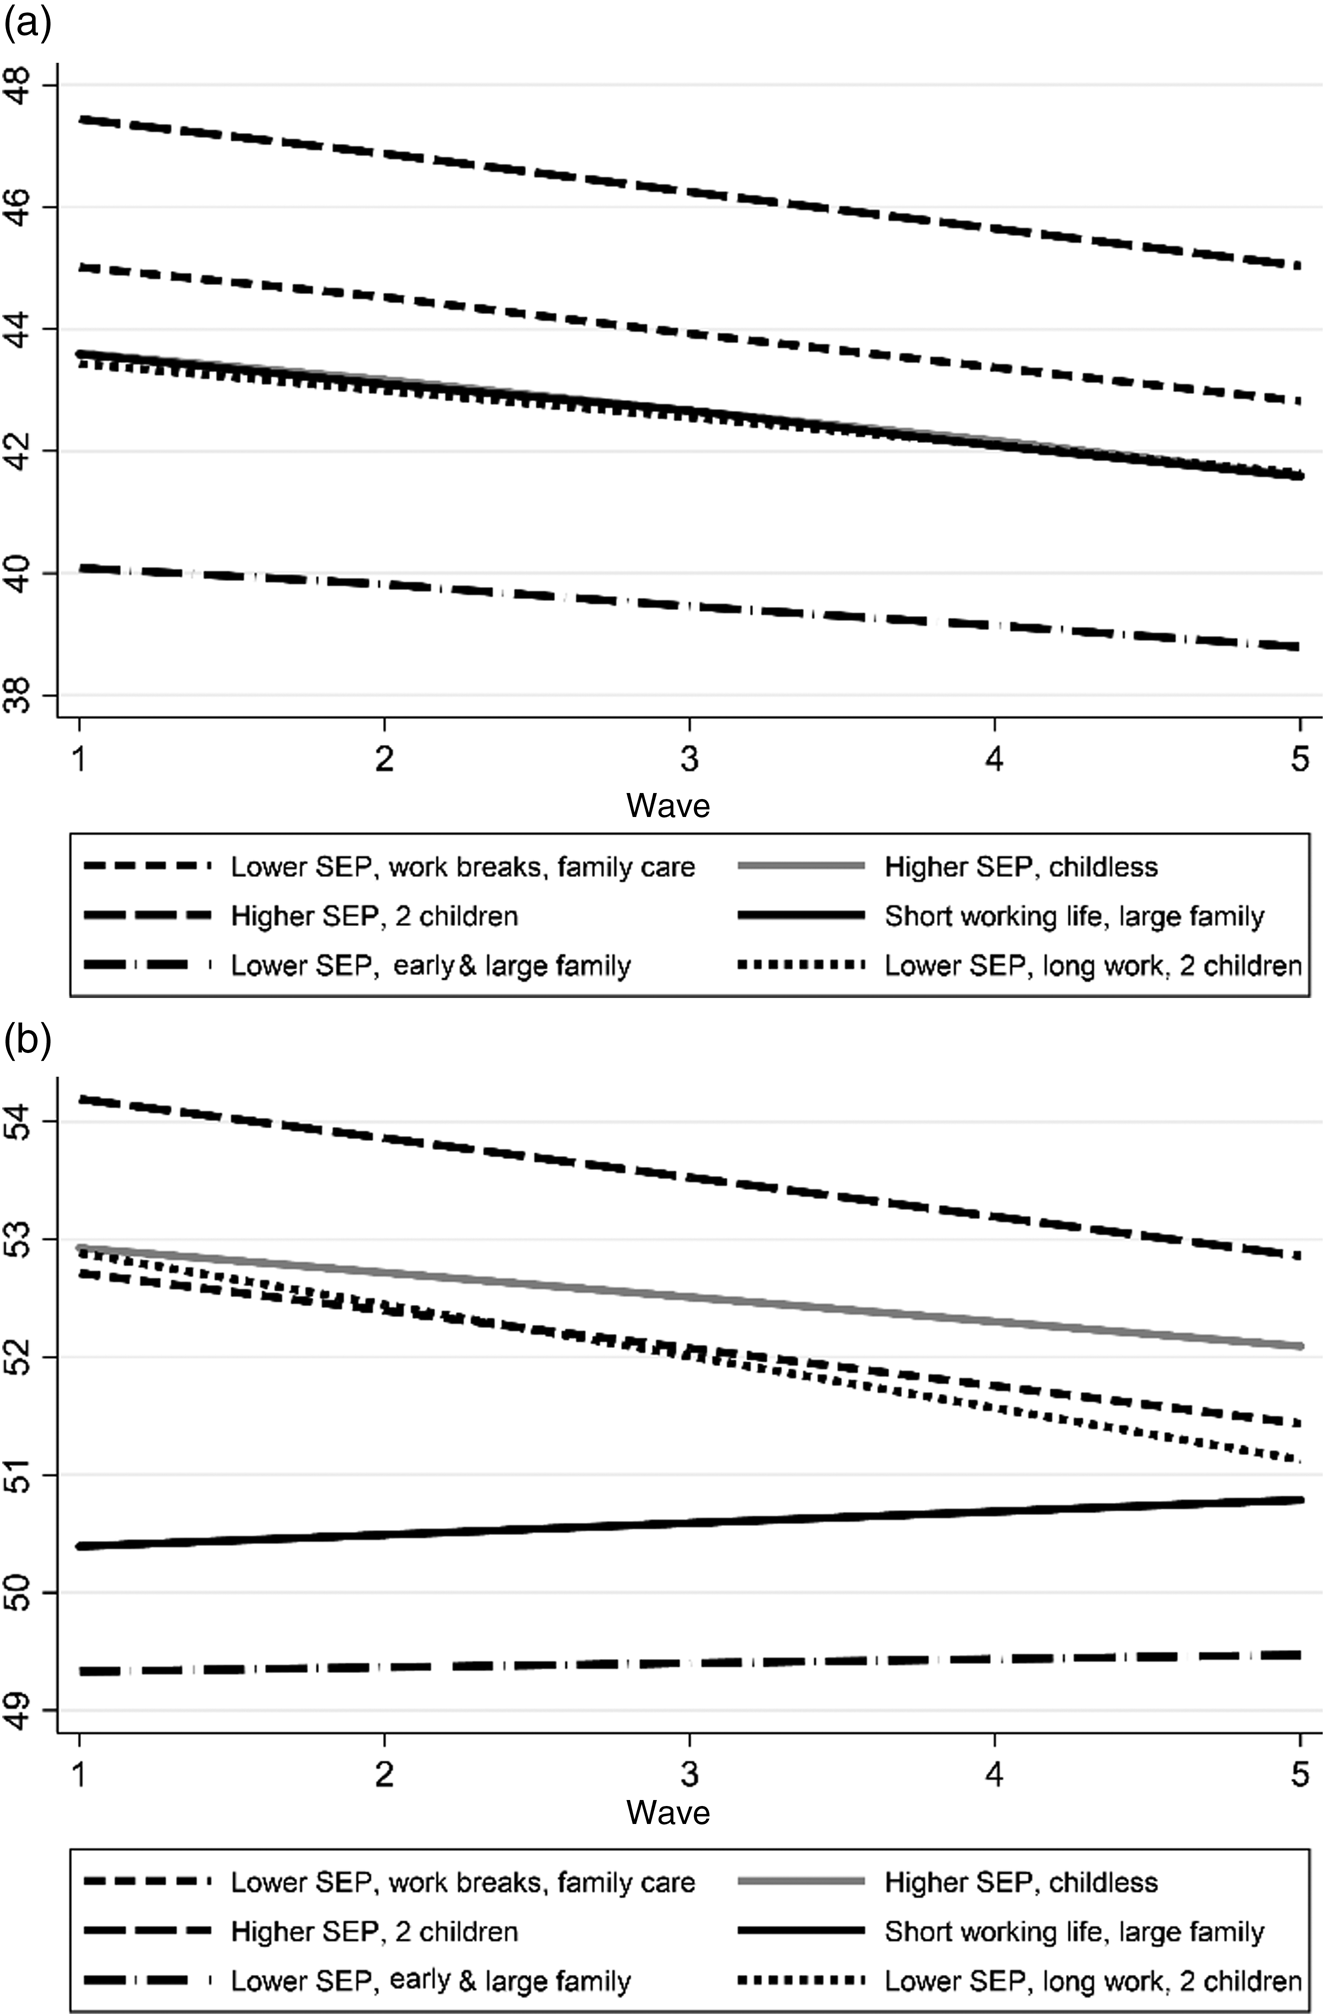
To account for the longitudinal structure of the data, we fitted multi-level random intercept models. This allowed us to examine how lifecourse types, derived from retrospective information as time-constant individual characteristics, were associated with physical and mental health in the five-year follow-up window (2009–2013). In the second step of the analysis, we added interaction terms between lifecourse types and time (or wave) to estimate different health trajectories by lifecourse (see Tables 3S and 4S in the online supplementary material). The linear combination of interaction and the main effect of time indicates whether the health score of each work–family type increases faster (both positive) or more slowly (positive coefficient of time and negative interaction), or decreases faster (both negative) or more slowly (negative coefficient of time and positive interaction) compared to the reference group. Concomitantly, the combination of interaction and the main effect of work–family types shows whether health advantages associated with these types increase (both positive) or decrease (positive coefficient of work–family type and negative interaction), and whether health disadvantages increase (both negative) or decrease (negative coefficient of work–family type and positive interaction) over time. The random coefficient for time was used to account for individual heterogeneity in growth rates. This model – also known as a growth curve model – refers to a multi-level model with both random intercepts and a random slope for time. Given the limited number of waves (five) used in the analysis, we use a linear specification of time to reduce the number of parameters in the model. Predicted values estimated from growth curve models are reported in Figures 1 and 2. All regression models were based on the 20 imputed data-sets and were adjusted for selective attrition using longitudinal weights (Knies, Reference Knies2017). Heteroskedasticity robust standard errors were used to take account of intra-individual correlation.
Predicted SF-12 physical (a) and mental (b) scores estimated from growth curve models: men.
Notes: SEP: socio-economic position. Estimates are reported in the online supplementary material.

Predicted SF-12 physical (a) and mental (b) scores estimated from growth curve models: women.
Notes: SEP: socio-economic position. Estimates are reported in the online supplementary material.

Results
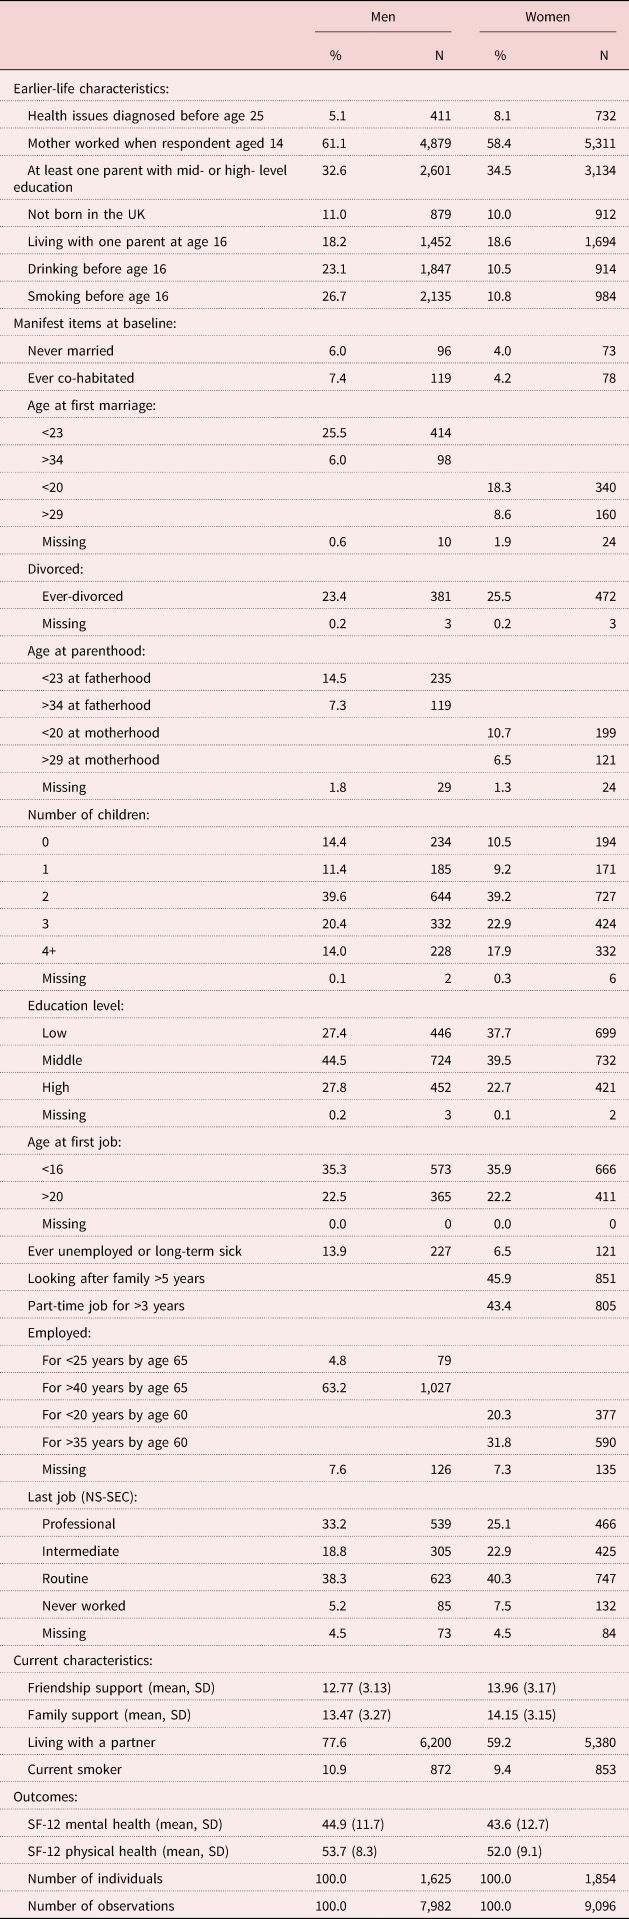
Descriptive information on sample characteristics is presented in Table 1. This illustrates the gendered nature of work trajectories in these cohorts. Just over a third of both men and women had started work before age 16 but 63 per cent of men had worked for 40 or more years by age 65 while only 32 per cent of women had worked for 35 years or more by age 60 and 46 per cent of women had had five or more years out of the labour market due to family responsibilities. A higher proportion of women than men had no or low-level qualifications and only a quarter had had a professional job, compared to a third of men. Most respondents had had two or three children and about a quarter had experienced divorce. Reported childhood characteristics were similar for men and women except that more men reported drinking and smoking by age 16. Scores on the outcome health measures were also similar for men and women.
Sample description

Notes: UK: United Kingdom. NS-SEC: National Statistics Socio-economic Classification. SD: standard deviation. Missing values in manifest items were handled by using maximum likelihood estimation in latent class analysis. Missing values in early life and current characteristics as well as outcome variables were multiply imputed.
Work–family lifecourse types
Men
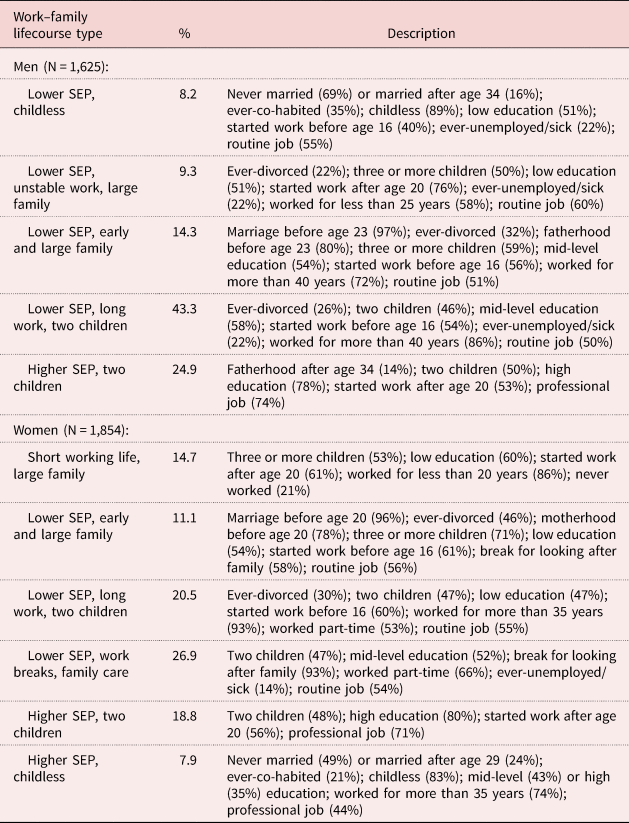
Table 2 presents summary results from the latent class analysis (for full results, see Table 1S for men and Table 2S for women in the online supplementary material). We found five typical lifecourse types for men. The largest one (43%), described as ‘lower SEP, long work, two children’, refers to men characterised by starting work before age 16 and working for more than 40 years with half working in routine occupations. They combined a long working life with family involvement (most often two children). Men in the ‘lower SEP, early and large family’ group (14%) were very similar in terms of educational and working life characteristics but had more often married and become fathers at an early age and had three or more children. The third group, labelled ‘lower SEP, unstable work, large family’ (9%) is characterised by men who had predominantly worked in routine occupations with a short working life and often had three or more children. The fourth lifecourse type, the ‘lower SEP, childless’ group (8%), is defined by high odds of having never married (or late marriage for those marrying), co-habitation outside marriage and childlessness. Most people in this group had no educational qualifications, worked in routine jobs and experienced some unemployment. Lastly, the ‘higher SEP, two children’ group (25%) was characterised by late fatherhood, high education and professional employment. Men in this group were relatively likely to have had two children and delayed their entry into the labour market but were less likely than others to have experienced work interruptions.
Results from latent class analysis estimated for men and women separately

Notes: SEP: socio-economic position. Estimates from latent class analysis are reported in the online supplementary material.
Women
We identified six typical lifecourse classes for women reflecting differential involvement in work and family life. Women belonging to the ‘short working life, large family’ (15%) and ‘lower SEP, early and large family’ groups (11%) were characterised by large families and a predominantly lower SEP; but the former included more non-employed mothers and those who worked for less than 20 years, while the latter identifies women who combined early motherhood and high parity with work breaks and part-time work but a longer working life; this group were also the most likely of any to have experienced divorce. At the opposite extreme of this continuum, most women in the ‘higher SEP, childless’ group (8%) remained childless and either never married or married at a later age, had a long working life often in a professional job and mostly had a mid- or high-level educational qualification. Women in the ‘higher SEP, two children’ group (19%) were characterised by high education and professional work; but, distinct from the previous group, combined work and family responsibilities (two children), had a shorter working life and more often worked part-time. The ‘lower SEP, long work, two children’ and ‘lower SEP, work breaks, family care’ groups were similar to each other in terms of educational and occupational profile but the latter group tended to have more children and a high proportion spent five or more years out of the labour market due to family responsibilities.
Lifecourse types and later-life health
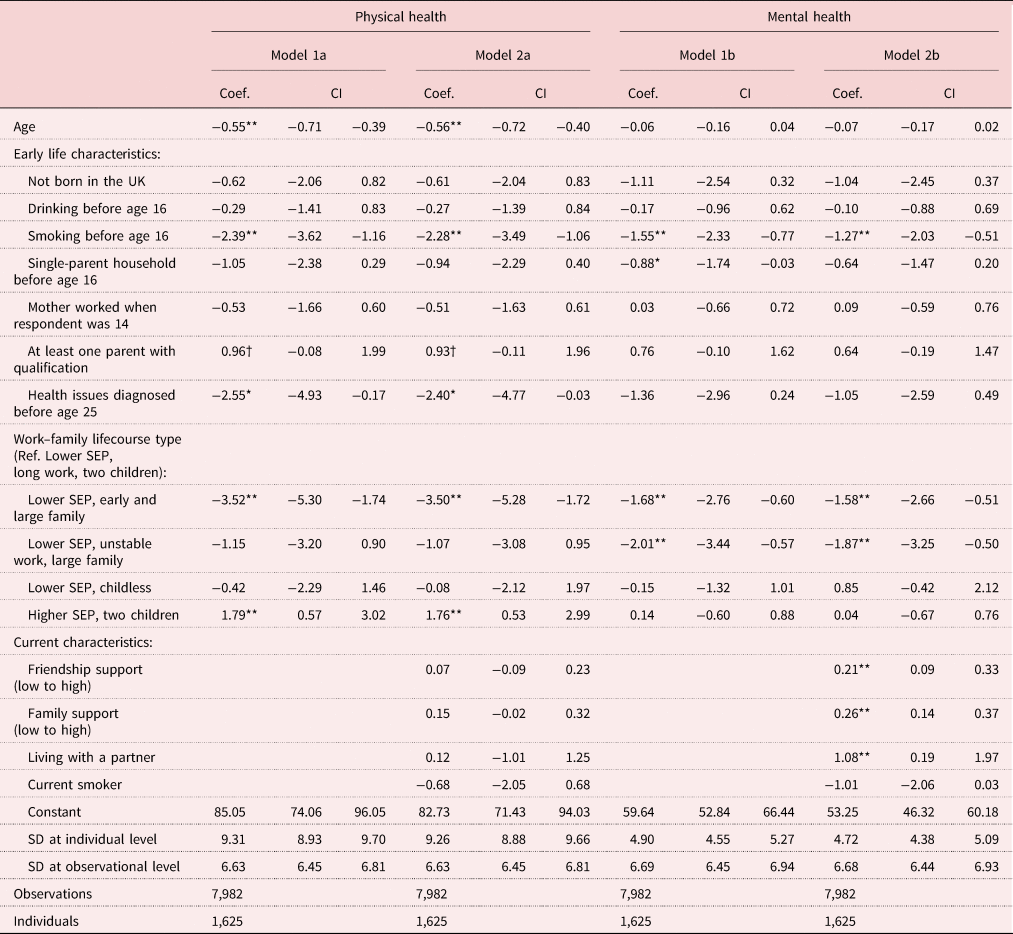
Tables 3 and 4 present results from multi-level random intercept models for men and women, respectively. We used the ‘lower SEP, long work, two children’ lifecourse type as the reference category. Table 3 shows that men belonging to the ‘lower SEP, early and large family’ group had worse physical and mental health than those in the reference category. As evident from the confidence intervals, this group also had worse physical health than the ‘lower SEP, childless’ group, hence suggesting a negative impact of large family size on later-life health (Model 1a). Results for mental health (Model 1b) show no difference between the ‘lower SEP, childless’ and ‘lower SEP, early and large family’ groups. However, the other lifecourse type characterised by large family size, i.e. the ‘lower SEP, unstable work, large family’ group, was associated with a lower score on mental but not physical functioning compared to the ‘lower SEP, long work, two children’ group. Overall, men in the two lifecourse types characterised by large families and lower SEP were the most disadvantaged, whereas those in the ‘higher SEP, two children’ group had the highest score on physical health. Men in the ‘higher SEP, two children’ type were characterised by better physical health, in comparison with those in the ‘lower SEP, early and large family’, ‘lower SEP, unstable work, large family’ and ‘lower SEP, long work, two children’ groups. There were no differences between the SF-12 mental health scores of men with higher socio-economic status and those in the ‘lower SEP, long work, two children’ group.
Multi-level random intercept linear regression models of SF-12 physical and mental scores (higher = better): men

Notes: Coef.: coefficient. CI: confidence interval. UK: United Kingdom. SEP: socio-economic position. Ref.: reference category. SD: standard deviation. Weighted estimates. Heteroskedasticity robust standard errors. Control variables not reported in the table: dummies for wave.
Significance levels: † p < 0.1, * p < 0.05, ** p < 0.01.
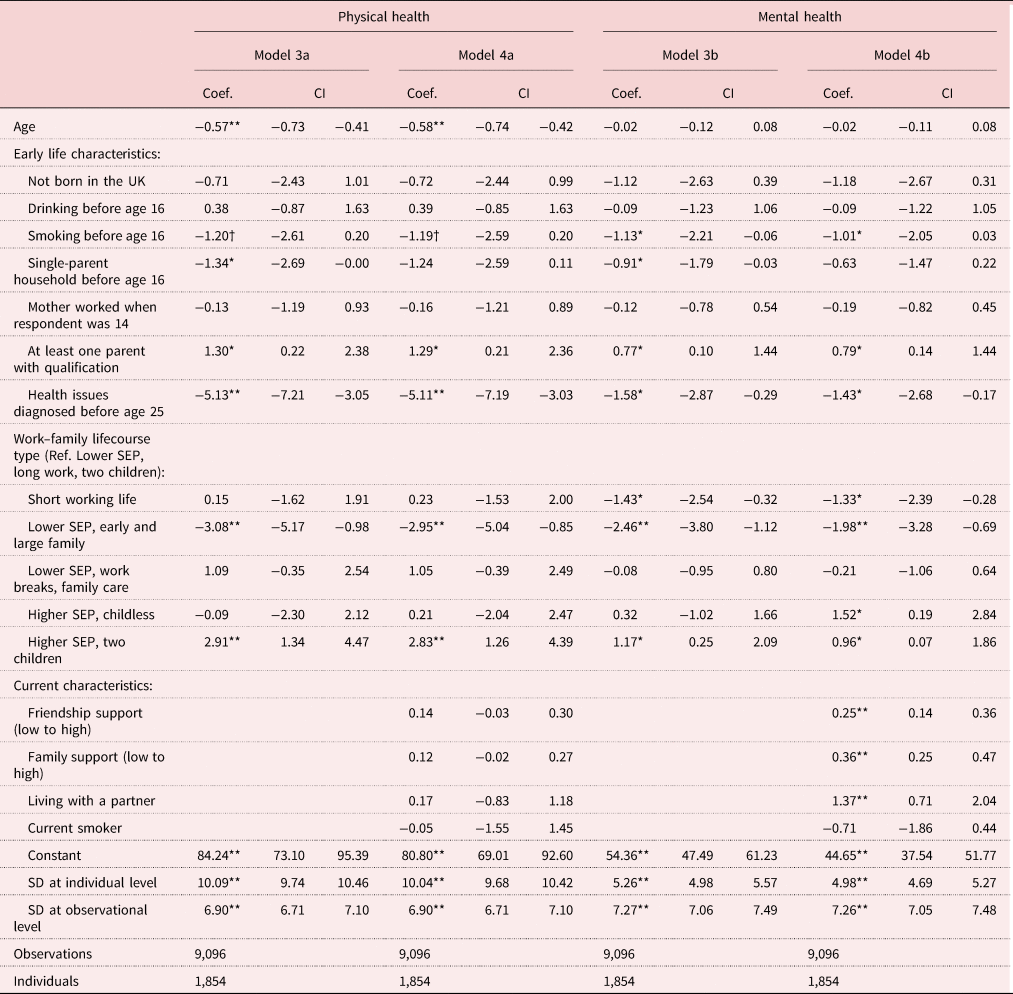
Multi-level random intercept linear regression models of SF-12 physical and mental scores (higher = better): women

Notes: Coef.: coefficient. CI: confidence interval. UK: United Kingdom. SEP: socio-economic position. Ref.: reference category. SD: standard deviation. Weighted estimates. Heteroskedasticity robust standard errors. Control variables not reported in the table: dummies for wave.
Significance levels: † p < 0.1, * p < 0.05, ** p < 0.01.
Among women (Table 4), the lifecourse type characterised by lower SEP and early and large family was associated with worse physical (Model 3a) and mental (Model 3b) health compared to the ‘lower SEP, long work, two children’ type. As observed for men, becoming a parent at an early age and having many children was associated with lower SF-12 scores. The confidence intervals indicate that women in the ‘lower SEP, early and large family’ group had worse physical and mental health than those in the other lifecourse types, with the exceptions of the ‘short working life and large family’ group. Non-employed mothers and those who were employed only for a few years had worse mental but not physical health in comparison with women in the ‘lower SEP, long work, two children’ group. Conversely, women in the ‘higher SEP, two children’ group were the most advantaged and had better mental and physical health. Confidence intervals on outcome measures between childless women with a higher socio-economic status and those in the ‘higher SEP, two children’ group overlap; however, given that confidence intervals generate conservative estimates, we changed the reference category to identify health differentials across lifecourse types. This analysis revealed that women in the ‘higher SEP, two children’ group had better physical (coefficient = 2.99; confidence interval (CI) = 0.79, 5.20) but not mental health than those in the ‘higher SEP, childless’ group. Women with a higher socio-economic status and two children were the most advantaged, while those who combined a lower socio-economic status with early motherhood had the worst physical health in later life. We found no associations between the ‘lower SEP, work breaks, family care’ and SF-12 physical and mental scores.
Tables 3 and 4 show that there were associations between work–family types and later-life health net of earlier lifecourse characteristics. Women (Table 4) who had health issues diagnosed before age 25 had worse physical and mental health in later life; for men (Table 3) there was an association between earlier life health conditions and worse later-life physical, but not mental, health. For both men and women, having at least one parent with an educational qualification was associated with health benefits in later life. Men who started smoking before age 16 had a lower level of physical and mental health, although there were no associations between early drinking and later-life health. Allowing for these possible confounding factors, results showed that work–family lifecourse types remained associated with physical and mental health.
We added current partnership status, smoking, and indicators of family and friendship support in the second set of models (Models 2a and 2b in Table 3 and Models 4a and 4b in Table 4). None of these indicators were associated with physical health but having a current partner and more support from family and friends were associated with better mental health for both men and women. However, contrary to our expectation, there was limited evidence to indicate that these forms of support mediated the influence of work–family lifecourses on health as the coefficients related to work–family lifecourse type in most cases changed only marginally after including these indicators in the analysis. For example, the coefficient associated with the ‘lower SEP, early and large family’ group and mental health changed from −1.68 to −1.58 for men and from −2.46 to −1.98 for women. The exception was a significant change in the coefficients for childless people when the variables relating to current characteristics were added to the model. After adjustment for family and friendship support (Model 4b), childless women with a higher SEP indeed had better mental functioning than those in the ‘lower SEP, long work, two children’ group, indicating that the disadvantage of the childless (which is compensated by high SEP in the first set of models) is captured by a smaller support network.
In the second step of the multi-level analysis, we used growth curve models to analyse how health disparities associated with work–family lifecourse types changed over the subsequent five years. Figures 1 and 2 present predictions of SF-12 physical and mental scores by lifecourse types. Among both men and women, there was a declining trend in physical and mental health, which reflects ageing. The graphs for physical health show parallel health trajectories, indicating that this declining pattern was similar across different work–family types. Although the physical health of men in the ‘lower SEP childless’ group declined relatively slowly over time (Figure 1), the interaction coefficient indicated no significant differences in these changes. Similarly, the results for mental health suggest that men in the ‘lower SEP, unstable work, large family’ and ‘lower SEP, childless’ groups had a larger deterioration in mental functioning than those in the other lifecourse types. The ‘lower SEP, early family’ group was associated with poorer health at baseline but had a smaller decrease in the mental score over time. However, interaction terms were not statistically significant (see Table 3S in the online supplementary material).
Among women, the mental health of those in the ‘lower SEP, early family’ and ‘short working life’ groups was worse at baseline but remained stable (or slightly increased) over time. Conversely, women in the ‘higher SEP, two children’ group were the most advantaged at baseline but their mental health decreased faster over time. Interaction terms were marginally significant for the ‘lower SEP, early family’ group (coefficient = 0.47; CI = −0.06, 1.00) and significant for the ‘short working life’ group (coefficient = 0.52; CI = 0.02, 1.02), indicating some convergence in mental health trajectories over time. Figure 2 shows that the health differences between the ‘short working life’ and ‘lower SEP, long work, two children’ groups, while significant at baseline, almost disappeared at the end of the follow-up period.
Discussion
In this study, we used a large set of retrospective indicators to investigate how work–family combinations over the lifecourse are associated with physical and mental health in later life. We used a model-based approach to identify lifecourse types and examined physical and mental outcomes, and changes in these over time, for both men and women. We undertook latent class analysis separately for men and women as in these British cohorts born between 1933 and 1945 work and family lifecourses are highly gendered.
The results from multi-level analysis show a clear association between higher SEP and better health as well as some differentiation by family-building pattern and family–work combination. In line with our fourth hypothesis and a large amount of research showing that health disparities are stratified by educational qualification and socio-economic resources (e.g. Richards and Paskov, Reference Richards and Paskov2016), lifecourse types characterised by low SEP were associated with worse physical and mental health among both men and women. SEP was measured using level of education and the last occupation in life, which may provide a good summary indicator of work career and associated accumulation of resources. However, occupational position may be less useful an indicator for people who exited the workforce early in life. The use of latent class analysis, which allows the inclusion of several indicators of employment history to derive work–family types, may, in part, mitigate this problem by using measures of the length of working life. We additionally performed a sensitivity analysis for women in which we used partner's rather than own last occupation (if it was higher than own) in the derivation of classes and found the results were very similar to those presented in the text (see Tables 7S and 8S in the online supplementary material).
With regard to work–family combination, the results indicate that, in line with Hypothesis 2, lifecourse types characterised by lower SEP, early and large family were associated with the worst physical and mental functioning in later life. This is consistent with previous research on the UK showing that early motherhood and weak labour market ties were associated with worse health in middle life (McMunn et al., Reference McMunn, Bartley, Hardy and Kuh2006, Reference McMunn, Lacey, Kumari, Worts, McDonough and Sacker2016; Lacey et al., Reference Lacey, Sacker, Kumari, Worts, McDonough, Booker and McMunn2016a, Reference Lacey, Stafford, Sacker and McMunn2017; Benson et al., Reference Benson, Glaser, Corna, Platts, Di Gessa, Worts and Sacker2017). These previous findings can be extended to both men and women in later life, suggesting that people with lower SEP and early parenthood are the target group at risk of poor health in later life. In addition, our results show that older people who had a large family and weaker attachment to the labour market (the ‘short working life, large family’ group for women and the ‘lower SEP, unstable work, large family’ group for men) exhibited a lower mental but not physical health score. This finding is consistent with the third hypothesis, i.e. that men with an unstable work history had worse health in later life than those who had had steady long-term employment. In line with theories on stress exposure and cumulative disadvantages (e.g. Bartley and Plewis, Reference Bartley and Plewis2002; McDonough et al., Reference McDonough, Worts, Booker, McMunn and Sacker2015), lifetime adversities in family and work, which include early parenthood, divorce, unemployment and precarious work conditions, may produce psychological stress throughout the lifecourse which has detrimental effects on later-life health.
Previous studies of the influence of work–family lifecourses on the health of older women are few and results are not wholly consistent, possibly reflecting variations in populations, age groups and time periods studied, but some have suggested advantages for women with some work breaks for family responsibilities (Stone et al., Reference Stone, Evandrou, Falkingham and Vlachantoni2015). In this study, however, we found no differences in health between the ‘lower SEP, long work, two children’ and the ‘lower SEP, work breaks, family care’ groups (who had very similar SEP profiles). The results provide no evidence in support of our first hypothesis that for women health advantages were associated with work breaks for family care. Therefore, there are no indications on whether long careers are better or worse than work histories including interruptions arising from family responsibilities.
Two conflicting theories predict that health disparities are associated with work–family types. On one side, multiple roles in work and family may result in conflicting demands and stress; on the other, the role enhancement theory suggests that combining multiple roles generates health advantages in later life (Nordenmark, Reference Nordenmark2004). Our results provide partial evidence in support of the latter. Women who were mostly non-employed and had large families had a worse mental health than those who worked continuously for many years and those who combined work breaks with family care. However, there were no differences in physical health between women who seem to have prioritised family life over paid work (the ‘short working life, large family’ group) and those who occupied multiple roles in both domains (the ‘lower SEP, work breaks, family care’ group). Additionally, those who prioritised paid work over family (‘higher SEP, childless’) had worse physical but not mental health than women with a higher SEP and two children (‘higher SEP, two children’).
Our other two hypotheses were not strongly supported by the results presented in this study. Firstly, there was little evidence that work–family lifecourse types were associated with health because of differences in support from family and friends (Hypothesis 6), except in the case of higher SEP childless women. The mental health of childless women was no different from the reference group in the model not accounting for the influences of support network, but appeared better in the second model which adjusted for these. For these women, a smaller family network outweighed the mental health advantages of having higher SEP, which suggests that lacking family support offsets strengths in economic conditions.
Secondly, the results from growth curve models indicate that the mental health disadvantages of women in the ‘short working life, large family’ and ‘lower SEP, early and large family’ groups diminished over time. Health differences between women in the ‘short working life, large family’ and ‘lower SEP, long work, two children’ groups almost disappeared at the end of the follow-up period, but overall health disparities related to work–family lifecourse types were generally stable. Physical health decreased in a similar way across all work–family types, with those in the ‘lower SEP, early and large family’ group having the worst outcomes over the entire follow-up period. This provides only partial support to the hypothesis that health disadvantages related to large family and early motherhood may decrease over time, with individual ageing (Hypothesis 5).
In interpreting these results, some limitations need to be acknowledged. Firstly, the possible effect of health selection into different work–family trajectories cannot be wholly ruled out. Although we controlled for health conditions diagnosed during childhood and early adulthood and for some other early life characteristics, relevant issues such as mental health problems may have been underdiagnosed and underreported. Secondly, individuals’ attitudes and preferences are unobservable in the data and may be associated with both work–family lifecourse types and later-life health. Thirdly, given that employment histories are collected mostly in Wave 5, we selected 60 per cent of the original baseline sample, which may lead us to lose information and reduce variability in work–family typology. Fourthly, although the latent class analysis has the advantage of allowing synthesis of the complexity of individuals’ biographies into a limited number of lifecourse groups, this modelling strategy hampers the identification of causal effects. The results presented here are descriptive and many possible mechanisms may explain the observed associations. Despite these limitations, our study provides evidence on how individuals combine paid work with family life and accumulate health (dis)advantages throughout their lifecourses. The results show that people in lower SEP who become parents earlier and have large families are at risk of poor health in later life. This suggests that to tackle health inequalities we need to consider family lifecourses, as well as SEP. Providing more supports to families, especially young parents and those with lower levels of education, earlier in the lifecourse might be investigated further as a possible means of improving health in later as well as earlier life, and there is some evidence from other studies that family supports may have long-term benefits. Avendano et al. (Reference Avendano, Berkman, Brugiavini and Pasini2015), for example, exploited cross-national differences in maternity leave policies to investigate possible impacts on women's mental health later in life. They concluded that a more generous maternity leave at the time of the birth of the first child was associated with lower risks of depression in old age. Further work on identifying underlying mechanisms, and testing specific policy interventions, is needed, including analysis of later-born cohorts who have had different work-life patterns (particularly the case for women).
Supplementary material
The supplementary material for this article can be found at https://doi.org/10.1017/S0144686X19001752.
Funding
The research leading to these results has received funding from the European Research Council under the European Union's Seventh Framework Programme (FP7/2007–2013) (grant agreement number 324055).