

Background
The rates of problem gambling (PG) have been shown to vary greatly from country to country and within countries. The common quoted figure for problem or pathological gambling worldwide is between 0.5% and 2% (Productivity Commission, 2010; Thomas et al., Reference Thomas, Merkouris, Radermacher, Dowling, Misso, Anderson and Jackson2011; Volberg, Reference Volberg2004). It is well documented that most people who get into difficulty with gambling experience a range of problems, including mental health issues such as depression and anxiety (Goodyear-Smith et al., Reference Goodyear-Smith, Arroll, Kerse, Sullivan, Tse, Shepherd, Rossen and Perese2006; Kim, Grant, Eckert, Faris, & Hartman, Reference Kim, Grant, Eckert, Faris and Hartman2006; Quilty, Watson, Robinson, Toneatto, & Bagby, Reference Quilty, Watson, Robinson, Toneatto and Bagby2011) and dependence problems of alcohol and substance misuse (Baldo et al., Reference Baldo, Cristofoletti, Majori, Cibin, Peron, Dal Zotto and Zampieri2006; Griffiths, Wardle, Orford, Sproston, & Erens, Reference Griffiths, Wardle, Orford, Sproston and Erens2010; Hodgins, & el-Guebaly, Reference Hodgins and el-Guebaly2010; Kaminer & Haberek, Reference Kaminer and Haberek2004).
A major professional concern is the ability to identify and help those suffering from a particular condition as soon as possible. Although gambling has been of interest to many throughout history, the approach to treating gamblers has only been seriously considered in the past 40 years or so. Until recently, there has been no consistent view regarding the effective treatment for gambling problems. Instead, the principal approach to helping gamblers was either punitive (the gambler was treated as having committed an illegal act and was imprisoned or fined) or prohibitive (gambling was banned altogether). Both of these approaches to remedying problems with gambling were impositions by society rather than attempts to provide help to individual sufferers. In the 19th century there was a tendency to attempt to prevent the spread of gambling and so, by default, reduce the numbers of problem gamblers through legislation. Indeed, some of the earliest forms of harm minimisation/reduction could be described as coming from such legislation. For example, in Mississippi there was a law passed preventing the publication of betting information in newspapers (Churchill, Reference Churchill1894).
It was not until the turn of the 20th century that attention was paid to the formal treatment of gamblers. At this time, the movement in psychodynamic psychotherapy was beginning to develop and so, not surprisingly, it turned its attention to gambling (see Rosenthal, Reference Rosenthal2008, for review). Later, models based on behaviourism and cognitive principles began to emerge (Gooding & Tarrier, Reference Gooding and Tarrier2009). A number of other approaches have also been reported, with varying degrees of success. The most common of these are interventions based on motivational interviewing (MI). Overall, the evidence supporting such approaches is limited and frequently do not consider that MI is commonly used in other therapies such as Cognitive Behaviour Therapy (CBT; Thomas et al., Reference Thomas, Merkouris, Radermacher, Dowling, Misso, Anderson and Jackson2011).
Despite the development of such treatments, there is little in the way of clear empirical evidence to support any one treatment. A number of reviews have attempted to bring some light to this problem with treatments based on CBT and psycho-pharmacology beginning to show promise (Brewer, Grant, & Potenza, Reference Brewer, Grant and Potenza2008; Gooding & Tarrier, Reference Gooding and Tarrier2009; Pallesen, Mitsem, Kvale, Johnsen, & Molde, Reference Pallesen, Mitsem, Kvale, Johnsen and Molde2005; Pallesen et al., Reference Pallesen, Molde, Arnestad, Laberg, Skutle, Iversen and Holsten2007).
While there is this growing evidence for the effectiveness of CBT as a treatment for problem gambling (PG), the actual mechanisms of change are unclear (Walker, Reference Walker2005). A number of variants exist, ranging from behavioural approaches (Grant, Donahue, Odlaug, & Kim, Reference Grant, Donahue, Odlaug and Kim2011; McConaghy, Armstrong, Blaszczynski, & Allcock, Reference McConaghy, Armstrong, Blaszczynski and Allcock1983) to cognitive methods (Ladouceur et al., Reference Ladouceur, Sylvain, Boutin, Lachance, Doucet, Leblond and Christian2001) and combined cognitive and behavioural treatments (Battersby, Oakes, Tolchard, Forbes, & Pols, Reference Battersby, Oakes, Tolchard, Forbes, Pols, Zangeneh, Blaszczynski and Turner2008; Petry et al., Reference Petry, Ammerman, Bohl, Doersch, Gay, Kadden, Molina and Steinberg2006; Sabura, de Lisle, & Dowling, Reference Sabura, de Lisle and Dowling2011; Toneatto & Brennan, Reference Toneatto and Brennan2002). Although this may not pose a problem per se, it must be questioned what are the most effective approaches and which gambling populations benefit from the cognitive behavioural variants? One way of establishing the efficacy of different treatments offered under a common model such as CBT is to standardise those treatments and compare them in research trials. To date, this has only been done in two trials, both of which had limited power (Echeburua, Baez, & Fernandez-Montalvo, Reference Echeburua, Baez and Fernandez-Montalvo1996; McConaghy et al., Reference McConaghy, Armstrong, Blaszczynski and Allcock1983). The two emerging approaches of cognitive behavior therapists in the gambling field is that of disconfirming someone's erroneous beliefs (Ladouceur et al., Reference Ladouceur, Sylvain, Boutin, Lachance, Doucet, Leblond and Christian2001) or exposure based cognitive-behavioural interventions (Riley, Smith, & Oakes, Reference Riley, Smith and Oakes2011; Tolchard & Battersby, Reference Tolchard and Battersby1996, Reference Tolchard and Battersby2000).
The cognitive therapy (CT) approach of Ladouceur and colleagues addresses three common erroneous themes pertinent to gamblers. They include (1) an overestimation of the chance of winning, (2) belief that skills influence outcome and (3) erroneous beliefs of independent events and randomness. In their approach to treatment, anti-exposure advice is given whereby the gambler avoids any triggers to do with gambling. They therefore take the position that cognitive reappraisal alone will resolve the gambling problem (see Ladouceur & Lachance, Reference Ladouceur and Lachance2006, for overview of treatment). However, Toneatto and Gunaratne (Reference Toneatto and Gunaratne2009) noted that cognitive restructuring appeared to add nothing extra to predominantly behavioural approaches. A number of reported CT approaches apply active avoidance strategies (anti-exposure) of gambling cues (Petry, Reference Petry2005).
By contrast, in a study by Tolchard and Battersby (Reference Tolchard and Battersby1996) an attempt was made to unravel the important components of the exposure model. In this study, in-vivo exposure, imaginal exposure and imaginal desensitisation were tested on a number of subjects from a gambling treatment service. The two forms of exposure had better outcomes, with in-vivo exposure showing a more rapid symptomatic reduction than imaginal exposure or systematic desensitisation. The relaxation component of imaginal desensitisation appeared to add nothing extra. This is a similar finding with systematic desensitisation in anxiety disorders (Forsyth, Barrios, & Acheson, Reference Forsyth, Barrios, Acheson, Richard and Lauterbach2006).
In the only study to date comparing behavioural, cognitive and cognitive-behavioural treatments in PG, the general conclusion was that the cognitive-behavioural treatment was less effective (Echeburua et al., Reference Echeburua, Baez and Fernandez-Montalvo1996). Overall, the behavioural (exposure) treatment showed the greatest efficacy. However, the approach used to provide the cognitive-behavioural treatment was to sequentially add the two together, with exposure being carried out first. This doubled the length of therapy for the subjects compared to the exposure or cognitive restructuring groups. Subjects appeared to be unclear as to which approach they were following, reducing overall efficacy. A better option may have been to integrate the two approaches under a common CBT model. This integrated model has been used effectively in other treatments such as anxiety (Olatunji, Cisler, & Deacon, Reference Olatunji, Cisler, Brett and Deacon2010) and depression (Hollon, Stewart, & Strunk, Reference Hollon, Stewart and Strunk2005).
Aims and Hypothesis
The aim of this study was to demonstrate the efficacy of a unified CBT approach on treatment-seeking PGs through a clinical outcome evaluation. This approach combines the main CT principle of cognitive restructuring with the behavioural components of active exposure to gambling cues.
Methods
Participants
Two hundred and five subjects were referred from existing gambling treatment services in South Australia (BreakEven; 33%), mental health services (10%), medical practitioners (49%), state-wide service brochure/advertising/talks (3%) or family/friends (5%) and received an initial screening appointment within two weeks.
Demographic analysis revealed there were more women (58%) than men (42%). Subjects were significantly more likely to be divorced or separated than unmarried and married, χ2(3, 162) = 18.70, p < .001. Unemployment rates were also significantly higher than in the general population and the majority of gamblers were on low incomes, χ2(2, 132) = 45.09, p < .001. The common presentation was an employed, married female aged 36–45 and in a low paid job.
The initial screening appointment — held over two sessions — established the degree and nature of the presenting problem and assessed level of motivation and suitability for the program offered by the service. Subjects are either seen as outpatients, inpatients or in groups. The participants in this study are all from the outpatient program. All subjects consented to the study and completed a series of screening and treatment measures as described below. Therapists were Masters trained in CBT and were from a range of professions, including nursing, psychiatry and clinical psychology, who worked under the supervision of the authors.
Measures
The following measures were administered throughout treatment with the exception of the gambling screening tools which by the very nature of such instruments requires they only be used following the screening assessment.
1. Victorian Gambling Screen (VGS):
A 21-item tool measuring gambling over three subscales. The 15-item Harm to Self scale was used to determine problem gambling rates. From a total score of 60, any client scoring above 14 is classified as a pathological gambler and 21+ a problem gambler (Ben-Tovim, Esterman, Tolchard, & Battersby, Reference Ben-Tovim, Esterman, Tolchard and Battersby2001).
2. South Oaks Gambling Screen (SOGS):
20-item self-report questionnaire providing a cut-off score for pathological gambling using DSM criteria (American Psychiatric Association [APA], 1994). The accepted cut-off for problem gambling is 5. However, in Australia a score of 10 has been used in telephone surveys to reduce false positives. From a review of the SOGS, however, it was concluded that the use of the original cut-off score (5) reduced the number of false negatives in a clinical setting (Battersby, Thomas, Tolchard, & Esterman, Reference Battersby, Thomas, Tolchard and Esterman2002; Lesieur & Blume, Reference Lesieur and Blume1987). The standard cut-off scores were used, although few scored less than 10. Despite being based on the DSM-III criteria SOGS was used across all gambling services in South Australia and so was retained for this reason.
3. Beck Depression Inventory (BDI):
This self-report questionnaire provides severity cut-offs for depression into mild, moderate and severe, and is a validated and reliable measure of change over time (Beck, Ward, Mendelson, Mock, & Erbaugh, Reference Beck, Ward, Mendelson, Mock and Erbaugh1961).
4. Beck Anxiety Inventory (BAI):
This self-report questionnaire provides severity cut-offs for anxiety into mild, moderate and severe and is a validated and reliable measure of change over time (Beck, Steer, & Brown, Reference Beck, Steer and Brown1985).
5. Main Problem/Goals:
A 0 (no problem) to 8 (highest level of problem) visual analogue scale applied to an individual's statement of their main problem, described in behavioural terms, providing a client-centred measure of change over time (Marks, Hallam, Connolly, & Philpott, Reference Marks, Hallam, Connolly and Philpott1977). A typical client problem statement may read ‘I experience an urge to gamble daily which leads me to plays the Pokies [slots] spending more than I can afford resulting in feeling depressed and having marital problems’.
6. Work and Social Adjustment (WSA):
This generic measure of disability and handicap is a self-administered scale covering five areas of functioning (work, social leisure, private leisure, home management and close relationships) on a 0–40 scale (Marks et al., Reference Marks, Hallam, Connolly and Philpott1977; Mundt, Marks, Shear, & Greist, Reference Mundt, Marks, Shear and Greist2002).
7. BEN-Q:
A combined score taken from four Likert scales measuring gambling urge, state of financial problems, overall gambling severity and management of finances used by all gambling treatment services in South Australia (Elliot Stanford & Associates, 1998). The scoring of these items is from 0 to 8, with 8 representing the highest level of severity. Each item is considered separately and can also be combined into a single cumulative score ranging from zero to 32. This measure has not been formally validated to date. The BEN-Q also notes a range of gambling behaviours including frequency of gambling, time spent gambling and amount wagered.
Analysis
All demographic data was analysed using standard non-parametric tests. For the most part χ2 tests were used and Fishers exact test where appropriate. As this was not a comparison study all other data were analysed using correlation and t tests or other relevant parametric approaches.
Treatment: Unified CBT for PGs
A two-part assessment is carried out that establishes the nature of the main gambling presentation (including mental state examination and risk assessment) and a full psychosocial history placing the individuals gambling in context. The time between assessments is determined by the first interview. If the client was considered to be at serious risk of harm:
1. they would either be admitted to the inpatient programimmediately
2. the full assessment might be continued in the first session
3. the second appointment would be carried out within 2 days of the first or,
4. they had another appointment 1 week later.
Once assessment and all outcome measures had been completed, the main therapeutic process began. There were five components to the treatment:
1. stimulus control (sessions 1–2)
2. exposure (imaginal and in-vivo) (sessions 3–10)
3. cognitive re-appraisal (sessions 6–10)
4. relapse prevention (sessions 9–10)
5. follow-up (at 1 month, 3 months, 6 months and 1 year).
Stimulus control was implemented during the assessment phase to bring about some initial financial control. Such strategies included subjects giving control of their money to a partner, cancelling or not carrying credit cards and money, or planning their day so as to avoid contact with gambling triggers. A final intervention for casino gamblers was to help them self-exclude from the venue. It should be pointed out that all of these stimulus control methods were simply to bring about initial control. The overall aim of therapy was to encourage the client to regain control and so these controls would ultimately be removed over time. At this stage the client and therapist also discuss the possibility of a formal stop gambling day at some point in the future.
The exposure model closely follows that used in the treatment of obsessive-compulsive disorder (OCD) in which subjects work to identify their gambling triggers and establish a hierarchy of low to high urge responses (Foa et al., Reference Foa, Liebowitz, Kozak, Davies, Campeas, Franklin and Tu2007). The exposure continues throughout treatment. The first exposure tasks are then decided upon and practised in session before the client leaves to continue practising at home. In most cases, the first element of the exposure plan would be either an imaginal technique that works on gambling triggers at the lower urge response level, or in-vivo exposure to gambling cues, such as images of machines or horses. In all cases, the fundamental principles of exposure are adhered to, and this involves the use of graded tasks that are repeated (at least four times per week), prolonged (until there has been at least a 50% urge reduction while still confronted with the stimulus), and urge focused (where they do not use distraction or other methods to artificially reduce the urge). Relaxation is not encouraged at any point during the exposure task, but subjects are not discouraged from using it outside treatment. Throughout exposure tasks, all subjects keep a diary of success/failure. The aim of sessions with the therapist at this stage is merely to review progress of exposure tasks and to begin identifying core cognitive themes that arose from the practice. Exposure is designed to help gamblers confront their urges without acting on it and not encourage people to gamble.
Cognitive reappraisal begins when the client has carried out enough exposure to have had a significant reduction in urge. Then, in conjunction with exposure, the client and therapist — in session — begin to work on a better understanding of the client's beliefs related to gambling. The cognitive elements are an adjunct to exposure. This follows a typical cognitive approach of initially identifying the erroneous beliefs, evaluating the efficacy of having such thoughts, considering the alternatives and then confirming/disconfirming such beliefs in gambling situations (through exposure tasks or behavioural experiments depending on the nature of the belief being challenged).
Relapse prevention strategies are considered throughout therapy. However, in the final two sessions a specific focus on relapse is worked on with the client. This generally involves subjects considering previous relapse triggers, identifying where such triggers may be likely in the future, understanding the relationship between the triggers and negative emotional states, and then devising a strategy for ensuring such issues do not arise.
Results
Gambling Behaviours
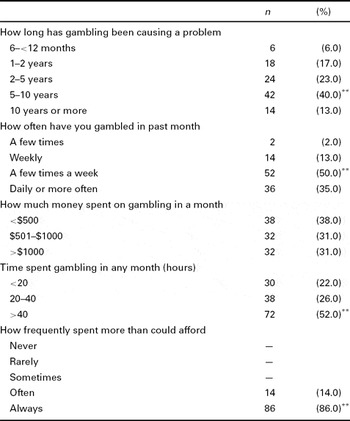
Table 1 summarises the gambling patterns observed in the sample. The results show that a greater proportion had gambled for longer than 5 years and had been doing so regularly at least three times per week. They also spent a considerable amount of time gambling every month and reported spending more money than they could afford.
Gambling Specific Behaviours

Note: *p < .05, **p < 001, χ2 (Goodness of Fit Test); numbers vary due to missing data.
Gambling Severity
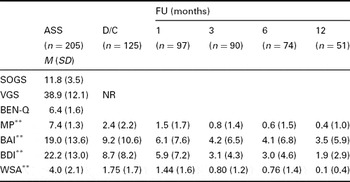
As would be expected from treatment-seeking gamblers, the mean level of perceived gambling severity as measured by the VGS and SOGS was considerably higher than the level identified by the cut-off scores on both measures (see Table 2).
M (SD) Scores for the Main Outcome Measures at Pre- and Post-Treatment, and at 1-, 3-, 6- And 12-Month Follow-Ups

Note: **All differences, p < .001. VGS (n) = 67; MP = main problem.
There was a medium positive correlation between the VGS and SOGS (r = .40). As the two measures approach gambling from differing viewpoints — public health versus medical — this low correlation would not be unusual as they examine different gambling domains. Both measures were moderately correlated with the BAI (VGS, r[67] = .39, p < .05; SOGS, (100) = .35, p < .05) and BDI (VGS, r[67] = .37, p < .05; SOGS, r[100] = .36, p < .05). Gambling severity did not, however, differ according to subjects’ demographic characteristics.
Main Outcome Measures
The results for the main problem scores and all other measures at pre-, post-treatment and at the 1-, 3-, 6- and 12-month follow-up evaluations are presented in Table 2. Subjects demonstrate a consistent improvement on all measures at all recording points. The main change score for gambling is the ‘main problem’; changes in psychopathology related to gambling are measured by the BDI/BAI and disability using the WSA. The specific gambling measures are used to confirm the status of the gamblers prior to treatment.
Overall, treatment resulted in a mean reduction from baseline on the Main Problem measure of 68.4% at post-treatment. As this was not a formal controlled trial and there was no comparison group so an intent-to-treat analysis was not undertaken.
The overall attrition rate in treatment was 30.2% (drop-out in assessment [DO-A] = 21.5% and drop-out in treatment [DO-T] = 8.8%). Therefore only the DO-T subjects began any active treatment leading to a total active dropout rate of only 8.8%. Subsequent attrition in follow-up from post-treatment was 22% (1 month), 28% (3 months), 41% (6 months) and 59% (12 months). When comparing completers with non-completers subjects dropping out during the treatment phase were more likely to be male, χ2(1, N = 205) = 5.31, p < .05.
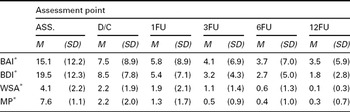
Table 3 highlights those subjects with full outcome measure data at all assessment points were similar to the sample as a whole. All subjects who attended follow-up sessions demonstrated significant improvement from baseline to 12 month follow-up (p < .001).
Outcome of Clients Who Completed All Measures to 12-Month Follow-Up (n = 51)

Note: Paired sample t tests revealed significant (p < .05, two-tailed) between Ass. and 12-month follow-up.
Follow-Up
In terms of overall completion there were no differences in gambling severity between those who completed treatment and those dropping out either at assessment or during treatment. More females continue to attend follow-up beyond the 12-month stage (30% males vs. 70% females, Fishers exact, p < .001). No age group differences were observed, nor any differences due to relationship, employment status or income. There were no differences on the main measures of anxiety and depression between the follow-up groups (completing beyond 12-month follow-up [COMP > 12FU] and those completing between 1 and 6 months [COMP < 12FU]).
Discussion
This study has reported on the outcomes of a group of outpatient problem gamblers with an overall recovery rate of 68%. Recovery was determined by the subjects own perception of their problem as measured by the Problem statement. A 50% or greater reduction in this score indicated recovery. This is certainly comparable to and in most cases superior to the outcomes obtain in other studies. There are few translational studies reported in gambling and so most participants in previous studies did not represent a typical clinical sample. This group of subjects would be considered to be at the high end of the severity spectrum, and so the results are all the more remarkable.
The use of exposure is commonly absent in CBT for problem gamblers. Based on the relative efficacy of exposure when used with gamblers, this would appear to be a missed opportunity. The use of a unified model of CBT with problem gamblers which combines exposure with cognitive restructuring was shown to be effective in helping individuals with gambling problems, with significant improvements observed for all outcome measures. In line with previous studies of problem gamblers, the use of exposure significantly enhanced the outcomes (Echeburua et al., Reference Echeburua, Baez and Fernandez-Montalvo1996; Pallesen et al., Reference Pallesen, Mitsem, Kvale, Johnsen and Molde2005). Where models of CBT have excluded exposure the overall outcome for gamblers has been lower (40–60% vs. 70%; Echeburua et al., Reference Echeburua, Baez and Fernandez-Montalvo1996; Ladouceur et al., Reference Ladouceur, Sylvain, Boutin, Lachance, Doucet, Leblond and Christian2001; Tolchard & Battersby, Reference Tolchard and Battersby2000). Unfortunately, more recent evidence is yet to emerge to confirm these findings. This may, in part, be due to professionals adopting CBT without considering the benefits or not that the unified approach used here may have.
All subjects in the treatment program in this study were provided with the unified approach, making it easier to attribute changes to the therapeutic process itself. However, one also needs to consider whether subjects were receiving other forms of help at the same time, or whether some subjects experienced a form of natural recovery. It has been shown that a large number of gamblers will recover without help (Slutske, Reference Slutske2006; Toneatto et al., Reference Toneatto, Cunningham, Hodgins, Adams, Turner and Koski-Jannes2008). In this study, no comparison was made with gamblers receiving other forms of help, or indeed subjects not receiving any at all, but it is clear from previous clinical experience that many subjects who seek specialist treatments of this nature have often had other interventions such as Gamblers Anonymous (GA) and general gambling counselling services. In future evaluations, it may be useful therefore to obtain data concerning client exposure to other interventions.
The mechanism of change must also be considered when choosing certain approaches. As has been shown here, the CBT treatment described encourages initial stimulus control in order to introduce exposure successfully. Once exposure has been established, the cognitive elements are then able to be introduced that supplement the effects of the exposure. Can one be justified then to refuse a potentially helpful approach simply because it is does not fit the therapist's model? In the case of this CBT model, the authors argue that there needs to be a clearly defined and replicable standard that could offer the best possible success to those subjects who are shown to benefit from treatment. This draws one's attention to who benefits in the first place. Blaszczynski and Nower (Reference Blaszczynski and Nower2002) would suggest gamblers require different approaches based on whichever pathway they represent. CBT (using exposure and cognitive restructuring) may be the best choice for the behaviourally conditioned gamblers, while a combination of CBT and medications may be helpful to the groups of gamblers experiencing personality-driven problems. CBT combined with medications may also be more appropriate for the emotionally affected gamblers where they are targeting psychopathology. Of course, these views are based on the current best evidence that supports both CBT and medications.
Conclusion
In summary, the study presented here demonstrated that a unified CBT treatment applied within a specialist treatment service can achieve success in reducing the degree of gambling-related problems experienced by subjects. However, the results also show that this only applies to those who agree to participate in the therapy and who remain in treatment. Further consideration must be given as to why some people do not return after the initial assessment and what factors contribute to drop outs during treatment.
This was not a randomized control trial and so further research is needed to compare this unified model with other approaches. Similarly, the exact point each component is introduced was not compared. The elements of the unified model were based on clinical observations over 10 years whereby it was noted exposure brought about an immediate physiological response to the urge to gamble. This initial urge reduction then makes it easier for the gambler to encounter gambling-related situations. The introduction of cognitive restructuring after this initial urge reduction was considered necessary to maintain positive gains. However, it may be that the alteration of erroneous beliefs may, in fact, make it more possible for someone to confront their urge in the real-life gambling situation. Also, it may not be exposure that is bringing about the change, rather cognitive restructuring alone with the exposure tasks simply acting as successful behavioural experiments. This view would appear unlikely as gamblers who entered a venue without having completed the graded elements of exposure were rarely able to withstand the urge and so continued to gamble. No amount of alternative beliefs about their gambling would change this.