INTRODUCTION
SOC is one of the main indicators of soil fertility in tropical farming systems and underlies soil fertility heterogeneity in sub-Saharan Africa (Murage et al., Reference Murage, Karanja, Smithson and Woomer2000; Musinguzi et al., Reference Musinguzi, Tenywa, Ebanyat, Tenywa, Mubiru, Basamba and Leip2013; Tittonell and Giller, Reference Tittonell and Giller2013; Zingore et al., Reference Zingore, Murwira, Delve and Giller2007). SOC plays an important role in boosting soil quality through formation of stable aggregates for increased protection of surface soils against runoff and erosion, improvement of ion exchange capacity and the functioning of biological components; reduction of bulk density; increasing of water holding capacity and macro and micronutrient availability (Carter and Stewart, Reference Carter and Stewart1995; Carter et al., Reference Carter, Angers, Gregorich and Bolinder2003).
The significance of SOC is apparent in chemically poor and highly weathered Ferralsols that are rich in sesquioxides and kaolinitic clays, and low in inherent nutrient retention capacity (IUSS Working Group, 2006; Steiner et al., Reference Steiner, Teixeira, Lehmann, Nehls, de Macêdo, Blum and Zech2007; van Breemen and Buurman, Reference van Breemen and Buurman1998). These soils can be unsuitable for crop production, particularly in areas where they are depleted of SOC (Tiessen et al., Reference Tiessen, Cuevas and Chacon1994). Studies conducted in sub-Saharan Africa reported high SOC to be closely associated with high soil fertility and yield, and the contrary was true for soils with low SOC (Ebanyat, Reference Ebanyat2009; Mtambanengwe and Mapfumo, Reference Mtambanengwe and Mapfumo2005; Tittonell, Reference Tittonell2007; Zingore et al., Reference Zingore, Murwira, Delve and Giller2007). However, in most of these studies, crop response to soils of low and high SOC registered poor nutrient use efficiencies. As such, it is hypothesized that there exists critical SOC concentrations that could result in optimal crop yield to mineral fertiliser application (Ebanyat Reference Ebanyat2009; Musinguzi et al., Reference Musinguzi, Tenywa, Ebanyat, Tenywa, Mubiru, Basamba and Leip2013).
Several authors, mostly in the temperate regions, have attempted to explore critical SOC concentrations to attain desirable soil characteristics, production potentials and a good functional ecology (Loveland and Webb, Reference Loveland and Webb2003). The majority have indicated 2% SOC as the critical concentration for structural stability (Carter and Stewart, Reference Carter and Stewart1995), water holding capacity (Thomasson and Carter, Reference Thomasson and Carter1989), cation exchange capacity (Tan and Dowling, Reference Tan and Dowling1984) and soil aggregate stability (Tisdall and Oades, Reference Tisdall and Oades1982). In tropical soils, however, the critical SOC concentration, particularly for optimal yield response to mineral N fertilizers is unknown. Exploring such critical concentrations would not only improve mineral fertilizer use efficiency but also act as a benchmark for soil fertility restoration.
Soil functionality at a given SOC concentration is dependent on the proportion of organic carbon fractions such as the sand-sized (labile fraction), silt-sized and clay-sized fractions (non-labile fractions) (Gregorich et al., Reference Gregorich, Beare, McKim and Skjemstad2006; Sherrod et al., Reference Sherrod, Peterson, Westfall and Ahuja2005; Weil et al., Reference Weil, Islam, Stine, Gruver and Samson-Liebig2003). The carbon concentrations in these fractions contributing to critical total SOC ranges remain unknown as far as responsiveness to applied mineral N fertilizer is concerned.
The objective of this study was therefore to determine the critical SOC concentrations and associated fractions for high AE and optimal grain yield response to added mineral N on a Ferralsol.
MATERIALS AND METHODS
Study site
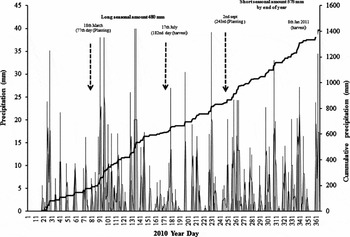
The study was conducted in 2010–11 in Lwamata sub-county in Kiboga district, a Woodland Savanna agro-ecological zone in central Uganda (Wortmann and Eledu, Reference Wortmann and Eledu1999). The altitude ranges from 1400–1800 m.a.s.l, with a mean annual temperature of 25 °C and a bi-modal rainfall pattern. The precipitation is often well-distributed across seasons. Planting is done in the first season of 2010 (March to April) and in the second season (August to September). In 2010, the first season received a total rainfall amount of 480 mm, while the second season received a total of 575 mm throughout the maize growing period (Figure 1). The dominant soils are Ferralsols, with low CEC, pH and <50% base saturation (IUSS Working Group, 2006).
Cumulative rainfall and daily precipitation in a Ferralsol in two cropping seasons in Central Uganda.

Experimental site selection and characterisation
The study area was purposively selected on the basis of soil type (in this case a Ferralsol) and a sub-county with soil fertility limitation was selected after formal discussions with the District Agricultural and Planning Officers. The sub-county is dominated by soils of low and high fertility and this provided the low and high ranges of SOC concentrations, all falling within the same climatic zone. Through further consultations with the sub-county local council leaders, extension service providers and farmers’ group leaders, two major maize producing parishes and two villages, that is, Ssinde (Lwamirindo and Kagererekamu villages) and Buninga (Kikalaala and Kigatansi villages) were identified. The villages in Ssinde and Buninga lie at altitudes ranging 1206–1250 and 1113–1158 m.a.s.l, respectively. They lie at 0 °53′02.33″N 31°50′12.48″E for Ssinde and 0°54′41.55″N, 31°49'52.52″E for Buninga.
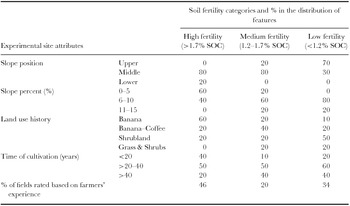
Together with the local village and farmers’ group leaders, a local criterion was developed to identify farmers with fields suitable for the study. The criterion included developing a list of maize farmers who were aged more than 40 years old, were willing to offer land and had past experience with soils of poor or good fertility. Local leaders in each village listed 15 farmers with fields of low, medium and good fertility. Eight farmers were randomly selected from the stratified fertility categories resulting in a total of 32 farmers from the four villages. A formal meeting was later held to introduce the project. Farmers’ sites were rated using Farmer's Field Experience (FFE) and a Scientific Rating approach with SOC. The sites that were rated based on FFE were sampled for quick soil tests to check for variability in the Ferrallitic textural properties (silt + clay) and SOC concentrations. Each farmer was requested to offer two sites (about 20 m apart) for the two seasons. A detailed site characterisation for soil properties, slope gradient and topographic positions was conducted. Each farmer was interviewed about the land use history and the time under cultivation (Table 1). Notably, the majority of medium to good fields (53% of all sites selected in the study area) were close to the homestead.
In-situ characterisation of experimental fields rated using soil organic carbon in selected sites in Kiboga district.

Four sub-soil samples were taken from each field using an auger at 0–15 cm depth and thoroughly mixed. Composite samples were obtained by quarter sampling and processed for laboratory testing. Soil pH was determined in 2.5:1 (w/v) water to soil suspension; extractable P using Bray 1 and exchangeable bases were extracted using 1 M ammonium acetate buffered at pH 7, followed by the determination of Na+ and K+ by flame photometry, and Mg2+ and Ca2+ by atomic adsorption spectrophotometry. Soil texture was determined by the hydrometer method (Bouyoucos, Reference Bouyoucos1936) (Table 2). SOC was determined using the wet oxidation (Walkley and Black, Reference Walkley and Black1934) and total N by the Kjeldah method.
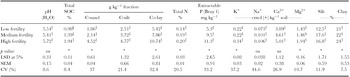
Mean values of soil properties in 0–15 cm topsoil for fertility categories derived using SOC; Low fertility (<1.2% SOC), Medium fertility (1.2–1.7% SOC) and High SOC (>1.7%) for 30 cultivated fields of a Ferralsol in Uganda.

LSD = Least Significant Difference, †, ‡, §letters represent soil properties that are significantly different across low, medium and high soil fertility categories (p < 0.05), ns = not significant, * represents significant values. Each fertility category consisted of 10 cultivated sites. Same letters along a column represent no significant differences observed on comparing means using the LSD. SEM is the Standard Error of Means and CV is the Coefficient of Variation.
Soil fertility ratings based on SOC concentrations were: low fertility (<1.2% SOC), medium fertility (1.2–1.7% SOC) and high fertility (>1.7% SOC). The rating was done in reference to the national threshold value of 1.74 % SOC (3% soil organic matter) that is recommended as the critical concentration for sustaining crop production in low-input tropical soils (Okalebo et al., Reference Okalebo, Gathua and Woomer2002). Soil properties such as SOC, total N, Na+ and Mg2+ varied significantly across the three soil fertility categories. All soils exhibited low P, with Bray 1 P values far below the recommended 15 mg kg−1 soil but some properties varied significantly with fertility (p < 0.05) (Table 2). Out of 32 farmers, 15 were willing to continue with the research trials. This included 8 farmers (16 experimental fields) in Ssinde parish and 7 farmers (14 experimental fields) in Buninga parish, providing a total of 30 sites for the long 2010A and short 2010B seasons.
Physical fractionation of soil organic matter
Soil samples from three soil fertility ratings of SOC were subjected to physical fractionation by submerging a 50 g air-dried composite sample in deionized water for 30 minutes. This was done to ensure that the aggregates were well slaked. The samples were placed into plastic bottles and 100 ml of sodium hexametaphosphate solution was added into each bottle. The bottles were tightly capped and shaken for 16 hours using an end-to-end shaker at 150 rpm. The contents were later separated using sieves of 250–2000, 250–63 and 63–2 µm. At each sieving stage, small aliquots of distilled water were used to rinse soil from the bottles. The sand, silt and clay-sized fractions, which included mineral and fine organic matter, were washed through the sieves using a fine jet of distilled water from a wash bottle. Aggregates were gently crushed using a spatula. The fractions retained on the 250 and 63 µm sieve consisted of coarse and fine sand, respectively, whereas the material passing the 63 µm sieve was the clay+silt suspension (Carter & Gregorich, Reference Carter and Gregorich2007; Okalebo et al., Reference Okalebo, Gathua and Woomer2002). The clay fraction was separated by pouring the remaining clay+silt suspension into the centrifuge bottles and centrifuging at approximately 1,000 rpm for 3 min (Elliot, Reference Elliott1986; Zhang et al., Reference Zhang, Ding, He, Yu, Fan and Liu2014). The silt sized fractions that settled after centrifuging were oven-dried at 65 °C. The clay suspension was oven dried at 105 °C to evaporate water and recover a sample of the clay fraction. All fractions were weighed and tested for SOC and total N. These fractions represented C in total SOC, with the coarse and fine-sized sand categorised as the labile fraction. Silt- and clay-sized fractions were categorised as non-labile fractions (Bayer et al., Reference Bayer, Martin-Neto, Mielniczuk, Pillon and Sangoi2001; Christensen, Reference Christensen2001; Feller and Beare, Reference Feller and Beare1997).
Experiment establishment
A total of 30 fields were used during the long (March to June) and short (September to December) rainy seasons. The experiments were laid out in a split-plot type of arrangement in a randomized complete block design. The experiments were established on field of low, medium and high fertility, of <1.2%, 1.2–1.7% and >1.7% SOC respectively. The fields were replicated five times for each category. The field types/fertility levels represented whole plots. The four nitrogen levels (0, 25, 50 and 100 kg N ha−1) applied as Urea were the sub-plots (6 m × 5 m).
To alleviate nutrient limitations, phosphorus (P) and potassium (K) were blanket applied at rates of 25 and 60 kg ha−1, respectively. Nutrient sources were Muriate of Potash for K and Triple Super Phosphate for P. Nitrogen and potassium fertilizers were split applied, with 50% at planting and 50% applied four weeks after planting. These were surface broadcast and later incorporated into the soil with a hand hoe to a depth of approximately 5 cm. Phosphorus fertilizer was basally-band applied.
An open pollinated maize variety (longe 5) was used as the test crop. Seeds were planted at the recommended maize spacing of 75 cm inter-row and 25 cm intra-row, resulting in a population of approximately 53,300 plants ha−1. Weeding was done twice, using hand-hoes. Major pest and disease problems that could mask the treatment effects were not observed, and therefore no control measures were employed.
Data collection and processing
At physiological maturity, maize was harvested by cutting plants at ground level from the four inner rows at each subplot. Total biomass (stover + grain) was weighed. The ears and stover were later separated and sun dried for about 15 days. The ears were shaved with hands to obtain the kernels (grain) and later weighed. Grain and stover were sub-sampled and oven-dried at 70 °C for 48 hours. The oven-dried weight was used to adjust both the grain and stover yields to a water content of 14%. The yield obtained was later used for calculation of AE (Ladha et al., Reference Ladha, Pathak, Krupnik, Six and van Kessel2005) (Equation 1).
 $$\begin{equation}
AE = (Y - Yo)/N
\end{equation}$$
Where AE = AE (kg (kg N)−1, Y = the grain yield at a given nitrogen fertilizer rate (kg), Yo = yield in the control (zero fertilizer) (kg) and N is the rate of nitrogen fertilizer applied (kg), all in per hectare equivalent.
Data analysis
Data were analysed using the GenStat Statistical Software (13th Edition). In order to cater for random effects of farmers’ sites, a linear mixed model, using GenStat Restricted Maximum likelihood (REML) algorithms was used (Equation 2).
 $$\begin{equation}
yijk = \mu + nt + cr + as + ncatrs + bi + wij + ijk
\end{equation}$$
The model describes the yield yijk from block i, whole-plot j, sub-plot k by the equation where the fixed part of the model consists of µ as the overall constant (grand mean), nt the main effect of seasons, cr the main effect of SOC classes r (where r is the SOC class assigned to unit ijk), as the main effect of nitrogen application at level s (where s is the nitrogen level assigned to subplot ijk), and ncatrs their interaction. The random effects consisted of bi the effect of block (farmers’ fields), wij the effect of whole-plot j within block i, and ijk the random error (i.e. residual) for unit ijk (which is the same as the subplot effect, the smallest units of the experiment). Tests for fixed effects were conducted and variance components estimated. The RELM analysis estimated the variance component for the random terms, and this measured the inherent variability of the terms, over and above the variability of the sub-units of which it is composed. Predicted means were generated for the various treatments and these were separated using the pooled Standard Error of Differences (SED) at p ≤ 0.05.
Two different mathematical models, that is, the Quadratic and Quadratic Plus Plateau were applied in the predictions (Alivelu et al., Reference Alivelu, Srivastava, Subba Rao, Singh, Selvakumari and Raju2003; Monbiela et al., Reference Monbiela, Nicholaides and Nelson1981; Srivastava et al., Reference Srivastava, Subba Rao, Alivelu, Singh, Raju and Rathore2006). The two models were used to fit all yield data as per Equations 3 and 4.
The Quadratic model is defined by Equation 3
 $$\begin{equation}
Y = a + bX + c{X^2}
\end{equation}$$
The Quadratic-plus-plateau model is defined by Equation 4
 $$\begin{equation}
Y = a + bX + c{X^2}
\end{equation}$$
 $$\begin{equation*}
{\rm{If}}\;X\; < \;C,\;Y < A,\;{\rm{if}}\;X \ge C,\;Y\; = \;A
\end{equation*}$$
Where Y = Grain yield (kg ha−1), X = amount of SOC (kg ha−1); a = intercept, b = linear coefficient, c = quadratic coefficient for both equations 3 and 4. In the quadratic model, maximum yield was obtained at first derivative, and corresponding SOC was considered as a critical value. For equation 4, C = critical SOC rate for optimal yield response, and it is the intersection of the quadratic response and the plateau line, while A = plateau yield. Both are constants obtained by fitting the model to the data.
Yield responses to SOC and N fertilizer (based on quadratic and linear models) were subjected to analysis of variance at 5% level of significance. A regression analysis was also conducted to test for significant differences of different yield response with fitted models to added N fertilizer. The slope (regression coefficient) of the fitted linear model and quadratic yield response were used to compare SOC with no fertilizer (reference) and those with added N fertilizer. Yield response was further aggregated into low, medium and high SOC categories. Linear models for yield response fitted in each SOC category were tested for significance (at 5% level). For unaggregated data, the Quadratic and Quadratic Plus Plateau were fit and maximum yields determined by differential calculus. The corresponding critical SOC concentrations were determined for each N treatment.
RESULTS
Yield response and agronomic efficiency to N fertilizer in soil categorised with SOC
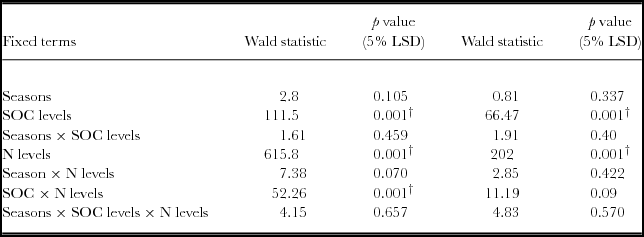
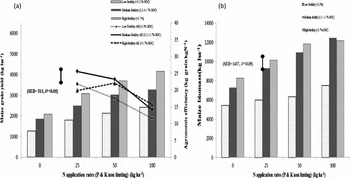
There was a significant yield response to N applications irrespective of soil fertility categories based on the RELM variance component analysis (Table 3, Figure 2). Maize grain yield differed significantly (p < 0.05) between soils with low SOC (<1.2%), and soils with medium to high SOC (>1.2%). Mineral N fertilizer application significantly increased grain yield (p < 0.05), while seasons did not. The interactions between SOC categories and N levels were significant (p < 0.05). Within each SOC category, grain yield was significantly influenced by N applications. Significant increases in grain yield (p < 0.05) were obtained with 50 and 100 kg N ha−1 compared to the control in all categories. In fields of high SOC, a 99% yield gain (4157 kg ha−1) was registered above the control for 100 kg N ha−1. Soils with low SOC yielded as high as 2400 kg ha−1 with 100 kg N ha−1, representing a 92% yield increase above the control. Highest agronomic efficiencies of 23.3 kg kg−1 N were obtained on fields with medium SOC at 25 kg N ha−1, and 22.1 kg grain kg−1 N for soil with high SOC concentrations (>1.7%) at 50 kg N ha−1.
REML variance components analysis for maize yield in fields rated with SOC as low, medium and high fertility in a Ferralsol in Uganda.
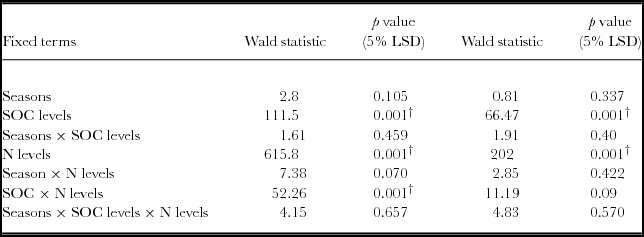
Fixed model = Constant + Seasons + SOC levels + N levels + Seasons × SOC levels + Seasons × N levels + SOC levels × N levels + Seasons × SOC levels × N levels. The Random model = Farmers’ sites + Farmers’ sites × SOC levels. LSD is the Least Significant Difference and †
Maize grain, agronomic efficiency (a) and biomass (b) under different N rates in a Ferralsol.

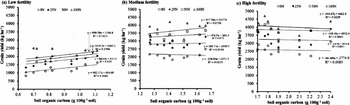
Based on aggregated data, it is only low fertility fields that registered significant yield response to SOC (p < 0.05). Yield response to N was significant in all categories (p < 0.05) (Figure 3). However, SOC and N interactions was not significantly different in the low, medium and high fertility fields.
Relationship between maize grain yield response and SOC under different N application rates for (a) low fertility (<1.2% SOC), (b) medium fertility (1.2–1.7% SOC) and (c) for high fertility (>1.2% SOC) in a Ferralsol in Uganda.

Critical SOC concentrations for optimal maize response to fertilizers
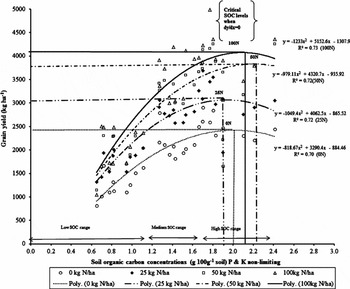
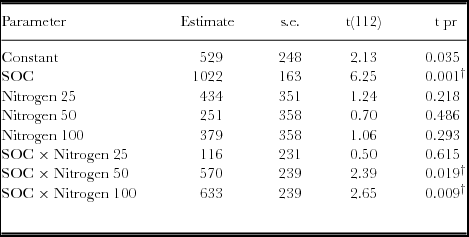
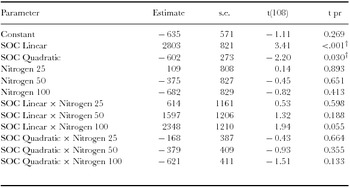
Generally, yield response to SOC was significantly different for both the linear and quadratic model based on the regression analysis (p < 0.05) (Table 5; Figure 4). Similar observations were obtained with the analysis of variance. However, when the linear model slopes were compared and tested, yield response based on SOC × N fertilizer rates was significantly different for 50 and 100 kg ha−1 (Table 4). For quadratic model fittings, there was no significant difference in the models’ response for added N fertilizer and SOC concentrations as the yield response decreases (Table 5). However, the relationship between grain yield and SOC concentrations under various N rates demonstrated positive responses (Figure 4, Table 6). Grain yield increased with SOC concentrations and N levels with a strong response associated with 50 and 100 N kg ha−1. Maximum yields were obtained within the high SOC category (>1.7%).
Non-linear model fitting of maize grain yield response to added nitrogen fertilizer under soils of different SOC ranges in a Ferralsol in Uganda.

Parameter estimates for linear relationships between maize yield and SOC as influenced by N fertilizer in a Ferralsol in Uganda.
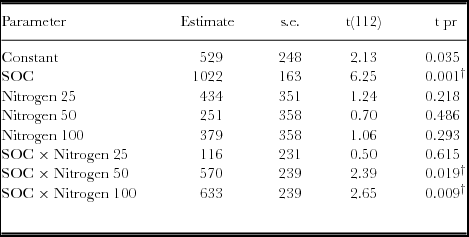
† denotes parameters that are significantly different from the reference model (without added N) at p < 0.05. The linear fitted terms = Constant + SOC + Nitrogen + SOC × Nitrogen.
Parameter estimates for non-linear (quadratic) relationships between maize yield and SOC as influenced by N fertilizer in a Ferralsol in Uganda.

† denotes parameters that are significantly different from the reference model (without added N) at p < 0.05. The non-linear fitted terms = Constant + SOC + Nitrogen + SOC × Nitrogen.
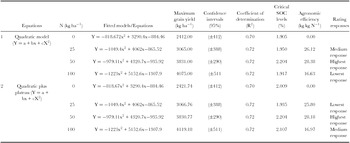
The coefficients of determination (R2) were as high as 0.72 for Quadratic and Quadratic Plus Plateau across the SOC concentrations for the 0 and 25 kg N ha−1 application rates. The two models predicted the highest grain yield responses at 50 kg N ha−1, and this corresponded with 2.204% SOC as the critical concentration. For all N rates, the models predicted 1.9–2.2% SOC as the critical concentration range (Figure 4, Table 6).
Regression model parameters and predictions for critical SOC amounts under different N fertilizer rates in a Ferralsol in Uganda.

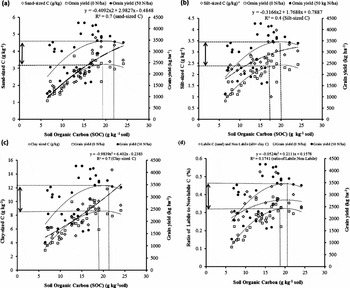
In reference to critical SOC concentrations at 0 and 50 kg N ha−1 (Figure 4), particle-sized C fractions associated with bulk SOC varied with yield. Non-linear regression analyses between sand, silt, clay-sized C fractions and total SOC and grain yield demonstrated positive relationships (Figure 5). Critical SOC concentrations for optimal grain yield (at 0 and 50 kg N ha−1) corresponded with sand-sized C of 3.1–4.7, silt-sized of 2.4–3.5 and clay-sized C of 8.1–12.1 g kg−1 (dotted lines in Figure 5). However, there was a weak relationship between SOC and the fraction of labile C (sand-sized) to non-Labile C (silt-sized C + clay-sized C). The labile C/non-labile C ratio that corresponded to the critical SOC concentrations was 32–46 g labile C to 100 g non-labile C.
Relationship between soil organic carbon, grain yield and sand-sized C (a), silt-sized C (b), clay-sized C (c) and the labile to non-labile C ratio (d), in a Ferralsol in Uganda (lines represent the optimal yields and the critical range of SOC concentrations, with the lowest (1.9%) attained at 0 kg N ha−1 and the highest (2.204%) at 50 kg N ha−1, with the corresponding C range associated with each fraction).

DISCUSSION
Yield response and agronomic efficiency to N fertilizer in soil categorised with SOC
High grain (3021–4157 kg ha−1) and biomass (grain+stover) (10,926–12,171 kg ha−1) yield responses to N applications (Figure 2), particularly in the medium and high SOC concentrations (>1.2%), express important insights in N management in a Ferralsol. SOC has proved to play a key role in sustainable soil and crop productivity (Steiner et al., Reference Steiner, Glaser, Geraldes Teixeira, Lehmann, Blum and Zech2008; Tiessen et al., Reference Tiessen, Cuevas and Chacon1994). The influence of SOC concentrations to N rates demonstrated the need for site specific nutrient management in highly heterogeneous farming systems (Zingore et al., Reference Zingore, Murwira, Delve and Giller2007). Taking into account the fact that majority of soil properties (texture, total N, Bray 1 extractable P, exchangeable K+, Mg2+) varied significantly with SOC, and this reflects its importance in soil fertility assessment.
However, in the low SOC category, a lot of effort is needed to restore soil fertility by employing techniques such as Integrated Soil Fertility Management (ISFM) or Conservation Agriculture (CA) (Vanlauwe and Giller, Reference Vanlauwe and Giller2006). The positive impact to added N in medium and high SOC, reflected in the high AE and yield, implied that there is need to maintain such concentrations. Maintaining satisfactory SOC concentrations would reduce on mineral N requirement, and increase nutrient use efficiency and yield. Such benefits were remarkable with 50 kg N ha−1 for 1.2–1.7% SOC and considerably less N requirements for SOC >1.7% SOC in achieving equivalent yields.
High AE that translated into high yield was associated with the medium and high SOC category, although results obtained for this soil were slightly lower than those of Vanlauwe et al. (Reference Vanlauwe, Kihara, Chivenge, Pypers, Coe and Six2011) who reported 31 kg grain (kg N)−1 in an earlier study on a fertile soil. The variability in AE and yield suggests that SOC concentrations influence nutrient capture and uptake efficiency. Tittonell et al. (Reference Tittonell, Zingore, Van Wijk, Corbeels and Giller2007) attributed the NUE variations to texture in sandy and clayey soils in Zimbabwe.
The linear relationship between yield and SOC within each category disclosed the degree of N responsiveness and effects of synergistic interaction which could not be understood with average concentrations (Figure 3). These results indicate the existence of critical SOC concentrations (thresholds) above which applied N may not result in significant yield responses.
Several theoretical analyses have been proposed to explain why soils may be responsive and non-responsive once certain thresholds have been reached (Tittonell and Giller, Reference Tittonell and Giller2013). In our study, soils with low SOC (<1.2%) were more responsive to N application than the medium to high SOC (>1.2%). Similar responsiveness has been reported in eastern Uganda with soils in former cattle kraals (niches of high fertility and SOC) being less responsive compared to other non-kraal sites (Ebanyat, Reference Ebanyat2009). SOC can play a major role in identifying fields with responsive and non-responsive soils, notwithstanding other physical and chemical drivers of soil quality. Low to non-responsiveness in high SOC can be linked to the concept of poor synchrony in which N release from SOC (>1.7%) was probably significant, and subsequently obscuring added mineral N adsorption and uptake by crop (Palm et al., Reference Palm, Gachengo, Delve, Cadisch and Giller2001).
Low crop yield in soils of low SOC can be attributed to low nutrient retention capacity associated with the soil, making it vulnerable to N leaching in an intensive humid rain-fed system (Figure 1; Renck and Lehmann, Reference Renck and Lehmann2004). Further studies on other physical and chemical properties such as structure, aggregate stability, toxicity associated with Al+ or soluble micro-nutrients, would further explain low yield responses in low SOC (Hue et al., Reference Hue, Craddock and Adams1986; IUSS Working Group, 2006). Several studies have shown that high SOC often results in positive benefits to improving soil bio-physical and chemical conditions such as micro-aggregate stability, reducing aluminium toxicity, and improving cation retention (Carter and Stewart, Reference Carter and Stewart1995; Carter et al., Reference Carter, Angers, Gregorich and Bolinder2003). Soils with low, medium and high SOC concentrations interact differently with N influencing their capacity to perform specific functions. However, critical SOC concentrations and influential fractions at which optimum yield can be achieved need to be identified, since this was not possible with categorical analyses alone. The next section applies non-linear regression techniques to determine these critical concentrations for various N rates.
Critical SOC concentrations for optimal maize response to fertilizers
Both the Quadratic and Quadratic Plus Plateau models predicted 2.204% SOC as the critical concentration for highest AE and optimal yield responses at 50 kg N ha−1 (Table 3). The significant yield responses (based on linear models) to application of 50 and 100 kg N ha−1 with change in SOC concentrations suggested good interaction between SOC concentrations and added N rates (Table 3). The lack of significant differences in quadratic models at SOC concentrations where the rate of yield response decreases suggests existence of a critical SOC range at which yield responses can be maximized. Although all the non-linear models predicted yield response, these must be applied with caution since yield response beyond critical SOC may be negative, given the model's symmetric curvature. The critical SOC predicted by the two models is important for tropical soil fertility, which is severely depleted, with negative nutrient balances (Bekunda et al., Reference Bekunda, Sanginga and Woomer2010; Sanchez et al., Reference Sanchez, Shepherd, Soule, Place, Buresh, Izac, Buresh, Sanchez and Calhoun1997). Our study has demonstrated positive model predictions for crop response to SOC under different N fertilizer rates (Alivelu et al., Reference Alivelu, Srivastava, Subba Rao, Singh, Selvakumari and Raju2003; Bélanger et al., Reference Bélanger, Walsh, Richards, Milburn and Ziadi2000; Cerrato & Blackmer, Reference Cerrato and Blackmer1990; Colwell, Reference Colwell1994; Mallarino & Blackmer, Reference Mallarino and Blackmer1992; Monbiela et al., Reference Monbiela, Nicholaides and Nelson1981; Neeteson and Wadman, Reference Neeteson and Wadman1987; Payton et al., Reference Payton, Rhue and Hensel1989; Srivastava et al., Reference Srivastava, Subba Rao, Alivelu, Singh, Raju and Rathore2006; Ussiri et al., Reference Ussiri, Mnkeni, MacKenzie and Seraoka1998). Other robust models such as the Mitscherlich model were not applied in this study but have been reported widely in predicting critical N and P levels for optimal crop production.
SOC is one of the consistent soil fertility indictors, and the critical concentrations can be targeted for soil fertility restoration and increased crop productivity. In this study, a critical SOC of 2.204% was obtained but this value is slightly higher than the 2% widely reported for optimal soil functions such as structural stability (Carter and Stewart, Reference Carter and Stewart1995), water holding capacity (Thomasson and Carter, Reference Thomasson and Carter1989), cation exchange capacity (Tan and Dowling, Reference Tan and Dowling1984), and soil aggregate stability (Tisdall and Oades, Reference Tisdall and Oades1982). The differences in the critical SOC concentrations were expected since the ability of SOC to boost soil quality differs from crop production processes with mineral fertilizer. The yield variations entirely depended on SOC concentrations and nutrient rates, thus resulting into a critical range (1.9–2.2%), which this study expresses as a ‘critical SOC range’ for maize production. The variation of critical SOC under low and high N rates implied that there are inherent differences influencing nutrient release and uptake, notwithstanding the role of SOC fractions. Economic analyses would further be necessary in the future to ascertain critical SOC associated with optimal returns. This SOC concentration would most likely be less than the 2.204% but within the critical range obtained in this study, and this could probably be denoted as the critical minimum SOC for smallholder farming.
The positive relationship between yield and SOC, and sand- and clay- sized C fractions demonstrates the importance of such components in soil fertility (Figure 5). Positive SOC relationship with sand-sized C, and yield agrees with earlier studies that describe the fraction as an active SOC pool (Olk and Gregorich, Reference Olk and Gregorich2006); and Swift and Woomer (Reference Swift and Woomer1993) literally defined it as ‘an organic fertilizer’. Mtambanengwe and Mapfumo (Reference Mtambanengwe and Mapfumo2008) also found a positive linear relationship between sand-sized C fraction and maize yield although in this study, the sand-sized C had less influence on yield compared to clay-sized C. This is probably because such fractions are associated with high C:N ratio, which influences micro-biota activity and can deter the efficiency of the mineralisation process (Christensen, Reference Christensen1992).
The clay-sized C fraction proved to be an important pool given its positive relationship with increasing SOC and grain yield. Low grain yield response to changes in SOC concentrations in medium and high fertility fields could be due to influential fractions (clay-sized) that dominated the soil C pool (Figure 5). Olk and Gregorich (Reference Olk and Gregorich2006) found out that the clay-sized fraction improves soil physical properties because it is highly enriched with microbial products (Christensen, Reference Christensen2001). What appears unclear is the contribution of the clay-sized C to N release mechanisms and the likely interactions with applied N and yield, thus attracting the need for further research.
Nevertheless, combining C fractions into the labile or non-labile C improved the understanding of SOC quality and the observed yield response. The ratio of labile C (sand-sized) to non-labile C (silt-sized C + clay sized C) showed correlations with bulk SOC and yield (Figure 5). The ratio of 32–46 g labile C to 100 g non-labile C fraction corresponded to critical SOC concentrations of 1.9 and 2.2% with 0 and 50 kg N ha−1 application rates, respectively. High N responses registered in this study could be linked to the low amounts of the active C fraction, which is key for N cycling in low-input agriculture. Efforts that can preserve this fraction are pertinent amidst high rates of SOC depletion due to cultivation (Feller and Beare, Reference Feller and Beare1997; Musinguzi et al., Reference Musinguzi, Ebanyat, Tenywa, Mwanjalolo, Basamba, Tenywa and Porter2014). Maintaining the critical concentration in the C pools is therefore necessary to sustain a good synchrony between added N and mineralisable N to boost maize yield. Building SOC to a ratio of 32–46 g labile C to 100 g non-labile C is recommendable since this presently translates into a critical SOC range of approximately 1.9–2.204% for optimal maize production.
CONCLUSION
A Ferralsol with SOC above 1.2% registered the highest yield responses to applied N. However, based upon the Quadratic and Quadratic Plus Plateau model predictions, the optimal grain yield responses to applied N levels are achievable in soils with 1.90–2.204% SOC concentrations. Sand- and clay-sized C fractions were positively related to total SOC and maize grain yield. At critical SOC concentration, the clay-sized C fraction in the range of 9–11 g kg−1 results in strong synergies in influencing N response and optimising yield.
With the high cost of N fertilizer for tropical smallholder farmers, building soil fertility to critical SOC concentrations (>1.2%) can easily promote efficient N fertilizer use. Application of appropriate soil and N management practices such as ISFM and/or CA can lead to achieving critical SOC required to boost productivity on a Ferralsol.
Acknowledgement
We are grateful to the World Phosphate Institute (IMPHOS) for providing the research funds for this work. We also thank the farmers who availed land for the experiments and the research assistants Mr. Richard Malingumu, Mr. Kenneth Senkosi and Mr. Charles Mugisa for supporting the experimentation process.