Introduction
Cordierite foam is widely used because of its unique performances, such as excellent thermal shock resistance, high melting point, high corrosion resistance, low thermal conductivity, low thermal expansion coefficient, and low dielectric constant [Reference Kuscer, Bantan, Hrovat and Malic1, Reference Janković-Častvan, Lazarević, Jordović, Petrović, Tanasković and Janaćković2, Reference Wu, Hu, Xu, Zhang, Lu and Wang3].
During the past years, the most common route for producing reticulate cordierite foams is the replication method [Reference Luyten, Thijs, Vandermeulen, Mullens, Wallaeys and Mortelmans4, Reference Matos, Dias, Oliveira and Costa5, Reference Oliveira, Dias, Fátima Vaz and Fernandes6, Reference Oliveira, Dias, Fátima Vaz and Fernandes7]. This method is based on the impregnation of a polymer sponge with a ceramic suspension to produce a macroporous ceramic exhibiting the same porous morphology as polymer sponge. Direct foaming and gel casting are also reported for the preparation of cordierite foams [Reference Silva, Correia, Silva, Oliveira, Ribeiro, Bordado and Ribeiro8, Reference Silva, Silva, Oliveira, Ribeiro, Bordado and Vaz9, Reference Sun, Zhang, Lu and Liu10]. Akpinar et al. reported a polymeric sponge replication method for the preparation of in situ cordierite foams [Reference Akpinar, Kuşoğlu, Ertugrul and Onel11]. The ceramic slurries containing kaolin, magnesia, and quartz mixtures were coated on a polymeric sponge and then using conventional and microwave sintering to obtain cordierite foams. Li et al. used kaolin, attapulgite, and magnesium oxide as starting materials with arabic gum added as a dispersant to prepare cordierite foam with a porosity of 87.65% by direct foaming and slip casting method, and the thermal conductivity was as low as 0.095 W/(m·K) [Reference Li, Cao, Feng, Gong and Cheng12]. The difficulty in preparing high-porosity cordierite foams was that the thermal expansion coefficients of the various components used to synthesize cordierite were different, resulting in large internal stresses during the firing process. Moreover, the higher the porosity was, the smaller the internal stress that the foam can withstand was, and cracks were easily generated during the firing process. Therefore, unlike a single oxide such as alumina foam, the porosity of cordierite foam was less than 90% in most of the reported literature. To prevent the generation of cracks during the synthesis of cordierite, Ye Li et al. directly used commercial cordierite powder as raw material and gum arabic as dispersant to successfully prepare cordierite foam with a porosity of up to 90% by direct foaming and gel casting method [Reference Li, Cao, Gong, Zhang and Cheng13]. This meant that the cordierite foam with a porosity of up to 96% in this paper was a major breakthrough. It also had a lower thermal conductivity.
In this work, we prepared cordierite foams by thermo-foaming of alumina–microsilica–talc dispersions in molten D-glucose anhydrous followed by reaction sintering at 1400 °C. The cordierite foam produced by this method had an ultra-high porosity (96%) and an interconnected cellular morphology. Coupled with the low thermal expansion coefficient of cordierite, this foam had great potential value in the application of gas catalytic support. The mechanism of interconnected cellular morphology and the effects of alumina–microsilica–talc powder to D-glucose anhydrous weight ratio on dispersion and foaming characteristics such as viscosity, foaming time, foam setting time, and foam rise, on properties such as density, porosity, cell size, cell window size, linear shrinkage and compressive strength, were investigated.
Results and discussion
Mechanism
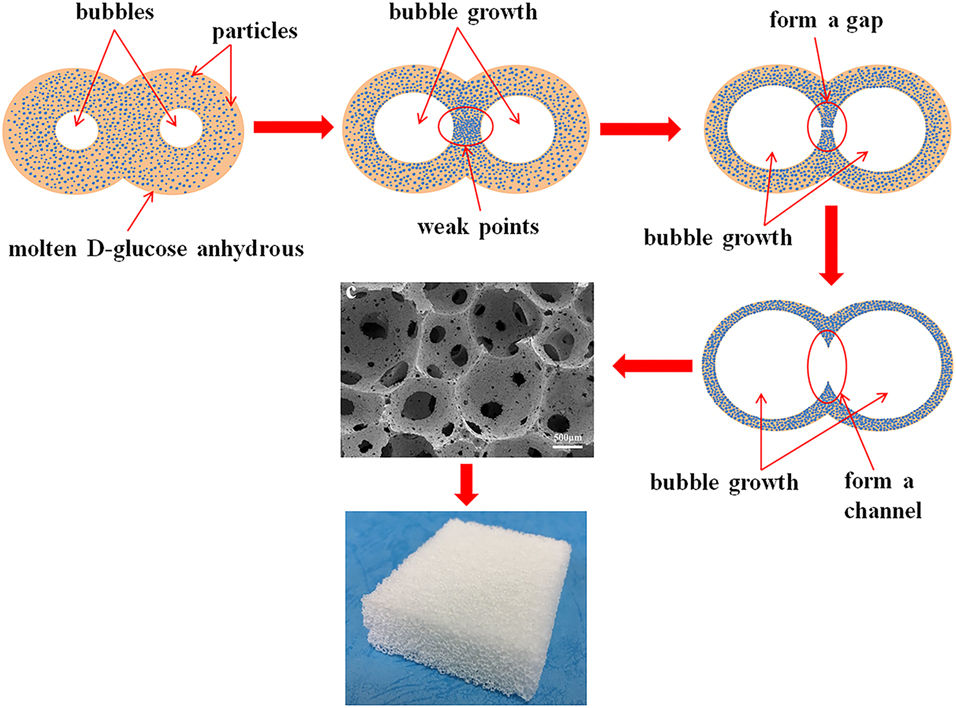
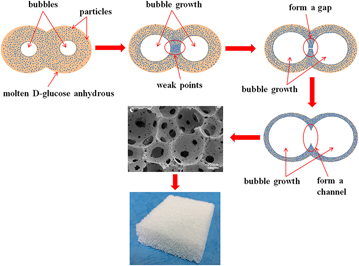
The foaming process mechanism diagram is given in Fig. 1, which contains four stages of bubble growth. At the initial stage of bubble growth, the ceramic particles were evenly distributed in the dispersion. The bubbles were generated by the water vapor of the condensation reaction between –OH and –OH. In the second stage of bubble growth, the growth of these bubbles caused the liquid phase in the middle of the two bubbles to be preferentially extruded, which resulted in the ceramic particles aggregating between the two bubbles and the molten D-glucose anhydrous layer thickness around these ceramic particles decreasing. Once the layer thickness was less than a certain value, the direct contact between particle and particle formed a weak point, which might lead to the rupture of the bubbles before setting. In the third stage, the further growth of the bubbles caused the particles in the middle of two bubbles to aggregate more severely, resulting in an increase in weak points, and eventually forming a gap connecting the two bubbles. The formation of this gap was driven by the growth of bubbles and the pressure difference between the two adjacent bubbles. In the last stage, the growth of bubbles caused the gap to gradually widen, finally forming a channel connecting the two bubbles. The dense particles around the bubbles transformed into a cell wall after setting, and this channel became a cell window to connect the two bubbles, which eventually combined into the foam that exhibited an interconnected cellular morphology.
Foaming process mechanism diagram. The growth of the bubbles caused the two bubbles to become an aggregated zone of weak points in the middle. Further growth of the bubble resulted in the formation of a gap between the two bubbles, connecting the two bubbles. Finally, the gap gradually widened as the bubble grew, forming a channel connecting the two bubbles. After the dispersion was solidified, the interconnected cell morphology was obtained.

Dispersion
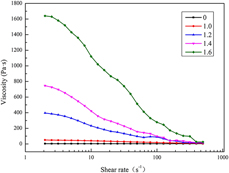
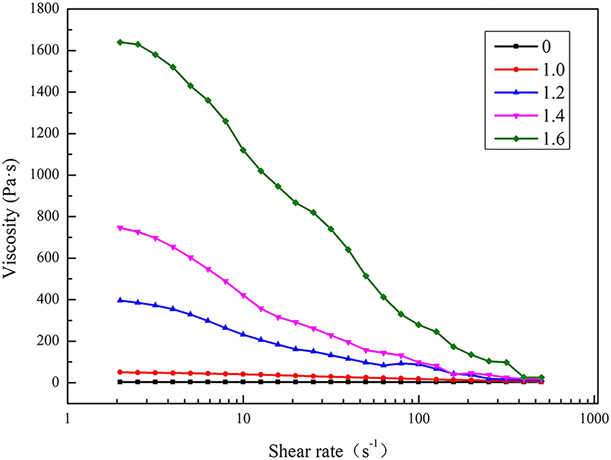
Figure 2 shows the viscosity versus shear rate plot of alumina–microsilica–talc powder dispersions in molten D-glucose anhydrous measured at 130 °C. All curves showed the shear thinning behavior and the viscosity of dispersion increased exponentially as the alumina–microsilica–talc powder to D-glucose anhydrous weight ratio increased, which was much higher than that of the mullite system (alumina + silica) prepared by the same method [Reference Vijayan, Wilson and Prabhakaran14]. Hereafter, alumina–microsilica–talc powder to D-glucose anhydrous weight ratio is denoted as W P/A. The shear thinning behavior was because the agglomerated large particles were broken up as the shear rate increased and the van der Waals force between the molecules became smaller. The viscosity increased with an increase in W P/A due to a rise in powder loading dispersed in molten D-glucose anhydrous, which enhanced the interaction between particles.
Effect of alumina–microsilica–talc powder to D-glucose anhydrous weight ratio (W P/A) on the viscosity of the dispersions at 130 °C. As the W P/A increased, the viscosity of the dispersion increased exponentially. Except for pure molten D-glucose anhydrous (0), the other dispersions (1.0, 1.2, 1.4, and 1.6) exhibited shear thinning behavior.
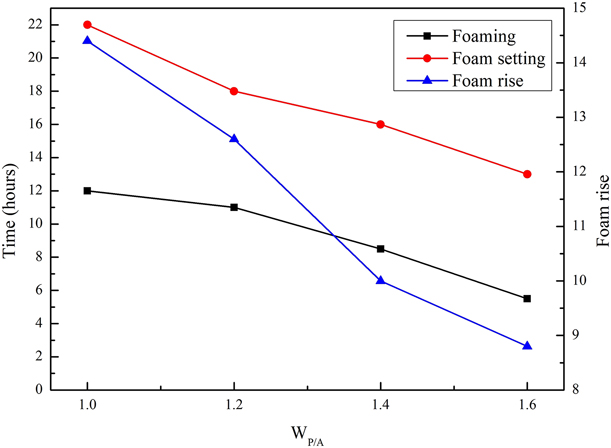
The dispersion was kept in an air oven at 130 °C and then underwent slow foaming by the nucleation and growth of bubbles in the viscous dispersions due to the water vapor generated as a result of –OH to –OH condensation [Reference Vijayan, Narasimman, Prudvi and Prabhakaran15]. The foamed dispersions set into hard foam bodies due to the further polymerization through –OH condensations, which formed a layer of hard organic polymer surface. The foaming time, foam setting time, and foam rise were closely related to the W P/A. Figure 3 shows the effect of W P/A on the foaming time, foam setting time, and foam rise of alumina–microsilica–talc powder dispersions in molten D-glucose anhydrous at a foaming temperature of 130 °C. It could be found that when the W P/A increased from 1.0 to 1.6, the foaming time and foam setting time decreased from 12 to 5.5 h and 22 to 13 h, respectively, which indicated that the ceramic particles could catalyze the –OH condensations. At the same time, the foam rise reduced from 14.4 to 8.8. While the ceramic powder loading increased, the molten D-glucose anhydrous layer thickness around the ceramic particle decreased, resulting in the more weak points and the bubbles rupturing at a lower growth degree, which accounted for a reduction in foam rise with the W P/A increasing from 1.0 to 1.6.
Effect of alumina–microsilica–talc powder to D-glucose anhydrous weight ratio (W P/A) on the foaming performances of the dispersions at 130 °C. As the W P/A increased, the time of foaming and foam setting reduced, and the foam rise also decreased.

Microstructure
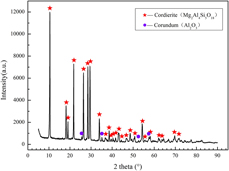
XRD pattern of cordierite foam synthesized at 1400 °C is given in Fig. 4, which shows that all XRD patterns are the same at various W P/A. As shown in XRD pattern, cordierite was the major phase, and a trace amount of corundum was presented in this pattern. In the two crystal phases, the fraction of cordierite phase was about 93% and the rest was corundum phase.
XRD pattern of cordierite foam synthesized at 1400 °C. As shown in the XRD pattern, cordierite was the major phase, and a trace amount of corundum was present in this pattern.

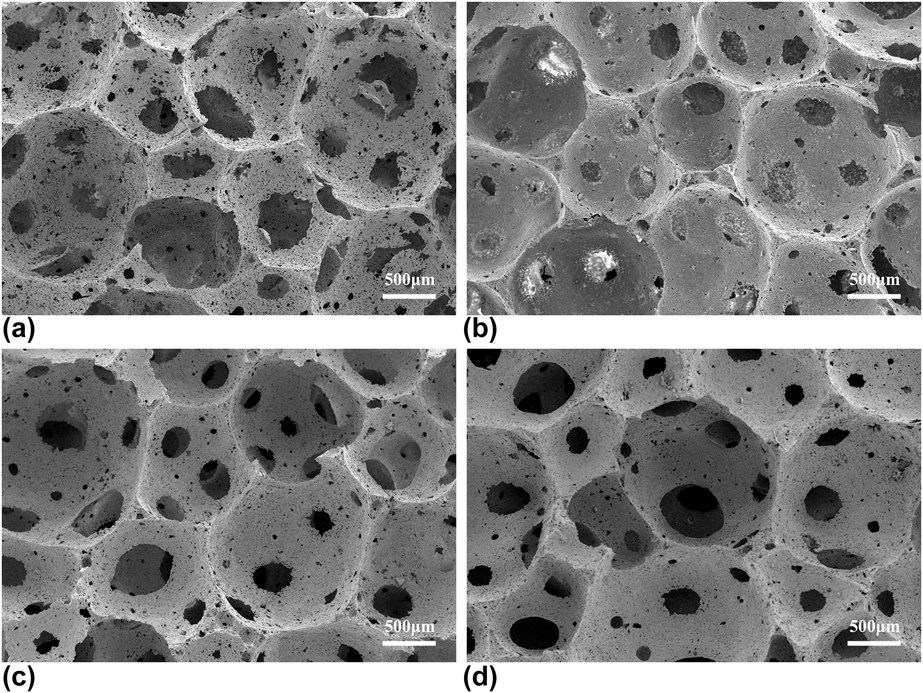
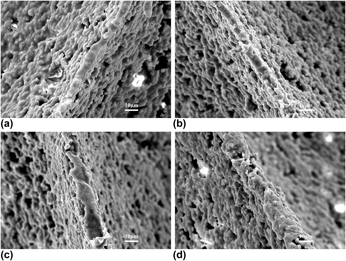
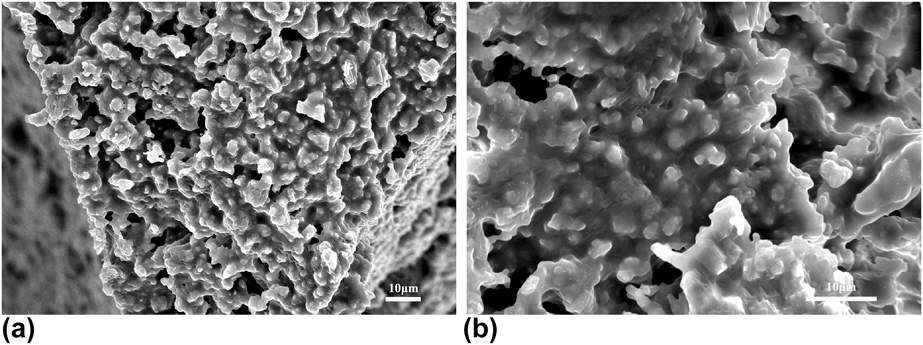
The SEM photomicrograph of cordierite foams prepared at various W P/A is shown in Fig. 5. The foams exhibited an interconnected cellular morphology because of their ultra-high porosity and a large number of cell windows on the cell walls. The cell windows were derived from two parts. On the one hand, the organic polymer in the green body burned out, leaving some windows on the cell wall to connect each cell. On the other hand, the cell windows were generated in relatively thin region between two spherical bubbles during the foaming process. This region ruptured to form a cell window connecting the two bubbles, which was dependent on the viscosity of dispersion and the number of weak points in this region. The cells in this cordierite foam were evenly distributed and had a uniformly good sphericity. Most of the spherical cells were connected by circular-shaped windows, except the partial cells in Fig. 5(a). The cells in Fig. 5(a) were connected by some irregular windows due to the fact that these bubbles had been growing until the limit during foaming, which caused each of the two bubbles to share a very thin cell wall and then suddenly rupture. Comparing the morphology in Figs. 5(b)–5(d) with a, the cell walls gradually became thicker with the W P/A increasing from 1.2 to 1.6. The gradually thickened cell walls can be more intuitively observed in Fig. 6. The increase in W P/A enhanced the ceramic powder loading in dispersion, which not only increased the viscosity of the dispersion, but also increased the number of weak points mentioned above due to the possibility of direct contact between particles and particles on the rise. Theoretically, the greater the viscosity was, the larger the bubble size could be obtained when the foaming was completed. However, the increase in viscosity also caused the dispersion to be more difficult to disperse evenly, which led to a rise in the number of weak points. So the rise in weak points caused by the two factors resulted in the bubbles to rupture and connect to each other at a lower foaming degree, which formed a thicker cell wall. The SEM photomicrographs of the strut region and cell wall are shown in Fig. 7. Synthesized cordierite particles were irregularly stacked to form complex porous struts and cell walls, which formed a large number of micropores that could enlarge the specific surface area of cordierite foam, but reduced its compressive strength.
SEM photomicrographs of cordierite foams prepared at various alumina–microsilica–talc powder to D-glucose anhydrous weight ratio (W P/A) of (a) 1.0, (b) 1.2, (c) 1.4, and (d) 1.6. The foams exhibited an interconnected cellular morphology and a large number of cell windows on the cell wall. The cell size and cell window size decreased first and then increased with the increase in W P/A. At the weight ratio of 1.2, both sizes were the smallest.

SEM photomicrographs of the cell wall thickness at various alumina–microsilica–talc powder to D-glucose anhydrous weight ratio (W P/A) of (a) 1.0, (b) 1.2, (c) 1.4, and (d) 1.6. The cell wall thickness was the minimum distance between two adjacent cells, which gradually thickened as the W P/A increased.

SEM photomicrographs of (a) strut and (b) cell wall of the cordierite foams. The strut was the triangular region in the middle of three cells that connected each other. Synthesized cordierite particles were irregularly stacked to form complex porous struts and cell walls.

It is well known that in all shapes, the spherical shape has the largest surface area in the case of equal volume. Moreover, porous cell walls facilitated the adsorption of large-specific-surface-area materials. Therefore, the cordierite foam with an interconnected cellular morphology had a large specific surface area, which was beneficial to increasing the contact area between the gas and the catalyst in the gas catalytic process. In addition, the efficiency of gas catalysis was related to the pore structure, and the irregular motion of the gas could increase the catalytic activity of the gas [Reference Silva, Silva, Oliveira, Vaz and Ribeiro16]. The randomness of cell windows on cell walls could exacerbate the degree of gas turbulence and increase the residence time of the gas, suggesting that this cordierite foam also had the effect of increasing gas catalytic activity.
Properties
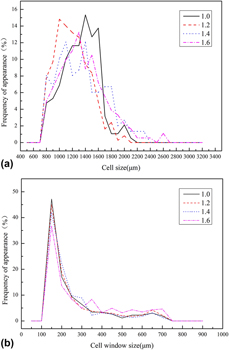
The cell size distributions (CSD) of the cordierite foams obtained from various W P/A are illustrated in Fig. 8(a). At W P/A of 1.0, the CSD of foams were d 10 = 903 μm, d 50 = 1296 μm, and d 90 = 1582 μm, and the average size was 1275 μm. Increasing the W P/A to 1.2, the average size decreased to 1151 μm and also the CSD were diminishing to d 10 = 817 μm, d 50 = 1126 μm, and d 90 = 1498 μm. From then on, the CSD and average size were increasing with the increase in W P/A. As the W P/A was 1.4, the CSD were enlarging to d 10 = 836 μm, d 50 = 1246 μm, and d 90 = 1766 μm, and the average size increased to 1290 μm. Moreover, the CSD at a larger W P/A of 1.6 were d 10 = 881 μm, d 50 = 1271 μm, and d 90 = 1816 μm, and the average size was 1312 μm, which were the widest CSD and the largest average size. At the W P/A of 1.2, the cell size decreased because the enhanced powder loading caused the number of weak points to increase, resulting in a decrease in bubble stability, which was not offset by an improvement in bubble stability due to the increase in viscosity. Thereafter, as the W P/A increased, the viscosity of dispersion gradually increased, and the bubble became more stable until it was greater than the influence of weak points on bubble stability, which led to an increase in cell size. It could be also seen that the range of CSD became wider with an increase in W P/A. As for the cell window size in Fig. 8(b), it had a similar change tendency with the cell size except that it exhibited a narrow unimodal distribution.
Cell and cell window size distribution of cordierite foams obtained from various alumina–microsilica–talc powder to D-glucose anhydrous weight ratio (W P/A). The cell size and cell window size distribution were obtained by the statistics of more than 500 sizes by binarization analysis, respectively. (a) The peak of the highest frequency of the CSD moved first to the left and then to the right as the W P/A increased, and the peak gradually decreased, and the cell size was uniform. (b) The cell window size distribution exhibited a narrow unimodal distribution. This meant that except for some large cell windows, the size of most cell windows was similar.

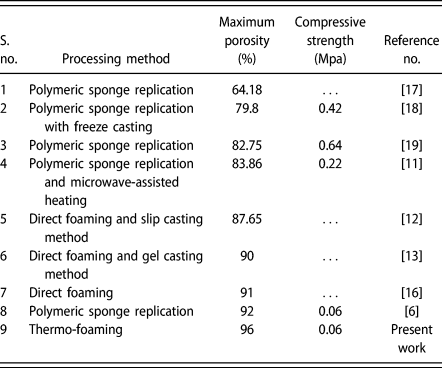
The bulk density, linear shrinkage, porosity, cell size, cell window size, and compressive strength of cordierite foams with various W P/A are given in Table I. The bulk densities of cordierite foams increased from 0.102 to 0.226 g/cm3 when the W P/A increased from 1.0 to 1.6. The corresponding porosity values were in the range of 96.0–91.1%. And the thermal conductivity at a porosity of 96.0% was as low as 0.057 W/(m·K). Due to the enhanced powder loading, the proportion of organic polymer in green body was reduced, and the linear shrinkage of cordierite foams decreased from 13.0 to 6.9% as the W P/A increased from 1.0 to 1.6. The maximum compressive strength was 0.28 MPa at the W P/A of 1.6, which was higher than that of cordierite foams with similar porosity in other studies [Reference Oliveira, Dias, Fátima Vaz and Fernandes6, Reference Akpinar, Kuşoğlu, Ertugrul and Onel11]. The porosity and compressive strength of cordierite foams prepared by various methods are listed in Table II. The porosity of the cordierite foam prepared by the thermo-foaming method was unprecedented, and it also had a relatively high compressive strength in these cordierite foams.
Effect of W P/A on bulk density, linear shrinkage, porosity, cell size, cell window size, and compressive strength of the cordierite foams.

Porosity and compressive strength of cordierite foams prepared by various methods.

Conclusions
The cordierite foams prepared by thermo-foaming had a porosity of up to 96.0%, and the corresponding thermal conductivity was as low as 0.057 W/(m·K). The foams exhibited an interconnected cellular morphology and a large number of windows on cell walls, which could increase the contact area and residence time of the gas with the catalyst during gas catalysis. The porous cell walls could also improve the adsorption area. The W P/A affected the viscosity of the dispersion and the number of weak points. In the foaming process, the viscosity determined the critical dimension of the bubbles, while the weak points limited the growth degree. The foaming time, foam setting time, and foam rise reduced with an increase in W P/A. The cell size and cell window size decreased first and then increased with the increase in W P/A, whose minimum values were at the W P/A of 1.2. The thickness of cell walls increased as the W P/A increased. While the W P/A increased from 1.0 to 1.6, the linear shrinkage of samples decreased from 13 to 6.9% and the density increased from 0.102 to 0.226 g/cm3. The maximum compressive strength was 0.28 MPa at the W P/A of 1.6.
Experimental procedure
α-Alumina powder (Kaifeng special Refractories Co., Ltd., Kaifeng City, China, d 50 = 2.373 μm), microsilica powder (Elkem 951 U, d 50 = 0.602 μm), talc powder (Shanghai Macklin Biochemical Co., Ltd., Shanghai, China, d 50 = 3.143 μm), and analytical-reagent-grade D-glucose anhydrous (Sinopharm Chemical Reagent Co., Ltd., Shanghai, China.) were used as raw materials.
According to the stoichiometric composition of cordierite (13.7 wt% MgO, 34.93 wt% Al2O3, and 51.37 wt% SiO2), alumina–microsilica–talc mixtures were prepared. The mixtures of various weights and a certain amount of D-glucose anhydrous were homogenized in a rotating polyurethane bottle at a speed of 400 rev/min with ZrO2 balls as the abrasive media for 6 h. Then the mixtures and D-glucose anhydrous were heated in a rectangle mold at 195 °C in an air oven for melting the D-glucose anhydrous. The melt was then stirred evenly with a glass rod to achieve uniform dispersions of powder particles in molten D-glucose anhydrous. The dispersions thus obtained were kept in an air oven at 130 °C with a certain time for forming and setting. After the completion of setting, the demolded foamed bodies were cut into rectangular bodies and then sintered at 1400 °C in an air atmosphere. The heating rates used were 60 °C/h from room temperature to 500 °C and 120 °C/h from 500 °C to 1400 °C, respectively. A holding time of 3 h was given at 500 and 1400 °C.
During foaming, the foam height was visually observed every 15 min. The time after which there was no further increase in the foam height was measured as the foaming time. After the completion of foaming, the foams were physically inspected at an interval of 1 h. The time required for the soft foam to get transformed into a hard one was determined as the foam setting time. The ratio of the initial height of the powder dispersion to the final height of the solid foam was taken as the foam rise [Reference Vijayan, Narasimman, Prudvi and Prabhakaran15, Reference Vijayan, Wilson and Prabhakaran20]. The viscosity of the dispersions was evaluated at 130 °C using a rheometer (MCR 301 Anton Paar Physics, Graz, Austria) with the plate and plate measurement system (PP25, 25 mm diameter) by logarithmic addition. The zero gap was 1.0 mm. The shear rate used was in the range of 1–500 s−1. Phase compositions of cordierite foams were characterized by X-ray diffraction with Cu-Ka radiation (X′ Pert Pro; Philips, Eindhoven, the Netherlands, using Ni-filtered, Cu-Ka radiation). And the fraction of each crystal phase was measured by semiquantitative method. The microstructures of cordierite foams were observed on the fractured surfaces using a scanning electron microscope (SEM, JSM-6610, JEOL, Tokyo, Japan). Cell size and cell window size of the samples were measured using a microimage analysis and process program (MIAPS, Precise, China) from the SEM microstructure. The density of cordierite foams was calculated by mass and dimension of samples with regular shapes. A Micromeritics AccuPyc 1330 was used to measure the true density of sintered cordierite foams. The total porosity was calculated by the following formula [Reference Huang, Li, Li, Wang and Wang21]:
 $${P_{\rm{t}}}\left( \% \right) = 100\left( {1 - {{{\rho _{\rm{b}}}} / {{\rho _{\rm{t}}}}}} \right)\quad ,$$
where P t is total porosity; ρb, bulk density; and ρt, true density. The sintering shrinkage was calculated from the dimensions of the foam bodies before and after reaction sintering. The compressive strength measurement of the cordierite foams was carried out using a universal testing machine (ETM, Wance, Shenzhen, China) at a crosshead speed of 0.5 mm/min with 50 × 40 × 12 mm samples (ASTM standard C365/365M-05). Five samples were used to calculate the average compressive strength. The thermal conductivity of cordierite foams was measured by Hot Disk (TPS 2500) at room temperature.
Acknowledgments
This work was supported by the National Natural Science Foundation of China (Grant Nos. 51772221 and 51502213) and the Key Program of Natural Science Foundation of Hubei Province of China (Grant No. 2017CFA004).