INTRODUCTION
The ability to switch fluidly and rapidly between tasks is an important skill frequently used in everyday situations and relevant for adaptive behavior. As an example, consider the multiple shifts between tasks that can occur when preparing a meal, such as coordinating gathering the spices with chopping the carrots and monitoring to see if the water has boiled. Executive control processes, which supervise the selection, initiation, execution, and termination of each task, are generally considered to regulate task switching (e.g., Baddeley, Reference Baddeley1986; Logan, Reference Logan1985; Norman & Shallice, Reference Norman, Shallice, Davidson, Schwartz and Shapiro1986; Rubinstein et al., Reference Rubeinstein, Meyer and Evans2001). In individuals with mild cognitive impairment (MCI), recent research suggests the presence of subtle executive deficits in addition to episodic memory impairment (e.g., Baudic et al., Reference Baudic, Barba, Thibaudet, Smagghe, Remy and Traykov2006; Crowell et al., Reference Crowell, Luis, Vanderploeg, Schinka and Mullan2002; Nordahl et al., Reference Nordahl, Ranganath, Yonelinas, DeCarli, Reed and Jagust2005; Royall et al., Reference Royall, Palmer, Chiodo and Polk2004). In this study, we further examine executive control processes in individuals with MCI using a task-switching paradigm.
With regard to task switching, several retrospective and prospective studies of individuals who later develop Alzheimer’s disease (AD) have found neuropsychological measures requiring set shifting abilities (e.g., Trails B) to be predictive of AD onset (e.g., Albert et al., Reference Albert, Moss, Tanzi and Jones2001; Artero et al., Reference Artero, Tierney, Touchab and Ritchie2003; Chen et al., Reference Chen, Ratcliff, Phil, Belle, Cauley, DeKosky and Ganguli2000; Saxton et al., Reference Saxton, Lopez, Ratcliff, Dulberg, Fried, Carlson, Newman and Kuller2004). However, one problem with many neuropsychological measures is that, in addition to set-shifting, task performance is dependent on other skills (e.g., visuospatial learning, speeded processing). Wetter et al. (Reference Wetter, Delis, Houston, Jacobson, Lansing, Cobell, Salmon and Bondi2005), in a recent study of APOE e4 positive individuals, attempted to disentangle the effects of other processes from task switching. Using the D-KEFs Color-Word Interference Test, these researchers found that the e4 group performed more poorly than the non-e4 group only in the Inhibition/Switching condition of the test, suggesting that difficulties with reading speed, naming speed, and response inhibition could be ruled out. However, it still remained unclear whether the e4 group’s difficulty with the Inhibition/Switching condition was related to the dual nature of the task (suggesting processing load difficulties), the task switching required or both.
In the cognitive psychology literature, task-switching paradigms are considered one of the best laboratory preparations by which to investigate executive control processes (Logan, Reference Logan1985; Meiran, Reference Meiran1996; Rogers & Mosell, Reference Rogers and Monsell1995). To measure the efficiency of executive control in task switching, we use a task-switching paradigm and evaluate performance for three different trial types. In single-task trials, individuals perform the same task A or B throughout the entire block. In mixed-task blocks, participants must switch between the two tasks every fourth trial, resulting in mixed-task switch trials (i.e., AB or BA) and task repeat trials (i.e., AAA or BBB). Task switching costs can then be decomposed into nonswitch costs, which reflect the dual nature of the task, and switch costs, which reflect set-shifting abilities. Nonswitch costs are defined as the difference in performance between single-task trials and task repeat trials in mixed-task blocks. Nonswitch costs are thought to measure the requirement of keeping two task sets active in working memory and selecting between them (Keele & Rafal, Reference Keele, Rafal, Monsell and Driver2000; Kray et al., Reference Kray, Li and Lindenberger2002, Reference Kray, Eber and Lindenberger2004). Switch costs are defined as the difference in performance between switch trials and task repeat trials within mixed-task blocks. Switch costs are thought to measure ability to reconfigure task settings at trial-to-trial transitions and can be attributed to the need to change tasks. Although the exact nature of the switch costs continues to be debated, most authors acknowledge a plurality of causes consisting primarily of active control processes (e.g., task set reconfiguration) in addition to passive processes (e.g., priming, response conflict resolution) (Allport et al., Reference Allport, Styles, Hsieh, Umilta and Moscovitch1994; Gopher et al., Reference Gopher, Armony and Greenshpan2000; Monsell et al. Reference Monsell, Sumner and Waters2003; Sohn & Anderson, 2001; Wylie & Allport, Reference Wylie and Allport2000).
Recent research addressing switch costs using task-switching paradigms has shown that both the magnitude and duration of switch costs can vary as a factor of several task variables (Gopher et al., Reference Gopher, Armony and Greenshpan2000). For example, switch costs are reduced when there is an external cue present to signal the switch (e.g., Baddeley et al., Reference Baddeley, Chincotta and Adlam2001; Koch, Reference Koch2003; Rubinstein et al., Reference Rubeinstein, Meyer and Evans2001; Saeki & Saito, Reference Saeki and Saito2004) when participants know they must change tasks every r trials (e.g., Goschke, Reference Goschke, Monsell and Driver2000; Meiran, Reference Meiran1996; Rogers & Monsell, Reference Rogers and Monsell1995; Sohn & Anderson, Reference Sohn and Anderson2001; van Asselen & Ridderinkhof, Reference van Asselen and Ridderinkhof2000), and when participants have sufficient time to prepare in advance for the new task (i.e., preparatory effect; Rogers & Monsell, Reference Rogers and Monsell1995; Schmitter-Edgecombe & Rueda, Reference Schmitter-Edgecombe and Rueda2008). In addition, switch costs are borne entirely by the switch (first) trial in situations where an external cue is present and participants switch predictably between tasks on every r trials (Keele & Rafal, Reference Keele, Rafal, Monsell and Driver2000; Rogers & Monsell, Reference Rogers and Monsell1995). For example, Milan et al. (Reference Milan, Sanabria, Tornay and Gonzalez2005) found that switch costs completely vanished after the first repetition of the new task in a predictable switch condition, whereas a more gradual approach to asymptotic performance was found when the switch was unpredictable (i.e., the task required on the next trial was unknown until signaled to the participant).
With regard to nonswitch costs, the aging literature suggests that the ability to maintain and coordinate two alternating task sets in working memory instead of one is more negatively affected by advancing age than the ability to execute the task shift itself (Kray, Reference Kray2006; Kray & Linderberger, Reference Kray and Lindenberger2000; Mayr, Reference Mayr2001; van Asselen & Ridderinkhof, Reference van Asselen and Ridderinkhof2000). For example, van Asselen and Ridderinkhof (Reference van Asselen and Ridderinkhof2000) found that in a predictable task switch situation, nonswitch costs but not switch costs were affected by age over and above the effects of general slowing. With the provision of external cues, however, the effects of age on nonswitch costs have been found to be significantly reduced (Kray et al., Reference Kray, Li and Lindenberger2002). Unlike younger adults who typically show negligible nonswitch costs, it has been hypothesized that in the context of ambiguity (e.g., no external cue; overlapping task-set representations), older adults tend to update currently relevant task sets not only on switch trials but also on nonswitch trials resulting in age differences primarily in nonswitch costs (Kray, Reference Kray2006; Kray et al., Reference Kray, Li and Lindenberger2002).
In the present study, we further address executive control processes involved in set-shifting in the MCI population. In mixed-task blocks, MCI and healthy older adult (OA) participants switched predictably between classifying whether a digit was odd/even or a letter was a consonant/vowel on every fourth trial. In single-task trials, participants completed only the digit task or letter task throughout the entire block. To maximize participants’ opportunity to prepare in advance for the task switch, the task switch was predictable (every fourth trial), an external cue was present, and an extended preparatory interval was used (1000 ms). Demands on working memory were also reduced by using univalent (nonoverlapping) stimuli (digit or a letter containing information relevant to current task dimension only). Based on recent findings of executive control difficulties in MCI populations (e.g., Baudic et al., Reference Baudic, Barba, Thibaudet, Smagghe, Remy and Traykov2006; Nordahl et al., Reference Nordahl, Ranganath, Yonelinas, DeCarli, Reed and Jagust2005; Royall et al., Reference Royall, Palmer, Chiodo and Polk2004), we hypothesized that the MCI participants would exhibit both greater nonswitch costs and greater switch costs when compared with healthy OAs. We were also interested in whether the cost of the task switch would be restricted to the switch trial (i.e., borne entirely by the first trial in the run) for the MCI group. In addition, we assessed for relationships between the computed laboratory measures of switch and nonswitch costs and neuropsychological measures assessing executive functioning.
METHOD
Participants
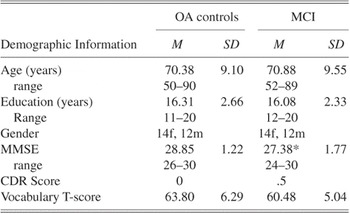
Participants were 26 individuals with MCI and 26 OAs, age 50 or older (see Table 1). Participants for both groups were recruited through advertisements, physician referrals, and referrals from local agencies working primarily with older adults. This study was conducted as part of a larger study that investigated memory and everyday abilities in older age (see Schmitter-Edgecombe et al., in press). Exclusionary criteria included a history of head trauma with permanent brain lesion, current or recent (past year) psychoactive substance abuse, history of cerebrovascular accidents, or known medical, neurological or psychiatric causes of cognitive dysfunction (e.g., epilepsy, schizophrenia). Initial screening of potential participants was conducted over the phone and included (a) a medical interview to rule out exclusionary criteria; (b) the Clinical Dementia Rating instrument (CDR) to assess dementia staging (Hughes et al., Reference Hughes, Berg, Danzinger, Coben and Martin1982; Morris, Reference Morris1993; Morris et al., Reference Morris, McKeel, Storandt, Rubin, Price, Grant, Ball and Berg1991); and (c) the Telephone Interview of Cognitive Status-modified (TICSm; Welsh et al., Reference Welsh, Breitner and Magruder-Habib1993) to briefly assess cognitive status.
Demographic data and mean summary data for the older adult controls and MCI group

Notes.
OA = Older Adult; MCI = Mild Cognitive Impairment; MMSE = Mini-Mental State Exam; CDR = Clinical Dementia Rating.
* p = .001.
Participants who met study screening criteria were then invited to the laboratory to complete a battery of experimental and standardized neuropsychological tests. The tests were administered across two days with testing sessions lasting between two to three hours. Collateral medical information, including the results of laboratory and brain imaging studies, were obtained and reviewed when available. Inclusion criteria for participants in the MCI group were consistent with criteria outlined by Petersen and colleagues (Petersen et al., Reference Petersen, Doody, Kurz, Mohs, Morris, Rabins, Ritchie, Rossor, Thal and Winblad2001) for amnestic MCI. We did not distinguish further between amnestic MCI single domain (N = 7) and multi-domain (N = 19). All participants reported memory impairment for at least 6 months which was corroborated by a knowledgeable informant. They also performed at least 1.5 SD below the mean of age and education matched peers on at least one of the following memory measures from the Rey Auditory Verbal Learning Test (RAVLT, Lezak, Reference Lezak1983) or the 7/24 Spatial Recall Task: 5 trial learning, immediate recall, or delayed recall. In addition, MCI participants (a) did not meet diagnostic criteria for probable or possible AD (McKhann et al., Reference McKhann, Drachman, Folstein, Katzman, Price and Stadlan1984); (b) showed preserved general cognitive functions as confirmed by a normal score on the MMSE (normality cutoff score: 24; Measso et al., Reference Measso, Cavarzeran, Zappalà and Lebowitz1993); (c) exhibited no significant difficulties with functional independence because of cognitive impairment, as confirmed by a total CDR score of 0.5 which is consistent with a minimal change in the participant’s habits; and (d) showed no signs of severe depression as confirmed by a score above 18 on the Geriatric Depression Scale (GDS; Yesavage et al., Reference Yesavage, Brink, Rose, Lum, Huang, Adey and Leirer1983).
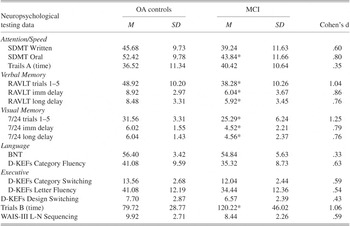
Each MCI participant was closely matched with a healthy OA control in terms of age (within 4 years), gender, and education (within 2 years). All of the healthy OAs met exclusion criteria, reported no history of cognitive changes, had a CDR score of 0, a GDS score above 18, and an MMSE score of at least 26 (see Table 1). As seen in Table 2, consistent with the criteria used to define MCI, the MCI group performed significantly more poorly (p < .01) than the healthy OAs on all measures of the verbal and visual memory tests. Significant group differences were also found on the oral subtest of the Symbol Digit Modalities Test (Smith, Reference Smith1991) and on Trails B (Reitan, Reference Reitan1958). All participants received a report documenting their performances. This protocol was approved by the Institutional Review Board at Washington State University.
Mean neuropsychological testing data for the older adult controls and MCI group

Notes.
Unless otherwise indicated, mean scores are raw scores. OA = Older Adult; MCI = mild cognitive impairment; SDMT = Symbol Digit Modalities Test; RAVLT = Rey Auditory Learning Test; imm = immediate; BNT = Boston Naming Test; D-KEFs = Delis-Kaplan Executive Functioning subtest; WAIS-III = Wechsler Adult Intelligence Scale 3rd Ed.; L-N = Letter-Number.
* p < .01.
Stimuli and Apparatus
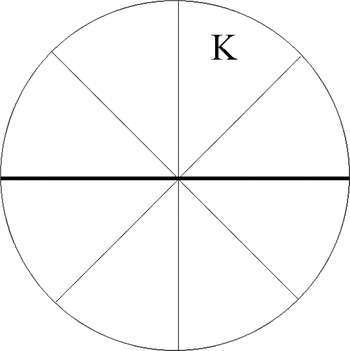
IBM compatible personal computers with active matrix screens were programmed with SuperLab Pro Beta Version Experimental Lab Software (1999) to present the background display and to collect responses. The background display consisted of a circle cut into eight equal segments and appeared as black on a white background (see Figure 1). A thickened black line also segregated the circle into two halves along the horizontal diameter. Participants sat at a viewing distance of approximately 45 cm. Each letter or number target was displayed in black, uppercase, 40-point font (Times New Roman), and appeared 6 cm from the center of the circle. The diameter of the circle was 16 cm. For the letter task, target consonants were chosen from the set G, K, M, and R and target vowels were from the set A, E, I, and U. For the digit task, even numbers included 2, 4, 6, and 8 and odd numbers included 1, 3, 5, and 9. All target characters were black against a white background. Responses were made by pressing the “1” and “2” keys on a peripheral numeric keypad.
Background display with example stimulus.

Procedure
There was a practice phase and a test phase. In the practice phase, participants were given the opportunity to learn the response-key mapping and familiarize themselves with the single-task and mixed-task trials. For single-task trials, participants were told that either numbers or letters would rotate clockwise in the circle on the computer screen. For the mixed-task trials, participants were told that numbers would appear in a specified half of the circle (i.e., either above or beneath the thickened black line) while letters would appear in the other half. For both single-task and mixed-task trials, participants pressed the “1” key on a keypad when the number was odd or the letter was a consonant, and the “2” key when the number was even or the letter was a vowel. Responses were made with the index and middle fingers of the individual’s dominant hand. Throughout testing, a reminder of all response assignments was presented on a card above the response keys. Sequences of stimuli were constructed so that the same response (consonant, vowel, odd, or even) could not appear on more than three successive trials. The target (a number or letter) appeared in successive segments in a clockwise sequence and the task either repeated (i.e., AAAAAAAA or BBBBBBBB for single-task blocks) or changed predictably on every fourth trial (i.e., AAAABBBB or BBBBAAAA for mixed-task blocks). The background display (i.e., circle cut into eight segments) provided a reliable external cue to position in task cycle. Each target stayed on the screen until the participant responded. Error trials were followed by the word “error”. The response-stimulus interval was 1000 ms.
During the practice phase, participants completed 36 single-task digit trials, 36 single-task letter trials and 72 mixed-task trials. If participants demonstrated difficulty with a task, the practice trials were re-administered. The mixed-task practice trials were always administered last. The experimental phase consisted of 2 blocks of 36 single-task digit trials, 2 blocks of 36 single-task letter trials, and 4 blocks of 36 mixed-task trials. Each block was preceded by 8 warm-up trials and appropriate instructions. Order of task administration was counterbalanced for the experimental phase. More specifically, half of the participants in each group began with single-task trials while the other half began with mixed-task trials. For single-task trials, half the participants completed the digit task first and half completed the letter task first. To avoid the possible influence of location on switching performance, the letters always appeared above the thickened black line in the mixed-task trials for participants who received the letter task single blocks first. Conversely, if participants received the number task single blocks first, the numbers appeared above the thickened black line in the mixed-task trials.
To minimize fatigue and eyestrain, participant-paced rest breaks were given between blocks. Participants were told to maintain an accuracy rate between 93% and 97% correct. Participants with accuracy rates above 97% or below 93% at the end of a block were encouraged to respond more quickly or more accurately, respectively, on the next trial block.
RESULTS
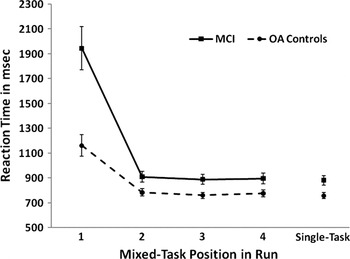
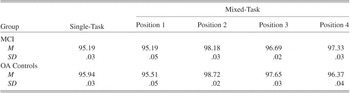
The dependent variables were accuracy and RT. Mean accuracy rates are presented in Table 3, and mean RTs are presented in Figure 2. The data from the single-task digit trials (odd/even) and single-task letter trials (consonant/vowel) were combined for all analyses as overall RTs and accuracy rates were highly comparable between the two single-task types and did not interact with group. For each participant, response times larger or smaller than 2.5 standard deviations from the mean RT in each treatment condition were removed. This resulted in removal of less than 2% of the data.
Mean RTs for the older adult (OA) controls and MCI groups plotted as a function of task (simple and mixed) and position in run, with the first position in the run representing the task switch.

Mean accuracy rates and standard deviations as a function of Group, Task, and Position in Run

Note.
OA = Older Adult; MCI = mild cognitive impairment;
Accuracy Rate
As seen in Table 3, both the MCI and OA control groups were able to successfully maintain accuracy rates between 93% and 97% correct. A group (MCI, healthy OAs) by task type (single-task, mixed-task) analysis of variance (ANOVA) on overall accuracy rate revealed higher accuracy in the mixed-task condition (M = 97.0%) compared with the single-task condition (M = 95.6%); F(1,50) = 15.93; MSE = .001; η2 = .24; p < .005. Importantly, however, there was no difference in overall accuracy rate between the MCI (M = 96.0%) and healthy OA (M = 96.5%) groups, F = .69, and the group by task interaction was not significant, F = .59.
A 2 (group) by 4 (position in a run) ANOVA on the mixed-task accuracy data revealed a significant main effect of position in run, F(3,150) = 8.14; MSE = .001; η2 = .14; p < .001, with the poorest accuracy rate for the switch trial (i.e., Position 1 representing the AB and BA transition). Breakdown of this main effect revealed that accuracy rates for Position 1 (M = 95.4%), Position 3 (M = 97.2%), and Position 4 (M = 96.8%) were poorer than the accuracy rate for Position 2 (M = 98.5%), F’s(1,50) > 7.20; p’s < .01. The accuracy rate for Position 1 (the switch trial), was also poorer than that of Position 3, F(1,50) = 5.58; p = .02, and there was a trend for Position 1 accuracy to be poorer than Position 4, F(1,50) = 3.59; p = .06. Again, there was no significant accuracy rate difference between the MCI and healthy OA groups, F = .12, and no significant interaction involving group, F = .86. Collectively, these findings indicate that the MCI and healthy OA groups exhibited a similar pattern in accuracy rates across task conditions and position in run. Therefore, any group differences found in the RT data cannot be attributed to group differences in speed/accuracy trade-off functions (Strayer & Kramer, Reference Strayer and Kramer1994).
RT Data
Switch costs
The mean RT data for the mixed-task trials was first analyzed by a 2 (group) by 4 (position in a run) mixed model ANOVA. As expected, the analysis revealed that the overall response rate of the MCI participants (M = 1159 ms) was slower than that of the healthy OAs (M = 869 ms), F(1,50) = 13.59; MSE = 80402.65; η2 = .21; p = .001. There was also a significant main effect of position in run, F(3,150) = 74.60; MSE = 89734.70; η2 = .60; p < .001. Breakdown of this main effect revealed that set shifting produced a significant switch cost; the mean RT for the switch trial [i.e., Position 1 (M = 1552 ms)], was significantly greater than that of the task repeat trials [i.e., Positions 2 (M = 846 ms), 3 (M = 823 ms), and 4 (M = 835 ms)], F’s(1,50) > 75.65; p’s < .001. No differences in response rate were found between the task repeat trials (Positions 2, 3, and 4), F’s < 2.47, indicating that performance recovered rapidly following the switch. As clearly seen in Figure 2, this immediate recovery from the switch cost occurred for both the MCI and OA control participants.
The ANOVA analysis also revealed a significant group by position in run interaction, F(3,150) = 15.73; MSE = 89734.70; η2 = .24; p < .002. Breakdown of this interaction revealed that switch costs, computed as the average of Positions 2, 3, and 4 (task repeat trials) subtracted from Position 1 (switch trial), were greater for individuals with MCI (M = 1046 ms) than for OA controls (M = 388 ms), t(50) = 4.04; p < .001. Computation of proportional difference scores (switch costs/average of Positions 2, 3, and 4) showed that the task switch translated into a 110% slowing for the MCI group but only a 48% slowing for the healthy OAs. To further establish that this group difference in switch costs exceeded general slowing, the same analyses were performed on log-transformed RTs. An advantage of LogRTs is that differences between logarithms represent proportion, thus controlling for general slowing (Kray & Lindenberger, Reference Kray and Lindenberger2000; van Asselen & Ridderinkhof, Reference van Asselen and Ridderinkhof2000). When RTs were log-transformed, the group by position in run interaction remained strong, F(1,50) = 13.22; MSE = .005; η2 = .21; p < .001. These findings indicate that switch costs were greater for participants with MCI than for healthy OAs and that general slowing in speeded processing cannot account for this result.
Nonswitch costs
Group differences in nonswitch costs were evaluated by comparing overall RT for single-task trials with the mixed-task repeat trials (i.e., mean of Positions 2, 3, and 4). As expected, this 2 by 2 ANOVA revealed that individuals with MCI (M = 881 ms) responded significantly more slowly than healthy OAs (M = 757 ms); F(1,50) = 7.86; MSE = 51508.42; η2 = .14; p = .007. Nonswitch costs (mixed-task repeat trials – single-task trials) averaged 32 ms, F(1,50) = 4.98; MSE = 5360.24; η2 = .09; p = .03, replicating the typical finding with OAs that responses are slowed when the task is embedded in a context that contains other tasks as well (dual-task situation). Unlike for the switch costs, however, there was no significant interaction involving group, F = .004; revealing that nonswitch costs for the MCI group (M = 31 ms) were comparable to those of the healthy OA group (M = 32 ms). Computation of proportional difference scores (nonswitch costs/single-task trials) showed that the addition of keeping two task sets in mind resulted in a 2.87% slowing for the MCI group and a 3.64% slowing for the healthy OAs. This finding indicates that, compared with OA controls, the MCI group was not disproportionately affected by the need to maintain and coordinate two alternating task sets in working memory.
Correlational Analyses
To further examine those factors that might contribute to the MCI groups’ greater set-shifting costs, we conducted correlational analyses. For each group, we examined the relationship between the proportion of switch costs (switch costs/average of Positions 2, 3, and 4) and nonswitch costs (nonswitch costs/single-task trials), demographic variables and the neuropsychological measures of intellectual performance, attention/speed, memory, language and executive functioning shown in Tables 2. Due to the large number of correlations, we used a more conservative alpha level of p < .01. For the MCI group, significant correlations were found between switch costs and scores on the MMSE (r = −.55; p = .003), SDMT Written (r = −.49; p = .01), Trails B (r = .60; p = .002) and WAIS-III L-N Sequencing (r = −.62; p = .001). It is also noteworthy that correlations between switch costs and two additional measures of executive functioning (i.e., D-KEFs Category Switching: r = −.44; p = .03; D-KEFs Design Switching: r = −.44; p = .03) met the less stringent criteria of p < .05. For all measures, larger switching costs were associated with poorer performances on the neuropsychological measure. For the OA control group, a significant relationship was found between switch costs and performance on Trails A (r = .58; p = .002). With regard to nonswitch costs, no significant relationships emerged between the demographic and neuropsychological measures and the proportion of nonswitch costs for either the MCI group, r’s < .41 or for the OA controls, r’s < .33.
DISCUSSION
We used a task-switching paradigm to evaluate executive control processes involved in set-shifting. This paradigm allowed us to separate the executive control processes involved in keeping two task sets active in working memory (nonswitch costs) from those required to reconfigure task settings at trial-to-trial transitions (switch costs). With regard to nonswitch costs, the data revealed that the MCI participants were as efficient as the OA controls in their ability to maintain and coordinate two task sets. In contrast, the MCI group exhibited significantly larger switch costs (1046 ms; 110% slowing) than the OA controls (388 ms; 48% slowing). Furthermore, the greater switch costs of the MCI participants could not be explained by the overall slower response speed of the MCI group.
While switch costs have been hypothesized to reflect several different underlying processes (Allport et al., Reference Allport, Styles, Hsieh, Umilta and Moscovitch1994; Goschke, Reference Goschke, Monsell and Driver2000; Meiran, Reference Meiran1996; Meiran et al., Reference Meiran, Chorev and Sapir2000; Rogers & Monsell, Reference Rogers and Monsell1995; Wylie & Allport, Reference Wylie and Allport2000), the distinction between an active preparation component and a residual component is widely accepted. The preparation component refers to the part of the switch costs that is reduced when participants are given enough time to prepare for the new task (Meiran, Reference Meiran1996; Meiran et al., Reference Meiran, Chorev and Sapir2000, Reference Meiran, Gotler and Perlman2001; Rogers & Monsell, Reference Rogers and Monsell1995). In the current study, it was expected that the predictable trial order and the long response-stimulus interval (1000 ms) would allow participants the opportunity to voluntarily prepare for the task in advance of the target stimulus (Kray, Reference Kray2006; Rogers & Monsell, Reference Rogers and Monsell1995; Swainson et al., Reference Swainson, Cunnington, Jackson, Rorden, Peters, Morris and Jackson2003). The residual component refers to the aspects of the switch costs that remain even after long preparatory intervals (e.g., 1000 ms; Sohn et al., Reference Sohn, Ursu, Anderson, Stenger and Carter2000). According to several authors (Meiran, Reference Meiran1996; Rogers & Monsell, Reference Rogers and Monsell1995; Rubinstein et al., Reference Rubeinstein, Meyer and Evans2001), the residual component of task set reconfiguration cannot be executed in advance of the stimulus, but instead is triggered only by the appearance of a stimulus associated with the task to be performed. Although we suspect that the greater difficulties in switch costs for individuals with MCI lay mainly in the residual component (see next paragraph), the MCI participants may have also experienced some difficulty voluntarily preparing in advance for the target stimulus.
The data also showed that, for both the MCI and the OA control groups, switch costs were limited to the switch trial and did not dissipate gradually over a run of trials (Milan et al., Reference Milan, Sanabria, Tornay and Gonzalez2005; Rogers & Monsell, Reference Rogers and Monsell1995). That is, is this predictable, externally cued task switch situation the executive control processes necessary for response and task set inhibition and preparation to perform the new task were completed before the first trial of the run ended (Rogers & Monsell, Reference Rogers and Monsell1995; Rubenstein et al., Reference Rubeinstein, Meyer and Evans2001). In unpredictable switch situations, a more gradual approach to asymptotic performance has been documented (Milan et al., Reference Milan, Sanabria, Tornay and Gonzalez2005; Monsell et al., Reference Monsell, Sumner and Waters2003). This led Monsell et al. (Reference Monsell, Sumner and Waters2003) to propose that, in contrast to unpredictable switch situations, in predictable switch situations there may be a higher commitment to the new task set after the first trial of a run because the participant knows that the next trial will not require reinstatement of the task set just abandoned. If this is an accurate interpretation, then our data indicate that, similar to OA controls, the participants with MCI were prepared and highly committed to the new task after the first trial in the run. These results also indicate that the dissipating activation of the prior task set did not persist past the first trial for the participants with MCI.
In this experiment, despite the fact that we used task parameters that have been found to facilitate task switching performance in studies with neurologically normal participants, we found significant switch costs for the MCI group. Because the magnitude and duration of switch costs can vary as a factor of several task variables (Gopher et al., Reference Gopher, Armony and Greenshpan2000), future research will be needed to investigate the boundaries of the current findings. More specifically, what conditions exaggerate as oppose to reduce or eliminate the magnitude of nonswitch and switch costs differences between MCI and control groups? For example, will individuals with MCI exhibit significant nonswitch costs in conditions where there is no external cue and preparation must be internally triggered (e.g., by knowing that the task will change every four trials)? Because reliance on an internal cue can increase memory load, MCI participants may have more difficulty than controls with the nonswitch (dual task nature) component of such a switching task. In the present study, task switching was also predictable, with a task switch occurring on every fourth trial. In many real-world situations, a task switch may occur rapidly and be unpredictable (e.g., having to swerve the car rapidly to avoid a pedestrian). Because the task set reconfiguration process is likely to be more difficult in situations when task switches occur unpredictably and infrequently, an even larger switch cost might be seen in the MCI population in unpredictable task-switch situations. Furthermore, in the present study, the non-overlapping target stimulus on each trial was relevant to only one task. It is possible that individuals with MCI would exhibit both greater nonswitch and switch costs in the presence of a stimulus that also activates the currently inappropriate task (e.g., both tasks involve number stimuli).
Correlational analyses revealed no significant relationships between the neuropsychological measures and nonswitch costs. In contrast, for individuals with MCI, switch costs were found to be associated with scores on the MMSE and the written subtest of the SDMT. The finding that greater switch costs were associated with poorer MMSE scores is consistent with work which has found neuropsychological measures requiring set-shifting abilities to be predictive of AD onset (Albert et al., Reference Albert, Moss, Tanzi and Jones2001; Artero et al., Reference Artero, Tierney, Touchab and Ritchie2003). A significant relationship was also found between switch costs and four of the five executive functioning measures, including all three measures that involved a set-shifting component (i.e., Trials B; D-KEFs Category Switching and Design Switching). While this study found a relationship between neuropsychological measures that involve a set-shifting component and a laboratory measure of task switching, future studies are needed to establish relationships with everyday functional abilities that involve task switching (e.g., cooking proficiency, ability to follow a new recipe, driving).
This study has several specific limitations that may limit the generalizability and reproducibility of the results. These limitations include the small sample size, the parameters of the task-switching paradigm used and the generally high level of education of the healthy OA and MCI participants. The small sample size may have also limited our ability to identify additional meaningful relationships between nonswitch and switch costs and the neuropsychological measures.
In summary, using a predictable, externally cued task-switching paradigm, we found that the MCI participants were as effective as healthy OAs in ability to maintain and coordinate two task sets (nonswitch costs), but exhibited significantly greater switch costs. Because the ability to switch rapidly and fluidly between tasks is an important component of many everyday activities, future research is needed to better understand the nature and implications for daily living of the greater switch costs found for individuals with MCI.
ACKNOWLEDGMENTS
Maureen Schmitter-Edgecombe, Ph.D., and Chad Sanders, B.S., Department of Psychology, Washington State University. We thank Ellen Woo, Michelle Langill, Alicia Rueda, and Scott Creamer for their support in coordinating data collection. We also thank the members of the Aging and Dementia Research Team for their help in collecting and scoring the data. Portions of this research were presented at the Thirty-fifth annual meeting of the International Neuropsychological Society, Portland, Oregon. This research was funded in part by an Edward R. Meyer Project Award. No financial or other relationships exist that could be interpreted as a conflict of interest pertaining to this manuscript.