Introduction
Phenol, also known as carbolic acid, is an aromatic organic compound that consists of a benzene ring bonded to a hydroxyl group. Phenol is a key precursor to many materials and useful compounds, such as dyes, polymers, drugs, pesticides and plastics (Weber et al., Reference Weber, Weber and Kleine-Boymann2004). However, it causes toxic effects, including dermatitis, liver and kidney damage, lung edema and coma (Warner & Harper, Reference Warner and Harper1985; Budavari, Reference Budavari1996; Lin et al., Reference Lin, Lee, Lai and Lin2006). Therefore, critical affect concentrations of phenol have been defined in the water quality criteria of several countries, such as 105.24 µM in Malaysia (DOE-MU, Reference Goh, Yap and Lim1986), 10.63 µM in the USA (USEPA, 2009) and 1.06 µM in Australia (AWRC, 1984).
Cytochromes P450 (CYPs) are multicomponent electron transfer enzyme complexes that work with redox partner proteins. Generally in these systems, CYP acts as the terminal oxidase enzyme in enzymatic reactions which use a variety of small and large molecules as substrates (Rewitz et al., Reference Rewitz, Styrishave, Løbner-Olesen and Andersen2006). Reactions carried out by the CYP systems include the biotransformation of drugs, the bioconversion of xenobiotics and the bioactivation of chemical carcinogens (Hannemann et al., Reference Hannemann, Bichet, Ewen and Bernhardt2006; Omura, Reference Omura2010).
CYPs and their associated activities have been demonstrated in numerous marine invertebrates belonging to the phyla Annelida, Mollusca, Arthropoda and Echinodermata (Rewitz et al., Reference Rewitz, Styrishave, Løbner-Olesen and Andersen2006). Many CYP subfamily members, including CYP1, CYP2, CYP3, CYP4, CYP6, CYP9, CYP10, CYP18, CYP28, CYP30, CYP45, play a key role in bioactivation or metabolization (Snyder, Reference Snyder2000; Ma et al., Reference Ma, Liu, Niu and Li2015 Gopalakrishnan et al., Reference Gopalakrishnan Nair, Park and Choi2013). For example, CYP1A is one of the CYPs involved in aryl hydrocarbon receptor-mediated oxidation of xenobiotics, such as benzo(a)pyrene (BaP) (Nakata et al., Reference Nakata, Tanaka, Nakano and Adachi2006); the expression of CYP1A mRNA, and the protein, has been used as a sensitive biomarker for BaP (Van der Oost et al., Reference Van der Oost, Beyer and Vermeulen2003). The CYP6 families in terrestrial invertebrates have frequently been shown to play a role in the detoxification of xenobiotics and metabolic resistance to insecticides (Liu et al., Reference Liu, Chen and Yang2010; Poupardin et al., Reference Poupardin, Riaz, Vontas, David and Reynaud2010; Cifuentes et al., Reference Cifuentes, Chynoweth, Guillén, De la Rúa and Bielza2012; Musasia et al., Reference Musasia, Isaac, Masiga, Omedo, Mwakubambanya, Ochieng and Mireji2013; Edi et al., Reference Edi, Djogbénou, Jenkins, Regna, Muskavitch, Poupardin, Jones, Essandoh, Kétoh, Paine, Koudou, Donnelly, Ranson and Weetman2014; Sun et al., Reference Sun, Wang, Zou and Cao2014). However, the response of CYP6 in aquatic invertebrates to environmental pollutants has rarely been studied.
The aquatic midge, Chironomus kiinensis, is broadly distributed in Malaysia, Japan and South China (Cao et al., Reference Cao, Sun, Wen, Li, Wu and Wang2012). C. kiinensis could be used as a bioindicator in freshwater ecosystems, due to its relatively short life cycle, ease of maintenance of laboratory cultures and relative sensitivity to aquatic contaminants. Recently, we reported transcriptome profiling of C. kiinensis under phenol stress and identified differentially expressed genes using Solexa sequencing technology (Cao et al., Reference Cao, Wang, Niu, Desneux and Gao2013). In this study, we have identified and cloned the ten C. kiinensis CYP6 subfamily genes, based on the transcriptome library, and investigated the transcriptional expression of the P450 s in response to phenol exposure. The results demonstrate the potential of using CYP enzyme activity, and the expression of CYP6 genes, as a risk assessment tool.
Materials and Methods
Midge rearing and stress treatment
Specimens of C. kiinensis were obtained from the Shenzhen Municipal Water Affairs Bureau and were cultured according to the methods of Cao et al. (Reference Cao, Wang, Niu, Desneux and Gao2013). Briefly, the midges were reared in mixed-age cultures, fed with goldfish granules (Beijing SanYou Beautification Free TECH. CO., LTD, China) and housed in a glass tank (50 × 20 × 30 cm3) that was covered with a nylon net and maintained at 20 ± 2°C, with a light : dark cycle of 16:8 h.
Thirty 4th instar larvae of similar size and body color were randomly assigned to transparent 200 ml plastic cups. Four different treatments were applied (0 μM (control), 1, 10 and 100 μM), with 15 replicates of each treatment. Each plastic cup contained 50 ml of the respective treatment solution, prepared according to US Environmental Protection Agency (EPA) standards (USEPA, 2000). The plastic cups were not aerated and the test solutions were renewed after 24 and 72 h. Four living larvae were randomly selected from each replicate (30 individuals per replicate) at 6, 12, 24, 48, 72 and 96 h, and stored at −80°C after being rapidly frozen in liquid nitrogen. Fifty frozen midges were randomly selected from each treatment at each time interval for RNA preparations or the CYP activity assay.
CYP activity assay
The CYP activity assay was conducted according to the method of Bautista et al. (Reference Bautista, Miyata, Miura and Tanaka2009), with minor modifications. Briefly, 40 frozen 4th instar C. kiinensis larvae were homogenized in 4 ml of ice-cold phosphate buffer (0.1 M, pH 7.5), containing 0.1 µM dithiothreitol, 1 μM ethylene diamine tetraacetic acid, 1 µM 1-phenyl-2-thiourea and 1 µM phenylmethanesulfonyl fluoride. The homogenate was centrifuged at 12,000 × g for 15 min at 4°C. The supernatant was used to determine the presence of CYP enzymes. Phosphate buffer (800 μl; 0.1 M, pH 7.5), including 0.48 μM NADPH and 2 μM p-nitroanisole, was added to aliquots (1 ml) of the supernatant and mixed for 30 min in a thermostatic water bath. Hydrochloric acid (40 μl) was used to terminate the enzyme catalyzed reaction. Then, 5 ml of chloroform was mixed in and the solution was fully shaken for 15 min, before being centrifuged at 4200 × g for 15 min. To extract the p-nitrophenol from the pellet, the supernatant was removed and 3 ml of NaOH (0.5 M) was added to the pellet. The mixture was vortexed for 20 min, after which point the fluid was allowed to settle for 30 min; 2.7 ml of the NaOH supernatant was then removed, which included the p-nitrophenol. The optical density of the supernatant was measured at 412 nm to analyze p-nitrophenol. The protein concentration was estimated according to the method of Bradford, using bovine serum albumin as the standard protein (Bradford, Reference Bradford1976). Mean levels of the CYP activities were derived from the BSA and p-nitrophenol standard curves and expressed as μmol substrate per min per mg protein (μmol min−1 mg−1 protein).
Identification and characteristics analysis of CYP6 genes
Total RNA was isolated using an RNeasy mini kit (Qiagen, Valencia, CA, USA) following the manufacturer's guidelines, and then treated with RNase free DNase I (Qiagen). The C. kiinensis transcriptome was profiled by conducting Solexa sequencing at the Beijing Genomics Institute (BGI) (Shenzhen, China) (Cao et al., Reference Cao, Wang, Niu, Desneux and Gao2013). The CYP6 subfamily genes were identified according to their functional annotation and were further confirmed using reverse transcription PCR (RT–PCR) and sequencing. The molecular weights and theoretical isoelectric points (PI) of the CYP6 were predicted with ProtParam software (http://au.expasy.org/tools/protparam.html).
Multiple sequence alignment and polygenetic analysis
The genes and amino acid sequences corresponding to the CYP6 were retrieved from a transcriptome database and the NCBI database (http://www.ncbi.nlm.nih.gov/BLAST), respectively. The C. kiinensis CYP6 was aligned to other Dipteran protein sequences using the CLUSTALX 1.83 software package (Thompson et al., Reference Thompson, Gibson, Plewniak, Jeanmougin and Higgins1997). The phylogenetic tree was constructed using the neighbor-joining method and boot-strapped with 1000 replicates. Branch strength was evaluated using the MEGA 5.1 software package (Tamura et al., Reference Tamura, Dudley, Nei and Kumar2007).
Real-time RT–PCR analysis
The expression levels of ten C. kiinensis genes were quantified using real-time RT–PCR, using the MJ OpticonTM2 machine (Bio-Rad, Hercules, CA, USA). Approximately 0.5 µg of the total DNase I-treated RNA, isolated from the 4th instar C. kiinensis larvae, was reverse transcribed to cDNA using 1 µM of oligodeoxythymidine primer in a 10 µl reaction. The synthesized cDNA were diluted in sterile water up to 100 times to create a template for real-time RT–PCR. Ten primer sequences of CYP6 genes and the actin gene were analyzed (Supplementary Table S1); the actin gene was chosen as internal standard to normalize the target gene expression level in each reaction. The real-time RT–PCR was run in a 20 µl reaction volume, including 20 µl of SYBR Green PCR Master Mix (Toyobo), 1 µM each of the forward and reverse primers and 2 µl of cDNA template. The amplifications were conducted with the following cycling: one cycle of 94°C for 30 s, followed by 45 cycles of 94°C for 12 s, 60°C for 30 s, 72°C for 40 s and 82°C for 1 s, for plate reading. The specificity of each of the qRT–PCR amplifications was checked with a melting point curve, which was obtained for each sample at the end of each run. To guarantee better reproducibility of the results, three technical repeats of each sample qRT–PCR were performed. The expression levels of the clones were calculated from the threshold cycle, according to the delta-delta CT method (Pfaffl et al., Reference Pfaffl, Horgan and Dempfle2002). The relative expression level was calculated by dividing the transcription level under the phenol stress conditions by the transcription level under the control conditions (Cao et al., Reference Cao, Wang, Niu, Desneux and Gao2013).
Results
CYP activity in response to phenol
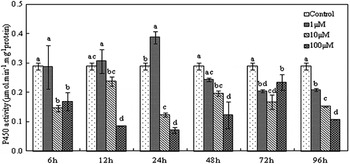
In general, under the three sublethal doses of phenol, the CYP activities in the 4th instar larvae of C. kiinensis were preferentially downregulated during the 96 h exposure period, in comparison with the control (fig. 1). However, when exposed to 1 µM of phenol, the CYP activities were initially induced, reaching a peak of 0.388 µmol min−1 mg−1 protein at 24 h, before being inhibited, down to 0.204 µmol min−1 mg−1 protein at 72 h. The CYP activities of the larvae were always lower than those of the control when exposed to 10 and 100 µM phenol. In particular, the CYP activities in the larvae from the 10 and 100 µM phenol treatment were lowest at 24 h (at 0.43-fold and 0.25-fold lower than the control, respectively).
Effects of phenol on the specific P450 activity in 4th instar C. kiinensis larvae during the 96 h exposure period. Bars representing the same time point, but different phenol treatments that do not share a letter are significantly different (P < 0.05), according to the Tukey's multiple comparison test.

cDNA cloning and characterization of the CYP6 genes
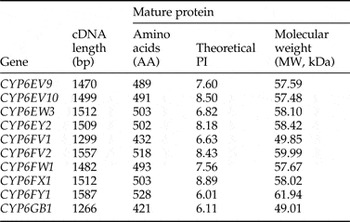
In the C. kiinensis transcriptome, ten CYP6 genes (CYP6EV9 [KF896072], CYP6EV10 [KF896073], CYP6EW3 [KF896074], CYP6EY2 [KF896075], CYP6FV2 [KF896076], CYP6FW1 [KF896077], CYP6FX1 [KF896078], CYP6FY1 [KF896079], CYP6GB1 [KF896080] and CYP6FV1 [KF896081]) were identified by BLASTX searches of the protein Nr and Swiss-Prot databases. The full-length cDNAs of the CYP6 genes with open reading frames (ORFs) ranged from 1266 to 1587 bp, encoding deduced polypeptides composed of between 421 and 528 amino acids, with predicted molecular masses from 49.01 to 61.94 kDa, and PI from 6.01 to 8.89 (table 1).
Characterization of CYP6 genes for which the full ORFs were identified.

Phylogenetic analysis
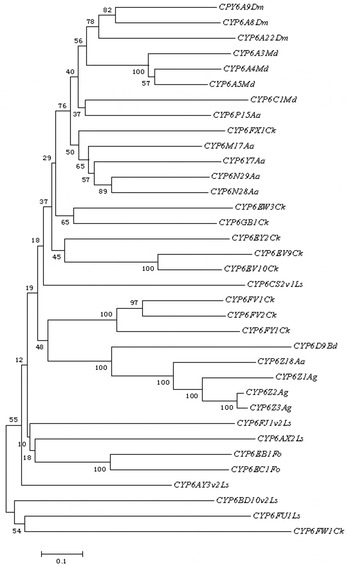
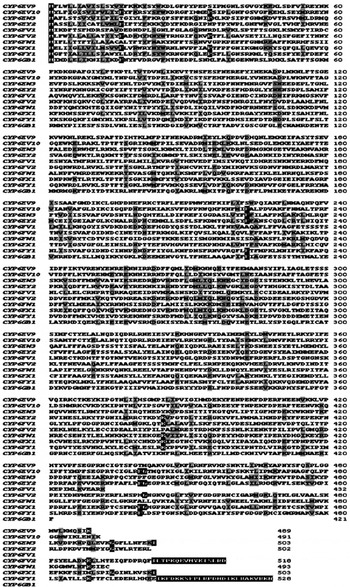
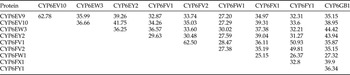
Phylogenetic trees of the ten CYP6 genes were constructed, based on the identities of various insect CYP6 genes (fig. 2). Among the 34 insect CYP6 genes, CYP6FX1 in C. kiinensis was clustered into a group with CYP6M17, CYP6Y7, CYP6N28 and CYP6N29 from Aedes albopictus. The CYP6FW1 in C. kiinensis was grouped with CYP6FU1 and CYP6BD10v2 from Laodelphax striatella. The CYP6EW3 and CYP6GB1 genes were clustered together with 44.42% sequence similarity. CYP6EY2, CYP6EV9 and CYP6EV10 were clustered into a group, while the CYP6FV1, CYP6FV2 and CYP6FY1 genes formed another separate group. CYP6EV9 and CYP6EV10 shared the highest sequence similarity (62.78%). The similarity of CYP6FY1 with CYP6FV1 and CYP6FV2 was 50.93 and 49.81%, respectively. The similarity of CYP6FV1 with CYP6FV2 was 62.50% (fig. 3 and table 2).
Phylogenetic tree of CYP6. The insect CYP6 genes were from: Bactrocera dorsalis (Bd, CYP6D9, ADO24531.2); Drosophila melanogaster (Dm, CPY6A9, Q27594.3); D. melanogaster (Dm, CYP6A22, Q9V769.1); D. melanogaster (Dm, CYP6A8, Q27593.2); Laodelphax striatella (Ls, CYP6FU1, AFU86479.2); L. striatella (Ls, CYP6AY3v2, AFU86482.1); L. striatella (Ls, CYP6AX2, AFU86463.1); L. striatella (Ls, CYP6BD10v2, AFU86445.1); L. striatella (Ls, CYP6FJ1v2, AFU86439.1); L. striatella (Ls, CYP6CS2v1, AFU86422.1); Musca domestica (Md, CYP6C1, AAA69818.1); Anopheles gambiae (Ag, CYP6Z2, ABV80276.1); A. gambiae (Ag, CYP6Z1, ABV80275.1); A. gambiae (Ag, CYP6Z3, AAO24698.1); M. domestica (Md, CYP6A4, AAA69817.1); M. domestica (Md, CYP6A5, AAA82161.1); M. domestica (Md, CYP6A3, AAA69816.1); Frankliniella occidentalis (Fo, CYP6EB1, AED99066.1); F. occidentalis (Fo, CYP6EC1, AED99065.1); Aedes albopictus (Aa, CYP6Y7, AEF79985.1); A. albopictus (Aa, CYP6P15, AEF79987.1); A. albopictus (Aa, CYP6N29, AEF79989.1); A. albopictus (Aa, CYP6M17, AEF79984.1); A. albopictus (Aa, CYP6Z18, AEF79986.1); and A. albopictus (Aa, CYP6N28, AEF79988.1). The amino acid sequences deduced from following sequences were used for analysis: Chironomus kiinensis (Ck, CYP6EV9); C. kiinensis (Ck, CYP6EV10); C. kiinensis (Ck, CYP6EW3); C. kiinensis (Ck, CYP6EY2); C. kiinensis (Ck, CYP6FV1); C. kiinensis (Ck, CYP6FV2); C. kiinensis (Ck, CYP6FW1); C. kiinensis (Ck, CYP6FX1); C. kiinensis (Ck, CYP6FY1); and C. kiinensis (Ck, CYP6GB1).

Alignment of the deduced amino acid sequences of the CYP6 protein. The identical and similar amino acid residues are indicated by black and gray boxes, respectively.

Sequence identities of the ten CYP6 proteins (%).

Transcriptional responses of CYP6 genes to phenol exposure
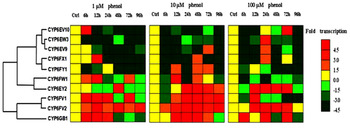
The mRNA expression levels of the ten CYP6 genes (CYP6EV10, CYP6EW3, CYP6EV9, CYP6FX1, CYP6FY1, CYP6FW1, CYP6EY2, CYP6FV1, CYP6FV2 and CYP6GB1) significantly changed in response to phenol during the 96 h exposure period (fig. 4 and Supplementary Table S2). Under 1 µM phenol exposure, the CYP6EV10, CYP6EW3, CYP6EV9, CYP6FX1, CYP6FY1 and CYPEY2 genes were preferentially downregulated, while the CYP6FV2 and CYP6FV1 genes were mainly upregulated during the 96 h phenol exposure (fig. 4 and Supplementary Table S2).
Transcription profiles of the CYP6 genes in 4th instar C. kiinensis larvae following exposure to different concentrations of phenol during a 96 h period. All of the relative expression levels were log2 transformed.

Under 10 µM phenol exposure, the CYP6EY2, CYP6FV1, CYP6FV2 and CYP6GB1 were upregulated, except for at one or two time points. However, the CYP6EV10, CYP6EW3, CYP6EV9 and CYP6FX1 were mostly inhibited by phenol during the 96 h period, while the CYP6FY1 and CYP6FW1 genes were only downregulated at the 6, 24 and 96 h time points (fig. 4 and Supplementary Table S2). When exposed to 100 µM phenol, the transcription levels of CYP6EV10, CYP6EW3, CYP6EV9, CYP6FX1, CYP6FY1 and CYP6FV1 were clearly downregulated, except for at one time point (12, 24 or 72 h), while CYP6FW1 was downregulated during the entire 96 h period. The CYP6EY2 gene was upregulated during the 96 h period, except for at 6 and 96 h. Interestingly, under 100 µM phenol stress, CYP6FV2 was significantly upregulated during the 96 h period, with a 137.47-fold peak in expression, compared with unexposed control larvae, at 48 h (fig. 4 and Supplementary Table S2).
Discussion
Organisms have a suite of antioxidant enzymes and detoxifying enzymes to help protect against the potential damage of environmental pollutants. The activity of these enzymes can be used to monitor toxicity; for instance, cholinesterase activity in the skin mucus of three fish (Cirrhinus mrigala, Labeo rohita and Catla catla) was identified as a potential biomarker of organophosphorus insecticide exposure, and proposed as a useful tool for monitoring environmental toxicity (Nigam et al., Reference Nigam, Srivastava, Rai, Kumari, Mittal and Mittal2014).
CYP enzymes are a super family of monooxygenases that are present in all living organisms, and are responsible for the oxidative metabolism of endogenous and exogenous substrates (Feyereisen, Reference Feyereisen, Gilbert, Iatrou and Gill2005). It has been reported that the metabolism of many exogenous compounds, including BaP, pyrene, ethoxyresorufin, ethoxycoumarin and aniline, is mediated by CYP enzymes in the tissues of marine invertebrates (Rewitz et al., Reference Rewitz, Styrishave, Løbner-Olesen and Andersen2006). The regulation of CYP enzyme activity may play a central role in the adaptation of aquatic and/or marine animals to environmental pollutants. In Zacco platypus, Lee et al. (Reference Lee, Kim, Yoon and Lee2014) reported significant inductions of CYP system mRNA and protein, as well as increases in the hepatosomatic index, which reached maximum levels at 2, 14 and 4 days, respectively, during a 14-day BaP exposure; they suggested that a combination of the CYP system mRNA and protein expression levels, and the hepatosomatic index, would provide a useful biomarker in risk assessments of waterborne BaP exposure.
In this study, we used C. kiinensis to investigate the effects of phenol on CYP activity and the transcription profile of CYP6 genes. The CYP activities in C. kiinensis were affected by phenol in a time- and dose-dependent manner. The total CYP activity significantly increased after exposure for 24 h to 1 µM of phenol, while it significantly decreased after exposure to higher phenol concentrations (10 and 100 µM) over the same time period. Thus, the P450 activity after a 24 h exposure to phenol could be used to identify the level (low or high) of phenol contamination in the environment. Christen et al. (Reference Christen, Oggier and Fent2009) have reported that alterations in CYP3A enzyme activity could provide a suitable biomarker for screening exposure to pharmaceuticals occurring in the environment, using a microtiter-plate-based assay.
The ten CYP6 genes found in C. kiinensis also showed different expression profiles in response to sublethal concentrations of phenol. Approximately 50% of the CYP6 genes were preferentially inhibited, while the others were obviously induced, in response to phenol exposure during the 96 h exposure. Importantly, one or multiple CYP6 genes, for which the mRNA expression levels significantly altered in response to phenol, have potential to serve as biomarkers. For instance, after 24h of exposure, CYP6EW3 and CYP6EV9 exhibit 0.000004- and 0.00002-fold expressions (compared with the control) when exposed to 1 µM of phenol, then 0.46- and 0.19-fold expressions under 10 µM of phenol, and 6.82- and 2.00-fold expressions when exposed to 100 µM, respectively; this demonstrates the increasing expression observed with an increase in the phenol dose. Moreover, CYP6FV1 and CYP6FV2 could be decent biomarkers for identifying low levels of phenol (<10 µM), because their mRNA expression even increased significantly after exposure to a very low dose of phenol.
Similar differential transcriptional expression levels, as a result of stress, have been reported elsewhere. In Caenorhabditis elegans exposed to cadmium, Roh et al. (Reference Roh, Lee and Choi2006) reported stress-related genes, including the CYP family protein 35A2 (cyp35a2), had considerable potential as sensitive biomarkers for the diagnosis of cadmium contamination. Exposure to chlorpyrifos at concentrations 1/10 and 1/3 of the 96 h LC50 led to the downregulation of CYP3A transcription in goldfish liver, suggesting that in goldfish, CYP3A may not be involved in chlorpyrifos bioactivation (Ma et al., Reference Ma, Liu, Niu and Li2015). Lammel et al. (Reference Lammel, Boisseaux and Navas2015) measured cyp1A mRNA expression levels and cyp1A-dependent ethoxyresorufin-O-deethylase activity in the topminnow (Poeciliopsis lucida) hepatoma cell line PLHC-1, to evaluate the potential hazards of graphene nanomaterials interacting with chemical pollutants.
This study is an initial report of CYP6 cDNA cloning and the expression profiles in C. kiinensis exposed to a typical aquatic environmental pollutant. The findings provide clues for further elucidating the functional and regulatory mechanisms of CYP6 genes in C. kiinensis that may assist the fight against environmental xenobiotics. Further emphasis should be put on the elucidation of the function and regulation of the ever-increasing number of known marine invertebrate CYPs to environmental pollutants.
Conclusion
We have characterized CYP6 genes in the aquatic chironomidae C. kiinensis, with emphasis on their novel isoforms. We have also examined the total P450 activity and mRNA expression of ten CYP6 genes in response to phenol stress. CYPs appear to be an appropriate biomarker for phenol toxicity; in most cases, significant variation in both CYP activity and mRNA expression upon phenol exposure was observed, in a time-dependent manner. This is the first time ten novel CYP6 isoforms in the chironomidae C. kiinensis have been studied. The CYP6 in C. kiinensis clearly play a role in the response to phenol exposure. Overall, six isoforms, CYP6EV10, CYP6EW3, CYP6EV9, CYP6FX1, CYPFY1 and CYP6FW1, are the most promising of the total CYP enzyme assemblage in C. kiinensis, in terms of the strong positive correlation observed between phenol exposure and total CYP enzyme activity. The CYP activity and transcriptional levels of CYP6EW3 and CYP6EV9 could be used as biomarkers for identifying phenol contamination in the environment. However, CYP6FV2 was significantly upregulated in most time points at all of the phenol doses tested (Fig. 4), suggesting that CYP6FV2 may play an important role in metabolizing phenol, and thus could be a decent biomarker. This hypothesis will be evaluated in our future studies. This study provides a better understanding of CYP6 genes as molecular biomarkers in this species. Future studies need to explore the regulation mechanisms of the CYP6 genes and other CYP family genes.
Supplementary Material
The supplementary material for this article can be found at http://dx.doi.org/ 10.1017/S0007485315000826.
Acknowledgements
This work was supported by grants from Fundamental Research Funds for the Central Universities (grant no. 2572014CA10) and the Program for Young Top-notch Talents of Northeast Forestry University (grant no. PYTT-1213-10). We thank Dr David R. Nelson (University of Tennessee, USA) for naming the P450 genes.