I. INTRODUCTION
Nanotwinned (nt) face-centered cubic (fcc) metals have gained intense interest recently due to their unique assortment of desirable properties, including low electrical resistivity, high strain rate sensitivity,Reference Lu, Shen, Dao and Suresh1–Reference Suresh, Lu, Schwaiger, Shan, Dao and Lu3 improved mechanical stability under cyclic loading,Reference Weertman, Shute, Myers, Xie, Barbee and Hodge4,Reference Weertman, Shute, Myers, Xie, Li, Barbee and Hodge5 and increased mechanical strength.Reference Suresh, Lu, Schwaiger, Shan, Dao and Lu3,Reference Anderoglu, Misra, Wang, Ronning, Hundley and Zhang6–Reference Lu, Shen, Chen, Qian and Lu11 Different nt materials fabricated by pulsed electrodepositionReference Lu, Chen, Huang and Lu7 and magnetron sputteringReference Bufford, Zhang and Wang12,Reference Zhang, Misra, Wang, Nastasi, Embury, Mitchell, Hoagland and Hirth13 have various twinned microstructures, including randomly oriented polycrystalline grains filled with dense twin boundaries and, in certain cases, single crystal-like epitaxial structures (in sputtered Cu and Ag) with extremely high densities of twin boundaries exclusively oriented normal to the growth direction.Reference Anderoglu, Misra, Wang, Ronning, Hundley and Zhang6,Reference Zhang, Misra, Wang, Nastasi, Embury, Mitchell, Hoagland and Hirth13,Reference Zhang, Misra, Wang, Shen, Nastasi, Mitchell, Hirth, Hoagland and Embury14 The contributions of nanotwins to high mechanical strength have garnered special attention.Reference Lu, Chen, Huang and Lu7 Numerous studies demonstrated that twin boundaries act similarly to grain boundaries when blocking transmission of dislocations, and nt metals exhibit strength similar to their nanocrystalline (nc) counterparts.Reference Suresh, Dao, Lu and Shen2,Reference Suresh, Lu, Schwaiger, Shan, Dao and Lu3 However, given that twin and grain boundaries in most cases are significantly different in length scale, various microstructures must be carefully incorporated into strengthening models. Gu et al.Reference Gu, Dao, Asaro and Suresh15 proposed a strengthening model that considered simultaneously the influence of twin and grain boundaries. Meanwhile, twin boundaries also contribute to enhanced ductility and work hardening, properties usually lacking in nc metals.Reference Koch, Morris, Lu and Inoue16 Twin boundaries store dislocations during rollingReference Anderoglu, Misra, Wang, Hoagland, Hirth and Zhang17 and tensile tests,Reference Lu, Shen, Dao and Suresh1 and twin boundary/dislocation interactions produce sessile dislocations that may lead to enhanced work hardening.Reference Li, Wang, Huang, Misra and Zhang18,Reference Li, Wang, Misra, Zhang, Huang and Hirth19
Metals with nc microstructures store large amounts of energy within abundant grain boundaries, such that nc microstructures are often not at thermodynamic equilibrium.Reference Chookajorn, Murdoch and Schuh20 Grain coarsening provides a pathway to reduce this energy, so nc metals typically show poor thermal stability, and the resulting grain growth quickly leads to significant softening. However, the ∑3 <111> coherent twin boundaries (CTBs) typically have an order of magnitude lower energy than high-angle grain boundaries, making CTBs inherently more stable. For instance, in Cu, CTB energy and high-angle grain boundary energy are 24–39 and 625–710 mJ/m2, respectively.Reference Murr21,Reference Hirth and Lothe22 Hence, twin boundaries in sputtered polycrystalline nt Cu grow more slowly than grain boundaries, allowing the metal to retain dense twins (and thus significant strength) even after annealing to 80% of the melting temperature, T m.Reference Anderoglu, Misra, Wang and Zhang23,Reference Zhang and Misra24 The ∑3 <112> incoherent twin boundaries (ITBs) have been observed in nt Cu,Reference Anderoglu, Misra, Wang, Ronning, Hundley and Zhang6,Reference Wang, Anderoglu, Hirth, Misra and Zhang25,Reference Medlin, Campbell and Carter26 with calculated energies of 590–714 mJ/m2, Reference Wang, Anderoglu, Hirth, Misra and Zhang25 comparable with energies of low- and high-angle grain boundaries. Recent in situ studies and computational investigations of the nt material have revealed the importance of ITBs in mechanical deformation and twin boundary migration/detwinning under stress or heating.Reference Wang, Li, Anderoglu, Zhang, Misra, Huang and Hirth27–Reference Xu, Xu, Tu, Cai, Wang, Dixit, Pang and Miao30
Recently, we showed that epitaxial (111) Ag films have twin boundaries parallel to the film surface and average twin thickness, t twin, is ∼10 nm, whereas epitaxial (110) Ag films have inclined twins (at ∼30° to the film surface) with a t twin of ∼42 nm.Reference Bufford, Zhang and Wang12 Zhang and MisraReference Zhang and Misra24 proposed that twin orientation may affect thermal stability. Thus, the two epitaxial nt Ag systems are ideal to validate the foregoing hypothesis. In this study, we show that twin orientation can indeed result in dramatically different thermal stability of twin boundaries. Furthermore, the influences of grain and twin boundaries on strengthening are discussed by introducing a new parameter, effective dimension, which reconciles the large discrepancy in size-dependent strengthening should grain size or twin spacing be used alone.
II. EXPERIMENTAL
Ag films, 2 μm in thickness, were deposited onto HF-etched single crystal silicon substrates with (111) and (110) orientation. Base pressure prior to deposition was ∼6 × 10⁻⁸ Torr, and argon pressure during sputtering was ∼2 × 10⁻³ Torr. X-ray diffraction (Bruker-AXS D8 Bragg-Brentano x-ray Diffractometer, Cu Kα radiation, Madison, WI) was used to check for epitaxial film quality. Prior to annealing, the tube furnace was evacuated and purged with ultra-high purity Ar gas (99.99 %) three times. The furnace reached 400 °C in approximately 10 min and 800 °C in 25 min. Isothermal annealing was performed for 1 h at 200–800 °C with constant Ar gas flow. Before being retracted, films were allowed to cool in the furnace to approximately 60 °C, a process that took up to ∼4 h from 800 °C. Film surfaces were shiny, free of discoloration, and showed no signs of delamination from the substrates after annealing. Cross-section transmission electron microscopy (XTEM) specimens were prepared via mechanical grinding and polishing, followed by low-angle ion milling, then examined along perpendicular zone axes using a JEOL 2010 microscope with the accelerating voltage of 200 kV. Hardness was measured via an instrumented nanoindentation method performed using a Fischerscope HM2000XYp micro-/nanoindenter with a Vickers indenter tip. Hardness versus depth analysis was performed to choose an appropriate depth to avoid problems associated with both small indentation size and substrate effects. A minimum of 9–12 good indentations were performed at each indentation depth.
III. RESULTS
A. Annealing effects on the microstructure of epitaxial (111) nt Ag films
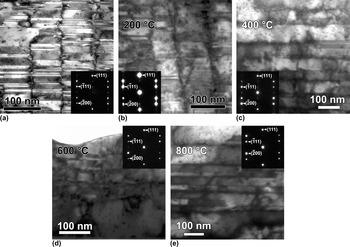
Microstructural evolution of (111) Ag films at various annealing temperatures is shown in XTEM micrographs in Fig. 1. Several characteristics are noteworthy. First, as-deposited films had twin boundaries essentially parallel to the substrate (or film surface), and the two variants (twin and matrix) had relatively low dislocation density. Second, the inset selected area diffraction (SAD) patterns show that all films remained epitaxial. ITBs have a unique repeating microstructure, that is, they consist of groups of three atomic layers with a Shockley partial dislocation on each consecutive (111) plane, and the summation of Burgers vectors within each triplet is zero.Reference Carter, Medlin, Angelo and Mills31 Hence, the prominent extra diffraction spots in as-deposited films arose from ITBs. However, ITB diffraction spots became faint by 400 °C and nearly disappeared at higher annealing temperatures. Third, columnar domain size and twin thickness both increased at higher annealing temperatures. Columnar domain size was initially 94 nm, and it increased to 134 nm at 200 °C, and to nearly 350 nm by 400 °C [Fig. 1(a)–1(c)]. At 600 °C and 800 °C, well-defined columnar domain boundaries were rarely seen; instead, each twin variant extended beyond hundreds of nanometers to microns parallel to the substrate [Figs. 1(d) and 1(e)].
Cross-section TEM (XTEM) micrographs (<011> zone axis) of (111) Ag films. Micrograph (a) corresponds to the as-deposited films, while (b)-(e) correspond to samples annealed at 200, 400, 600, and 800 °C. While only a small increase in columnar width appeared in (b), the width increased dramatically in (c). The corresponding inset SAD patterns provide evidence of epitaxial films with twins. Extra spots arose from ITBs in (a). In (d) and (e) columnar boundaries no longer appeared, and extra ITB spots were absent from the inset SAD patterns. Twin thickness gradually increased across the range of annealing temperatures.

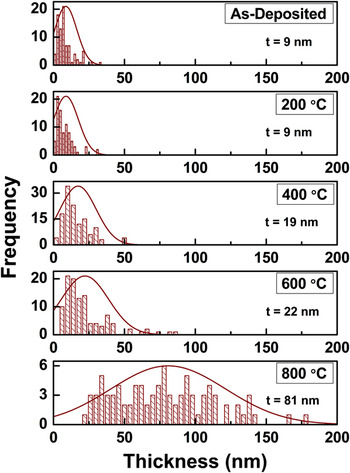
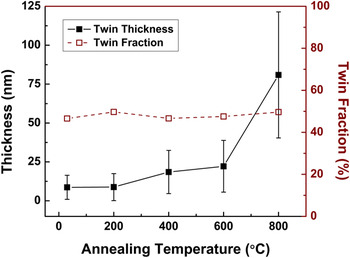
Figure 2 shows a narrow size distribution of twins in as-deposited (111) Ag films, which was essentially unchanged after annealing at 200 °C, remained narrow through 600 °C, but became much broader at 800 °C. Up to 200 °C, t twin remained unchanged, ∼9 nm, and then gradually grew to 22 nm by 600 °C. However, at 800 °C, t twin increased rapidly to 81 nm. Despite the twin thickness evolution, twin and matrix volume fractions in (111) Ag films remained unchanged (Fig. 3), both ∼50% throughout the range of annealing temperatures, so a distinction between the two variants is arbitrary.
Twin lamellae thickness histograms for (111) Ag films annealed at various temperatures. While annealing at 200 °C produced little change in the twin thickness, annealing at 400 and 600 °C causes a gradual increase in average twin thickness, as well as a broadening of the distribution. A dramatic spread of the distribution accompanies the sharp increase in average twin thickness at 800 °C. Still the structure remains heavily twinned, despite being heated to nearly 90% of the melting temperature. Due to the dense twins and essentially equal volumes of twin and matrix variants, twin and matrix lamellae are included together in these histograms.

Average twin thickness in (111) Ag films increased with annealing temperature. The twin thickness increased only moderately up to 600 °C, growing by less than a factor of 2.5. After annealing to 800 °C twin thickness increased rapidly by a factor of ∼ 10. Throughout the range of annealing temperatures the twin and matrix volume fractions remained essentially constant at ∼50% each.

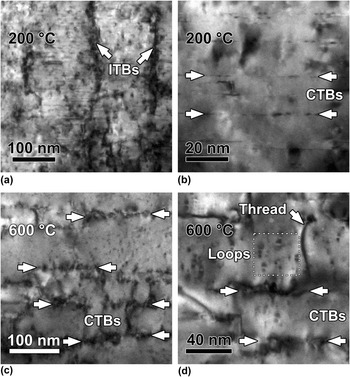
When (111) Ag films were examined from the <112> Ag zone axis, columnar domain boundaries were easily identified within as-deposited and 200 °C annealed films, whereas CTBs appear as faint dotted lines due to a few dislocations pinned along the boundaries as shown in Figs. 4(a) and 4(b). At higher annealing temperatures, an increasing number of dislocations are pinned to twin boundaries, so twin boundaries were more readily identifiable from the <112> zone axis [Figs. 4(c) and 4(d)]. In (111) films annealed at 600 °C, tangles of dislocations appeared at the twin boundaries along with numerous dislocations threading through the thickness of twins. Dislocation loop density also increased slightly after annealing.
XTEM micrographs of (111) Ag films examined along the <112> zone axis. After annealing to 200 °C, at low magnification (a) ITBs (marked by arrows) are the main visible features, while at higher magnification (b) a few straight CTBs appear as horizontal dotted lines due to dislocations pinned to the boundaries. After annealing to 600 °C, at low magnification (c) more dislocations were pinned along CTBs (between the arrows), and ITBs no longer appear. Micrograph taken at higher magnification (d) reveals long threading dislocations and dislocation loops in the annealed films. The defect density along the CTBs increased such that the CTBs were distorted and no longer smooth.

B. Annealing effects on the microstructure of nt Ag (110) films
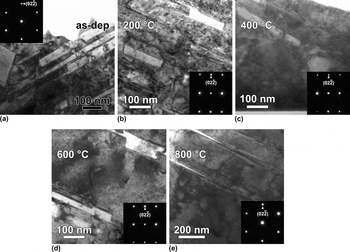
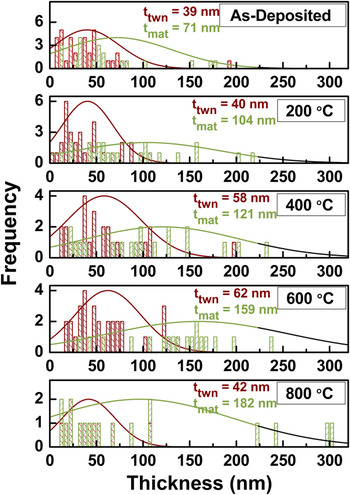
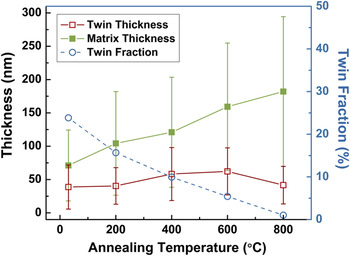
In these films, the matrix variant was more prevalent in the as-deposited case, so a distinction between matrix and twin variants is appropriate [Fig. 5(a)]. Inclined twin boundaries in the (110) films behaved differently after annealing from those within (111) films. Again, t twin increased, but twinned volume fraction also decreased [Figs. 5(b)–5(e)] due to a reduction of twin density and significant increase in matrix thickness. As in the (111) Ag films, a small increase in dislocation loop density appeared throughout the films as annealing temperature increased. SAD patterns reveal that the films maintain epitaxial character through the annealing temperature range. As shown in Fig. 6, annealing at 200 °C produced essentially no difference in average twin thickness in the (110) films. The twin thickness distribution remained relatively narrow throughout annealing, compared with a much broader distribution of matrix thickness. With increasing temperature, t twin increased moderately from 39 nm to a peak value (∼60 nm) at 600 °C, and then decreased thereafter at 800 °C. Average matrix thickness increased continuously with higher annealing temperature from 71 to ∼180 nm. In contrast to (111) textured Ag films, the twinned volume fraction decreased markedly from 25% in as-deposited films to only 1% at 800 °C (Fig. 7).
XTEM micrographs (110) Ag films examined along <111> [Figs. 5(a) and 5(e)] or <112> zone axis. Micrograph (a) corresponds to the as-deposited films, while (b)-(e) correspond to samples annealed at 200- 800 °C. The most evident change during annealing was a pronounced drop in twinned fraction. A large volume of twins of different orientations dominated in (a), but after annealing to 200 °C (b), the twinned fraction already began to decrease. The decrease continued through 800 °C (e), where the fraction of twins is merely ∼1%.

Twin and matrix lamella thickness histograms of (110) Ag films at various annealing temperatures. Matrix thickness increased rapidly with increasing annealing temperature, and the distribution broadens as well. Annealing at up to 600 °C caused a slight increase in average twin thickness, followed by a reduction at 800 °C.

Evolution of average twin and matrix lamellae thickness and volume fraction of twins with annealing temperature in (110) Ag films. Matrix thickness grew steadily with increasing annealing temperature. Meanwhile the volume fraction of twinned variants decreased from ∼25% to ∼1%. The average twin thickness increased moderately during annealing and eventually decreased at 800 °C.

IV. DISCUSSION
A. Phase stability and elimination of intermixing
Diffusion of Ag into Si is much less dramatic than Cu into Si.Reference Nason, Yang, Park and Lu32 Ag has low solubility in Si (1 ppm at 1100 °C, and falling quickly as temperature decreasesReference Weber33), and it forms no stable silicide. The Ag–Si binary system undergoes a eutectic reaction at 836 °C,Reference Chevalier34 however, all annealing temperatures were below this threshold. According to studies performed by Weber,Reference Weber33 solubility of Si in Ag at 400 °C and below is negligible. Solubility rises to 0.1% by 600 °C and 0.7% by 800 °C. Overall, the microstructures were homogeneous, with no noticeable differences near the substrate, indicating that any Si contamination within the film was negligible.
B. ITB migration in the (111) films
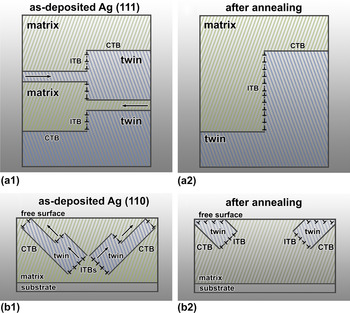
ITB migration is an important phenomenon directly related to both mechanical and thermal stability of twins.Reference Wang, Li, Anderoglu, Zhang, Misra, Huang and Hirth27–Reference Li, Wang, Zhang and Misra29 Partials comprising ITBs reside on successive (111) planes, and they migrated along their native {111} planes parallel to the substrate surface (and hence CTBs). Since no external forces acted on the film during annealing, there was little shear stress resolved onto other slip systems inclined to CTBs. Consequently, ITBs migrated in directions parallel to CTBs. Depending on the direction of movement, ITBs may either retract or extend the twin variant as they propagate, as shown in Figs. 8(a1) and 8(a2). The increase of t twin with temperature suggests the preferential removal of thinner twin variants. The driving force for detwinning is the reduction of overall system energy, and the driving force for ITB migration is estimated as 2 γ t/t, where γ t is twin boundary energy and t is twin thickness.Reference Wang, Li, Anderoglu, Zhang, Misra, Huang and Hirth27 Thus, migration velocity of thinner twins is greater than that of the coarser twins. Consequently, average twin spacing increased as finer twins were eliminated. Volume fractions of twin and matrix remained 50% after annealing, as thin variants of twins or matrix have equal probability of removal during annealing [Figs. 8(a1) and 8(a2)]. Migration of ITBs in (111) Ag films was noticeable even at 200 °C, as domain size increased from ∼95 to 135 nm. By 400 °C, twin spacing doubled, and ITBs had moved substantially, as evidenced by an increase of domain size to ∼350 nm. By 600 °C, it was apparent that ITBs were nearly exhausted; hence, the film had a lamellar structure consisting mostly of wide twin variants, with widths up to microns.
Schematic representations of annealing induced twin evolution in (111) films (a1-a1) and in (110) films (b1-b2). In panel (a1), the twin and matrix occupy equal volumes, and average twin thickness is small due to the inclusion of small twins. Elevated temperature can cause an ITB to move (with equal probability) either left or right along (111) planes parallel to the substrate, indicated by the arrows. After propagating (a2) the twinned fractions remain the same, but average thickness has increased substantially. In the (110) films (b1) none of the (111) planes are parallel to the substrate. Image forces from the free surface draw dislocations towards the surface, where they are emitted. This process allows the matrix to grow at the expense of the twinned variants (b2).

With few ITBs left after annealing at high temperatures (above 400 °C), the primary partial dislocation source for detwinning was significantly depleted. Thus, further removal of twin boundaries had to occur by dislocation climb. Climb is a nonconservative thermally activated process. Based on isotope diffusion experiments, the self-diffusion coefficient in Ag has been measured to increase rapidly from 3 × 10⁻¹⁸ cm2/s at 300 °C to 5 × 10⁻¹⁰ cm2/s at 800 °C, indicating that self-diffusion (and thus the rate of dislocation climb) increases dramatically at higher annealing temperatures.Reference Rothman, Peterson and Robinson35–Reference Varotsos and Alexopoulos37 Hence, twin thickness only increased slightly by ∼4 nm from 400 to 600 °C [Fig. 3(a)], while the abrupt increase in twin spacing at 800 °C can be attributed to increased activation of these diffusion processes. The temperature-dependent increase in twin thickness was largely similar to behavior seen in polycrystalline nt Cu,Reference Anderoglu, Misra, Wang and Zhang23 wherein t twin increased by a factor of 2 at 600 °C and doubled again at 800 °C, while columnar grain size in Ag increased even more rapidly. Cu has a higher melting temperature than Ag (1085 °C versus 962 °C), so the magnitude of the increase in t twin at 800 °C in Cu is less than that in nt Ag. Additionally, Fe impurities in polycrystalline nt Cu films may have enhanced resistance to the propagation of grain and twin boundaries. Curved twin boundaries in (111) Ag films annealed at 400 °C and above [Figs. 1(d) and 1(e)] actually consist of mixed steps of CTBs and ITBs. Glide of partial dislocations along {111} planes could generate these steps, and thus form what looks like a bent or curved twin boundary.
C. ITB migration in the (110) films
Within the (110) Ag films, many twin and matrix variants extended up to hundreds of nm even in the as-deposited state, and ITBs bound the ends of each variant. In (110) films, all 12-slip systems are oriented at angles to the substrate. Since Shockley partials have very high migration speed on {111} planes, ITBs can migrate over large distances and thus may frequently encounter the film surface or the film-substrate interface. Partial dislocations (comprising ITBs) are drawn toward free surfaces due to the dislocation image force and conversely repelled by rigid surfaces like the Ag–Si interface. Thus, a majority of partials may exit the film via the free surface as illustrated in Figs. 8(b1) and 8(b2). The image force on a dislocation is given by
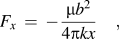 $$F_x \, = \, - {{{\rm{\mu }}b^2 } \over {4{\rm{\pi }}kx}}\quad,$$
where μ is the shear modulus, b is the Burgers vector, x is the distance between the dislocation and the surface along the film normal to the (x) direction, k = 1 for screw dislocations, k = (1 − ν) for edge dislocations, and ν is Poisson's ratio.Reference Hull and Bacon38 Image forces are significant when dislocations are close to free surfaces or interfaces. Most {111} planes in (110) films intercept the free surface, so image forces may establish a biased migration of partial dislocations, which continuously drives dislocations toward the free surface, where they will be eliminated. The combination of detwinning caused by ITB motion and ejection of dislocations at the free surface caused the twin fraction in (110) films to fall rapidly to 1% by 800 °C, in stark contrast to the case of the (111) films, where the twinned fraction remained ∼50% over the entire annealing range.
D. Effects of the mismatch stress on microstructure evolution
The difference in coefficient of thermal expansion between the film and the substrate may also affect microstructure evolution. Although Ag and Si have a substantial difference in lattice parameters (4.09 Å in Ag and 5.43 Å in Si), epitaxial Ag films on Si assume a 3 Si–to–4 Ag domain match, resulting in an in-plane mismatch strain of only 0.43%. Hence, the Ag film experiences a compressive in-plane strain at the interface at room temperature. Ag expands more rapidly than Si, so the strain rises to 1.7% at 800 °C. We compute a corresponding elastic compressive stress in Ag varying from 360 to 1400 MPa with increasing temperature. Resolved shear stress arising from this compressive stress may drive partials on inclined twin boundaries to propagate rapidly in the (110) films. In (111) nt Ag, however, the same compressive stress generates little resolved shear stress on partials residing on the (111) planes parallel to the substrate. Furthermore, during cooling considerable tensile stresses can develop within the films, which may lead to dislocation loop formation. Loops may also form directly as a result of annealing and may be stabilized by rapid quenching.Reference Clarebro, Segall and Loretto39 However, the slow cooling rates used in this study may not lead to a significant increase in loop density after cooling.
E. Annealing effects on the evolution of mechanical properties
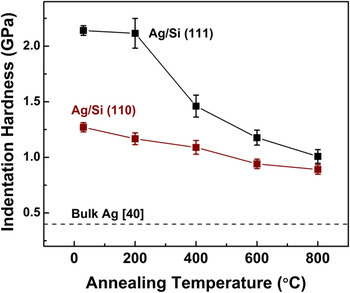
At 200 °C, hardness of the (111) films barely changed (Fig. 9), however, moderate softening occurred in (110) films. At higher temperatures, the hardness of (111) films fell rapidly by 1.1 GPa compared with a gradual softening of 0.3 GPa in (110) Ag films. Respective hardness values of the (111) and (110) films dropped by ∼55 and ∼40%, similar to the percentage drop seen in polycrystalline nt Cu over a similar annealing temperature range.Reference Anderoglu, Misra, Wang and Zhang23 Hardness values for the two films converged by 800 °C, with the (111) films having slightly higher hardness (∼100 MPa). Interestingly, the hardness of both films remained quite high in comparison with coarse-grained bulk Ag (∼0.4 GPa) despite heating to ∼87% of the melting temperature.Reference Pharr and Oliver40,Reference Christopher, Smith and Richter41 The orientation of the applied load with respect to twin boundaries has been shown to affect deformation behavior in nearly single-crystal nt Cu nanopillars deformed under uniaxial tension.Reference Jang, Li, Gao and Greer42 However, the effect seems to be much smaller in samples tested via indentation, where the orientation of indentation with respect to twin boundaries can lead to a hardness difference of ∼10% in the extreme case.Reference Weertman, Shute, Myers, Xie, Li, Barbee and Hodge5
Evolution of film hardness as a function of annealing temperature. In the (111) films, hardness remained constant after annealing to 200 °C, but drops rapidly thereafter to ∼ 1 GPa. In the (110) films the hardness steadily decreased through the temperature range.

High-density dislocation loops may explain the hardness retained (relative to bulk) in annealed (111) and (110) Ag films. Hardening caused by dislocation loops can be calculated by a dispersed barrier model
 $$\Delta {\rm{\tau }} = {\rm{\alpha }}\prime {\rm{\mu }}b\sqrt {Nd_{{\rm{loop}}} } \quad,$$
where τ is the critical shear stress, α′ is a parameter that depends on average barrier strength of the loops, N is the loop density, and d loop is the diameter of a loop.Reference Singh, Foreman and Trinkaus43 The TEM foil thickness was measured by using a convergent-beam electron diffraction technique,Reference Williams and Carter44 and dislocation loop density was determined by counting loops in areas of measured film thickness. We choose parameters for Ag as follows: α′ ≈ 0.16–0.3,Reference Taylor45,Reference Grossbeck, Maziasz and Rowcliffe46 μ = 30 GPa, and b = 0.289 nm. We take σflow ≈ 3τ (by using a Taylor factor of 3) and approximate indentation hardness by the Tabor relation H IT ≈ 2.7σflow.Reference Mata, Anglada and Alcala47,Reference Tabor48 For both cases, d loop was measured to be ∼3 nm. For the (111) and (110) Ag annealed at 800 °C, the loop density was ∼1.2 × 10²³ and 7.6 × 10²²/m3, respectively, thus leading to expected hardness increase of 270 and 200 MPa over loop-free Ag.
F. Strengthening due to both grain and twin boundaries
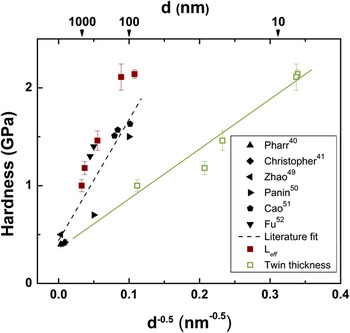
Often t twin (which is typically much smaller than average grain size) is used as the dominant feature size to explain size-dependent strengthening in nt fcc metals.Reference Anderoglu, Misra, Wang and Zhang23 As seen in Fig. 10, if t twin alone is used as the primary feature size (open squares in Fig. 10), the fitted line has a slope far below the fitted line from the literature data (from other experimental investigations of polycrystalline Ag) wherein the grain size is the dominant feature size.Reference Pharr and Oliver40,Reference Christopher, Smith and Richter41,Reference Zhao, Slaughter, Li and Mao49–Reference Fu, Shearwood, Xu, Yu and Khor52 The Hall–Petch slope is an indicator of barrier resistance to dislocation transmission. Hence, a drastic difference in slope leads to the illusion that grain boundaries are far more effective dislocation barriers than twin boundaries. Hence, t twin alone does not fully explain size-dependent strengthening in annealed nt Ag.
Evolution of indentation hardness of (111) Ag films with d −0.5 or t −0.5, where d and t represent grain size and twin spacing respectively. The linear fit of literature values is used as a reference. When the hardness of nt Ag is plotted as a function of average twin thickness alone, the linear fit leads to a slope much lower than the literature curve. However, the effective domain size, L eff, as defined in the text gives values close to literature data.

Gu et al. developed the nonuniform partial dislocation model by considering the influence of both twin and grain boundaries on flow stress.Reference Gu, Dao, Asaro and Suresh15,Reference Asaro and Suresh53,Reference Gu, Kad and Dao54 In that model, flow stress for propagation of partial dislocations is considered to be the average of flow stresses required to move partials toward and parallel to twin boundaries. Although both the grain size and the twin spacing are used to describe flow stress, a unified length scale that determines a size-dependent strengthening mechanism has not been identified. An effective barrier spacing, L eff, if derived, may better describe size-dependent strengthening in nt Ag, and such a feature size would be useful practically to compare the strength of polycrystalline nt metals to their counterparts free from twins. For microstructures with anisotropic grain structures (like the lamellar domain and twin boundaries in this study), L eff must reflect an average intercept distance based on the length and width of the grains,Reference McCall55 which can be accomplished by considering dislocation pileup against both types of boundaries.
For sputtered Cu with columnar grains filled with twin boundaries, Dahlgren and MerzReference Merz and Dahlgren56 geometrically determined an overall mean intercept distance,  $\bar l$, for hexagonal columnar grains that considered both t twin and columnar grain diameter, d:
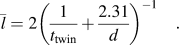 $$\bar l = 2\left( {{1 \over {t_{{\rm{twin}}} }} + {{2.31} \over d}} \right)^{ - 1} \quad.$$
However, using this mean intercept in the revised Hall–Petch plot (not shown here) still leads to substantially lower H–P slope than that for polycrystalline Ag.
In an attempt to quantify relative strengthening contributions from twins and domains, we consider a modified form of the Hall–Petch relation for size-dependent strengthening. In polycrystalline metals, the number of dislocations N d piling up against a grain boundary can be described as follows:
 $$N_{\rm{d}} = {{{\rm{\pi }}(1 - {\rm{\nu }})d({\rm{\tau }} - {\rm{\tau }}_0 )} \over {Gb}}\quad,$$
where τ is applied shear stress, and τ0 is lattice friction stress.Reference Misra, Hirth and Hoagland57 The stress at which the leading dislocation slips across a grain boundary, τ*, is given by the following relationReference Misra, Hirth and Hoagland57:
 $$N_{\rm{d}} ({\rm{\tau }} - {\rm{\tau }}_0 ) = {\rm{\tau }}^* \quad.$$
Combination of Eqs. (4) and (5) leads to a formulation of the Hall–Petch relationReference Misra, Hirth and Hoagland57:
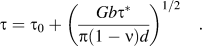 $${\rm{\tau }} = {\rm{\tau }}_0 + \left( {{{Gb{\rm{\tau }}^* } \over {{\rm{\pi }}(1 - {\rm{\nu }})d}}} \right)^{{1 \mathord{\left/ {\vphantom {1 2}} \right. \kern-\nulldelimiterspace} 2}} \quad.$$
When dislocations are likely to pileup against both grain and twin boundaries with disparate spacings, L eff replaces d. In this case, Eq. (5) can be redefined as
 $$P_{\rm{d}} N_{\rm{d}} ({\rm{\tau }} - {\rm{\tau }}_0 ) + P_{\rm{t}} N_{\rm{t}} ({\rm{\tau }} - {\rm{\tau }}_0 ) = {\rm{\tau }}^* \quad,$$
where P d and P t are respective probabilities of dislocation pileup against grain and twin boundaries and can be approximated as (1 − t/d) and t/d, respectively. Numerous molecular dynamics (MD) simulations have shown, however, that twin boundaries are comparable with grain boundaries in terms of resistance to dislocation transmission.Reference Anderoglu, Misra, Ronning, Wang and Zhang8,Reference Zhang, Misra, Wang, Nastasi, Embury, Mitchell, Hoagland and Hirth13,Reference Gu, Dao, Asaro and Suresh15,Reference Zhang, Misra, Wang, Lima, Hundley and Hoagland58 Meanwhile, assuming that the dislocation separation distance is similar when pilingup against grain and twin boundaries, then N t, the number of dislocations pilingup against twin boundaries, can be estimated as N dt/d. By combining Eqs. (6) and (7), one arrives at
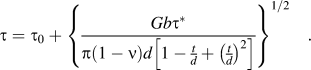 $${\rm{\tau }} = {\rm{\tau }}_0 + \left\{ {{{Gb{\rm{\tau }}^* } \over {{\rm{\pi }}(1 - {\rm{\nu }})d\left[ {1 - {\textstyle{t \over d}} + \left( {{\textstyle{t \over d}}} \right)^2 } \right]}}} \right\}^{{1 \mathord{\left/ {\vphantom {1 2}} \right. \kern-\nulldelimiterspace} 2}} \quad.$$
Comparing Eqs. (6) and (8) shows that
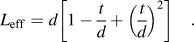 $$L_{{\rm{eff}}} = d\left[ {1 - {t \over d} + \left( {{t \over d}} \right)^2 } \right]\quad.$$
Notice if twin boundaries are absent or when t = d, L eff reduces to d, and the traditional Hall–Petch relation is recovered. Also, this equation applies when the twin volume fraction is identical or at least comparable to that of matrix. Figure 10 shows that by using L eff, hardness of annealed nt (111) Ag films follows the literature data (where d is the dominating dimension) very well.
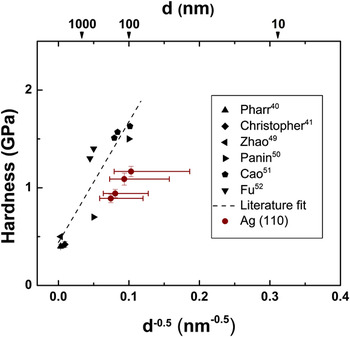
The (110) Ag films have been analyzed differently from the (111) films due to their different microstructure. The microstructure is more isotropic than in (111) films because twin boundaries and slip planes are more evenly distributed throughout the film. Hence, the structure is more similar to a polycrystalline metal than the lamellar structure of the (111) nt Ag films, and measured twin thickness more accurately reflects true average barrier spacing. Figure 11 is a Hall–Petch type plot for the (110) films, and the feature size used here is a volume-weighted average of the twin and matrix spacing. With these parameters, hardness falls much closer to what is expected given in the literature data, but still somewhat lower than the expected value. A recent study shows that material response is affected not only by mean grain size but also by grain size distribution.Reference Zhu, Asaro, Krysl and Bailey59 In nc Ni with similar mean grain size of ∼20 nm, increasing variance in the grain size distribution resulted in a drop in ultimate tensile strength exceeding 20%. Twin and matrix thickness were both broadly distributed in the (110) Ag films (Fig. 7), suggesting that strength may fall substantially below what is predicted by t twin. When these are considered, the data fall close to the fitted literature Hall–Petch slope. This suggests that the broad distribution associated with the mean thickness causes large domains to dominate strengthening behavior.
Hall-Petch plot using indentation hardness of (110) Ag films using the average domain size. The hardness values of all films fall somewhat below the fitted line from the literature. However, if outlying domains (dotted error bars) are considered, the fitted slope for literature data accurately represents the data in this study.

V. CONCLUSIONS
Microstructures of epitaxial nt (111) and (110) Ag films show significantly different thermal stability during annealing. Twin thickness increased very slowly in (111) films until thermal diffusion processes were activated, and even then average twin thickness remained below 100 nm. Additionally, in (111) Ag films, the twinned volume fraction remained unchanged, at ∼50%, while in (110) films, twins were quickly removed during annealing. This orientation dependence provides an important mechanism for preserving nanotwins at high temperature. Indentation hardness fell in both films but more dramatically in (111) films. Both films showed similar hardness after annealing to 800 °C. Large domains in (111) films had a strong effect on hardness, and an effective feature size accurately returns the data to the Hall–Petch slope. The (110) films have a less regular structure, and hardness can be returned to the Hall–Petch slope by considering a volume-weighted average of twin and matrix thicknesses as well as larger domain sizes.
ACKNOWLEDGMENTS
We acknowledge financial support by NSF-DMR metallic materials and nanostructures program under grant no 0644835. Access to the microscopes at the Microscopy and Imaging Center at Texas A&M University is also acknowledged.