INTRODUCTION
Early efforts to conserve natural resources have been associated with substantial social and economic consequences for local residents (Colchester Reference Colchester, Ghimire and Pimbert1997; Gbadegesin & Ayileka Reference Gbadegesin and Ayileka2000; Kapoor Reference Kapoor2001). While rural residents in developing countries have the most to lose from the depletion of natural resources, they also have the most to lose from typical methods of conservation (Balmford & Whitten Reference Balmford and Whitten2003; Brechin et al. Reference Brechin, Wilshusen, Benjamin, Brechin, Wilshusen, Fortwangler and West2003). Today, even the exclusionary resource protection methods of the past have evolved to view local residents as important partners in protected areas (PAs).
The hardships endured by residents closest to PA boundaries are substantial, and can include wildlife-induced loss of life or property, displacement from homeland, difficulties meeting subsistence needs and loss of economic opportunities (Norton-Griffiths & Southey Reference Norton-Griffiths and Southey1995; Balmford & Whitten Reference Balmford and Whitten2003). For conservation efforts to be successful these costs must be addressed. Following this philosophy, incentive-based programmes (IBPs) have become common in PAs encompassing local communities and in buffer zones surrounding strictly protected core areas (Brandon Reference Brandon, Brandon, Redford and Sanderson1998, Reference Brandon, Terborgh, Van Schaik, Davenport and Rao2002; Noss et al. Reference Noss, Dinerstein, Gilbert, Gilpin, Miller, Terborgh, Trombulak, Soulé and Terborgh1999; Heinen & Shrestha Reference Heinen and Shrestha2006). Most IBPs fall into two categories: community-based conservation (CBC) (Western et al. Reference Western, Wright and Strum1994) and integrated conservation and development programmes (ICDP) (Brandon & Wells Reference Brandon and Wells1992). Despite some differences between these two programmes, various authors have used the term IBPs to describe projects that aim to balance conservation with the livelihood needs of local residents around PAs (Hutton & Leader-Williams Reference Hutton and Leader-Williams2003; Spiteri & Nepal Reference Spiteri and Nepal2006). Applications of IBPs intend to foster stewardship and compensate residents by distributing benefits tied to conservation efforts, such as social services and economic development (Hutton & Leader-Williams Reference Hutton and Leader-Williams2003; Spiteri & Nepal Reference Spiteri and Nepal2006). While, in theory, IBPs encompass ecological, economic and social concerns, in practice, they have been criticized for failing to meet these objectives (Wells & Brandon Reference Wells and Brandon1993; Wainwright & Wehrmeyer Reference Wainwright and Wehrmeyer1998; Noss et al. Reference Noss, Dinerstein, Gilbert, Gilpin, Miller, Terborgh, Trombulak, Soulé and Terborgh1999; Songorwa Reference Songorwa1999; Terborgh Reference Terborgh1999; Gupte Reference Gupte2003).
Throughout the literature, examples abound of well-intended IBPs that fall short of expectations owing to poorly targeted programme benefits (Walpole & Goodwin Reference Walpole and Goodwin2001; Jim & Xu Reference Jim and Xu2002; Gadd Reference Gadd2005). Such failures can stem from IBPs reaching unintended beneficiaries, or from intended beneficiaries not recognizing IBP activities as benefits (Archabald & Naughton-Treves Reference Archabald and Naughton-Treves2001; Songorwa Reference Songorwa1999; Ikeda Reference Ikeda2004). IBPs have also been shown to encourage immigration, thereby further diluting benefits intended for local residents (Van Schaik & Rijksen Reference Van Schaik, Rijksen, Terborgh, Van Schaik, Davenport and Rao2002). Furthermore, IBPs have had limited success in distributing benefits across spatial scales (Josiah Reference Josiah2001; Kiss Reference Kiss2004). Research on differences in benefit perceptions between villages has typically included communities experiencing varying consequences due to their proximity to the PA boundary, with individuals from villages closest to the boundary holding less favourable attitudes toward the PA than those further away (Mehta & Heinen Reference Mehta and Heinen2001; Jim & Xu Reference Jim and Xu2002). Few case studies address the problems arising from spatial concentrations of IBPs (Nepal & Weber Reference Nepal and Weber1993; Barrett & Arcese Reference Barrett and Arcese1995; Walpole & Goodwin Reference Walpole and Goodwin2000; Adams & Infield Reference Adams and Infield2003; Sekhar Reference Sekhar2003).
Despite efforts to encourage participation, IBPs remain externally motivated and initiated, making it difficult to design programmes that directly address local needs and costs (Metcalfe Reference Metcalfe, Western, Wright and Strum1994; Brandon Reference Brandon, Brandon, Redford and Sanderson1998; Brown Reference Brown2002). In addition, embedded cultural barriers and inherent limitations on the magnitude of benefits limit the reach of IBPs and lead to unfair and unequal distribution of benefits. Therefore, identification of programmes and projects as benefits by the local community is critical when developing conservation programmes centred on the use of incentives to generate local support. Without this recognition, IBP efforts simply go unnoticed and waste programme resources. Even if benefits are recognized as such, their distribution must be directed to those most affected by conservation efforts (McIvor Reference McIvor, Ghimire and Pimbert1997; Tisdell Reference Tisdell1999; Walpole & Goodwin Reference Walpole and Goodwin2000; Sekhar Reference Sekhar2003).
The Chitwan National Park (CNP) has been heralded as an exemplary model of conservation, but there has been a long history of conflicts between local communities and wildlife conservation. In response, the Department of National Parks and Wildlife Conservation (DNPWC), with support from various local and international agencies, has introduced IBPs around the Park. Such programmes have increased in frequency and scope since the Fourth Amendment to the National Parks and Wildlife Conservation Act of 1973, passed in 1993. This provided the DNPWC legal authority to designate buffer zones around the Park that allowed local people to use forest resources (Nepal & Weber Reference Nepal and Weber1995a; Heinen & Mehta Reference Heinen and Mehta2000). In the CNP, buffer zone projects implemented in Bagmara and Kumrose have included successful community forestry and tourism (Nepal Reference Nepal2002). Similarly, parts of the Tikauli forest have been handed over to local community forestry user groups, in an effort to restore degraded forested areas and sustainable extraction of timber and fuelwood. However, despite more than a decade of implementation of these programmes, resolution of conflicts between local residents and Park authority has not been achieved, which indicates problems in programme design and implementation. It is therefore critical to examine if benefits have outweighed costs of conservation, and if benefits have reached the intended beneficiaries. By closing the loop between benefits and beneficiaries, conservation issues can be addressed more effectively and on a long-term basis.
This paper examines the IBPs applied in the buffer zone of CNP based on local residents’ perceptions of IBP benefits. The main objectives are to (1) examine local residents’ perceived costs due to PA management, and perceived benefits from IBPs around the CNP and (2) evaluate the CNP's ability to focus the distribution of benefits on those most affected by the Park's conservation efforts, and ensure benefits reach individuals and regions regardless of demographic characteristics or their direct participation in tourism. The study contributes to understanding the complexity of reconciling conservation and livelihood needs, and informs strategies for improving relations in PAs elsewhere.
METHODS
Study area
The CNP covers an area of 932 km2 and is a World Heritage Siteig for its natural and cultural heritage. The Park is located in the south-central terai region of Nepal and is managed by the DNPWC. The CNP was initially created under a people-free approach in 1973, and all communities were consequently resettled outside the boundaries of the Park (McLean & Stræde Reference McLean and Stræde2003; Dhakal et al. Reference Dhakal, Nelson and Smith2006). Local people face ongoing threats of crop raids, predation and injury or death from wildlife, and are restricted from using Park resources (Nepal & Weber Reference Nepal and Weber1993, Reference Nepal and Weber1995b; Stræde & Helles Reference Stræde and Helles2000; Nepal Reference Nepal2002). Over 223 000 people live in the 767 km2 buffer zone surrounding the Park.
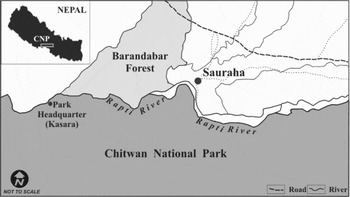
The buffer zone was established in 1996 in response to the need for landscape-scale conservation and to address the conflicts between communities and the Park (Stræde & Helles Reference Stræde and Helles2000). The DNPWC and its non-government partners have since initiated programmes to support conservation within and around CNP and improve the economic conditions for local people. Buffer zone projects have included capacity building through training, Park infrastructure improvements, revenue sharing and community forestry (DNPWC 2002, 2003). Opportunities to view rare wildlife have drawn tourists since the Park's creation and, although tourist entry points are concentrated in only a few areas, tourism provides the primary source of funds for IBPs in the buffer zone (DNPWC 2004). The study area is located on the CNP's northern boundary in the buffer zone villages surrounding the Park's main tourist entry gate (Fig. 1).
Diagrammatic map of study area (not to scale). CNP = Chitwan National Park.

Data collection and analysis
Purposive sampling was used to select the villages incorporated in this research to evaluate spatial distribution. Villages were divided into two groups based on the presence or absence of a major tourism centre. Additional criteria for the overall village area selection included location near the Park boundary, representation of the region's culture and livelihood activities, historical reliance upon natural resources, livelihood implications due to conservation, and size of community. Sauraha and Odhara, here referred to as gateway villages (GVs), are located at the main access point to the Park, and contain the majority of tourist facilities and services in the Chitwan district. Villages not exhibiting GV characteristics were categorized as distant to gateway villages (DGVs). At the time of the research, the region surrounding CNP was heavily affected by political conflict. During the field research, news reports of armed confrontations between the insurgents (Maoists) and the Nepali Army, shootings, bombings, attacks and Maoist imposed strikes were frequent. Baral and Heinen (Reference Baral and Heinen2006) provided a good analysis of Maoist insurgency and its effect on conservation in Nepal. The selection of DGVs was restricted to villages in the vicinity of the main tourist gateway into the CNP because of concerns over researchers’ safety in other areas. However, the selected DGVs, apart from Park authority sanctioned extraction of Park resources, did not benefit from other conservation and development projects and had very little tourism presence.
The data were collected during October–December 2004. Structured interview questionnaires were held with 189 households, including 108 from DGVs and 81 from GVs. Questions were set to facilitate quantitative analysis and the use of inferential statistics; however, qualitative methods were also included as open-ended questions to provide a basis for interpreting the statistical results (Oppenheim Reference Oppenheim1992; Neuman Reference Neuman1997). Two research teams, each consisting of two people, asked the questions and recorded responses during face-to-face interviews. Questionnaires were conducted with randomly selected male or female heads of households from every other household within each village. Questionnaires were written in Nepali, but, depending on the respondent's ethnicity and language, were translated by research assistants. Closed and open-ended questions were partially adapted from previous research and asked respondents for information on losses from protected wildlife, natural resource use, perception of programme benefits and demographic characteristics. Local perceptions were also qualitatively evaluated during informal discussions in the villages, observations in the field, guided interviews with community informants, Park management and conservation experts, and a review of CNP's published and unpublished policies (Conley & Moote Reference Conley and Moote2003).
The reported number of wildlife species responsible for crop damage and livestock depredation was used as a measure of a respondent's perceived wildlife costs (after de Boer & Baquete Reference de Boer and Baquete1998) because economic values provide a poor representation of losses for subsistence farmers (Nepal & Weber Reference Nepal and Weber1993; Neuman Reference Neuman1997; de Boer & Baquete Reference de Boer and Baquete1998). The implications of restricted resource access were measured by a respondent's stated dependency on natural resources, which was calculated by summing each respondent's weighted indication of their current use of, and desire to use, specific resources (De Vaus Reference De Vaus2002).
Benefits represent respondents’ perceptions of benefit receipt overall and from tourism. Respondents were asked to provide a list of benefits received by their household and their community from the protection of natural resources and development projects. Scale scores for a household's receipt of benefits were derived from two questions asking respondents to rank their perceived level of benefits from the protection of natural resources and conservation-related development activities. The responses were summed and transformed to create the composite scale, from zero to 10. Respondents were considered to perceive benefits from tourism if they provided positive responses to either of the following questions adapted from Walpole and Goodwin (Reference Walpole and Goodwin2001): (1) my family has more money due to tourism, and (2) tourism benefits my family. Tourism benefit was broken down into direct and indirect benefits, based on employment in the tourism industry by at least one member of the household. If a household had one of its members employed in tourism, then that household was considered to have received direct tourism benefit. If no household members were employed in tourism, but received other forms of benefits not directly related to tourism (for example access to drinking water supply financed with tourism revenues) then it was considered as an indirect tourism benefit.
Respondents’ characteristics
The gender breakdown of respondents was 59% women and 41% men in DGVs and 37% women and 63% men in GVs. The most represented age group in each village was 25–45 years (52% and 64% in DGVs and GVs, respectively), with 17% (DGVs) and 16% (GVs) young respondents (18–24 years), 28% (DGVs) and 16% (GVs) between 46 and 64 years, and 4% classified as old in each village category (> 65 years). Almost 45% in DGVs and 25% in GVs had no formal education. Roughly 19% (DGVs) and 12% (GVs) had completed primary education, 15% (DGVs) and 14% (GVs) lower secondary education, 19% (DGVs) and 21% (GVs) secondary education, and 3% (DGVs) and 28% (GVs) had attended university. Nearly 73% of respondents in GVs were born in the Park or buffer zone, while only 54% in DGVs were native to the area. The middle caste category included the indigenous Tharu people, and represented the majority of respondents in both village types, followed by high castes and then low castes. Agriculture was the main livelihood activity in DGVs (69%); no DGV respondents were employed in tourism. In GVs, 58% of respondents identified tourism as their main occupation.
Data analysis
Data were analysed using the Statistical Package for the Social Sciences (SPSS) Version 13.0. Chi-square tests of significance were used to identify differences between village categories and nominal dependent variables. If two variables represented significant differences (p < 0.05), Cramer's V was used as a measure of association, where values range from 0 (no association) to 1 (perfect association) and provide an indication of the strength of the relationship. Logistic regression analysis was used to examine the relationship between several independent variables and wildlife costs and resource dependency. The scale scores for the dependent variables were transformed into dichotomous variables to reflect high and low costs separated by the group mean. The odds ratio was used to interpret significant relationships between dependent and independent variables in all logistic regression analyses; statistical significance provides no indication of the strength of the association (Tabachnick & Fidell Reference Tabachnick and Fidell2001). The odds ratio is a measure of association between each independent variable and the dependent variable. When B is negative, the odds ratio needs to be inverted to indicate odds by dividing 1 by the odds ratio.
To facilitate a logistic regression using demographic variables as predictors, the composite scale score for benefit perceptions was transformed into a dichotomous variable by creating two categories of benefits (few, many) by the group median. Relationships between type of tourism benefit and perceptions of benefit receipt scale scores were examined using Kruskal-Wallis tests (p < 0.05). The dichotomous variable for perceptions of benefit receipt was used in a hierarchical logistic regression to explore relationships with costs, and determine the effect of village on the relationships identified. Some demographic variables required transformation from their nominal measure as categories into dichotomous variables in order to simplify logistic regression analysis (De Vaus Reference De Vaus2002). Earnings on an absolute scale provide an incomplete measure of wealth in developing countries; hence a respondent's economic status as ‘wealthy’ or ‘poor’ was determined based on their stated difficulty at meeting their subsistence needs (after Mehta & Heinen Reference Mehta and Heinen2001). Occupation and caste were originally collected as responses to open-ended questions, which were then converted into dummy variables (De Vaus Reference De Vaus2002). The caste system in Nepal is an established hierarchy determining occupation, social interaction and status (Bista Reference Bista1967). For the purpose of this research, caste was treated as a three-category nominal variable.
RESULTS
Perceived costs
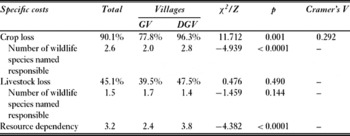
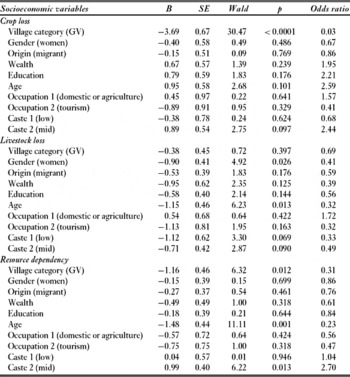
Crops were grown by 85% of the respondents overall, 99% in DGVs and 67% in GVs. Damages to crops caused by wildlife were experienced by 90% of farmers overall, and were moderately more problematic in DGVs than GVs (Table 1). On average, farmers named 2.6 species of wildlife responsible for crop damage, with rhinoceros, deer and boar the most common species. Respondents from DGVs had a higher number of wildlife raiding their crops than respondents from GVs. The logistic regression results confirmed that GV residents suffered less from crop damages than DGV residents (Table 2); overall fit of predicted to observed ratio was 83.1%. No other demographic variables contributed to the variation in this cost.
Differences in proportion of respondents identifying costs in gateway (GV) and distant (DGV) villages. Association indicated by Cramer's V: moderate.

Results of logistic regression between demographic variables and costs. B = regression coefficient, SE = standard error, Wald = Wald statistic, p = significance.

Roughly 75% of the respondents in CNP were raising livestock. The numbers of people raising livestock differed between DGVs (92%) and GVs (53%) (χ2 = 34.84, V = 0.442, p < 0.0001). Almost 45% of those raising livestock had experienced predation on their animals by wildlife, with no significant difference between villages (Table 1). Tiger, leopard, mongoose and jackal were the animals most commonly named as responsible for killing livestock, with an average of 1.5 species named by those experiencing livestock loss. In the logistic regression analysis, gender and age showed significant partial effects in determining livestock loss (Table 2); overall fit of predicted to observed ratio was 68.8%.
Roughly 84% of respondents reported collecting Park resources, while 64% indicated they would like to have additional access to resources. A large proportion (78%) indicated they occasionally collected wood from the Park; 98% would have liked to collect more wood. Additional resources people desired included live trees (79% reporting), land for livestock grazing (53%), and non-timber forest products and/or medicinal herbs (49%). The scores for the composite scale created to indicate resource dependency ranged from zero to 10, with an overall mean of 3.2, and total dependency on natural resources greater in DGVs (Table 1). Age and caste had significant effects on an individual's level of resource dependency when other demographic variables were considered in a logistic regression (Table 2); overall fit of predicted to observed ratio was 67.6%.
Perceived benefits
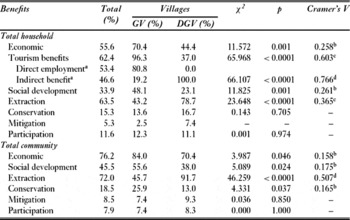
Among the answers given to the open-ended question ‘Do you see a need for the Park to exist’, 82% of respondents suggested the Park benefited local people. Household and community-level economic benefits from the Park were identified, and this was moderately more so in GVs than in DGVs (Table 3). Overall, 62% of respondents perceived benefits from tourism (Table 3), of which 53% had a household member directly employed in tourism services, while the remaining 47% recognized indirect benefits from tourism. Relationships between tourism benefits and village category were very strong. Overall, significantly more households in GVs perceived benefits from tourism than in DGVs, and more households had at least one person employed in the tourism industry. Therefore, of the people recognizing benefits from tourism, DGV residents were more likely than GV residents to recognize indirect benefits.
Percentage benefits identified by respondents for household and community, based on total number of respondents including those who gave no response. Percentages do not equal 100% because respondents were allowed to provide more than one response. χ2 test results not provided when more than 20% of cells had expected cell frequencies < 5. aExpressed as a percentage of people perceiving benefits from tourism. Associations indicated by Cramer's V: bmoderate, csubstantial and dvery strong.

Household-level social benefits were identified by 34% of respondents. Moderate differences existed between villages identifying their household as a recipient of social benefits. Respondents more readily identified social benefits at the community-level (46%), these benefits being recognized more in GVs than DGVs.
Fuelwood, grass for house construction and plants for livestock fodder were necessary for subsistence of the majority of residents surrounding the CNP, and were the most frequently identified extraction benefits from the Park. Occasional use of the Park as a source of wood was indicated by 78% of respondents, non-timber forest products and/or medicinal herbs by 12%, fish and animals by 24%, livestock grazing by 11%, and live trees by 1%. Fuelwood was the main resource harvested from the Park. Despite having restricted access (i.e. the Park authority allowing local people to enter the Park for 20 days every year to collect thatch grass and reed), 64% of respondents still recognized access to resources for extraction as a benefit. The provision of resources for use was a major benefit identified at the household and community levels in DGVs, which was substantially different from GVs (Table 3). Residents in both village categories perceived the availability of wood, grass and fodder as benefits to their household and their community.
Responses were classified as ‘conservation benefits’ if the respondent suggested the protection of natural resources was a benefit without indicating protection for personal use. Responses included aesthetic and recreational benefits, opportunities to view wildlife, preservation for future generations, or general forest conservation. Only 15% of respondents indicated conservation benefits at the household level, while 19% recognized conservation benefits received by their community. The identification of community-level conservation benefits was significantly higher in GVs than in DGVs, forest conservation and reforestation being mentioned more frequently as conservation benefits in GVs.
The category for mitigation benefits included efforts by Park management to directly reduce crop, livestock or property losses. Such efforts included direct compensation or protection from wildlife damage to crops, livestock or property, protection from erosion and floods, and support for persistence of natural processes. Few respondents recognized household- or community-level benefits under this category. Half of the respondents in CNP participated in conservation or development committees, yet only few recognized benefits from participation. Participation benefits included involvement with community support groups and lending agencies, and increased awareness of conservation issues through education.
Benefit distribution by demographics and costs
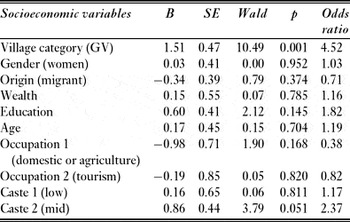
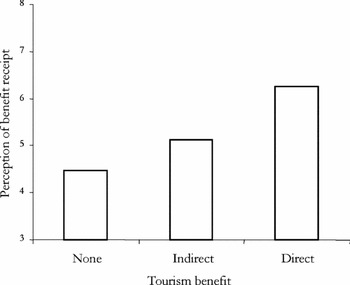
Apart from village category, no other demographic variable influenced perceptions of benefits received (Table 4); overall fit of predicted to observed ratio was 71.1%.The levels of overall benefits received were related to type of tourism benefit (none, indirect, direct) indicated (Fig. 2). Kruskal-Wallis analysis indicated differences were significant (χ2 = 24.568, df = 2, p <0.0001).
Results of logistic regression between demographic variables and perceptions of benefit receipt. B = regression coefficient, SE = standard error, Wald = Wald statistic, p = significance.

Mean perception of benefit receipt by type of tourism benefit.

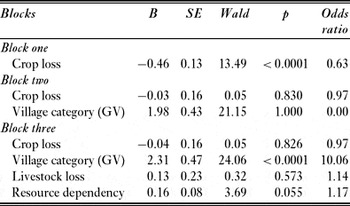
Because village category was significant in determining costs and benefit perceptions, a hierarchical logistic regression was used to determine if deficiencies in benefit distribution had more to do with costs or with village category. The relationship between perceived level of benefit and each cost was investigated using bivariate logistic regression. The only statistically significant relationship was a negative relationship between crop loss and benefit receipt (Table 5, block one). By controlling for village category, the significant negative relationship between crop loss and benefits receipt disappear, indicating differences in benefit distribution are a result of village category (Table 5, block two). Resource dependency and livestock loss were not significant predictors of benefits (Table 5, block three); overall fit of predicted to observed ratio was 72.6%.
Results of hierarchical logistic regression between costs and perception of benefit receipt. B = regression coefficient, SE = standard error, Wald = Wald statistic, p = significance.

DISCUSSION
Local residents are generally in favour of the Park, as it has provided them with various benefits. Indeed, 82 % of respondents stated that it was beneficial to have a national park. However, there were substantial differences between DGVs and GVs in terms of perceptions of benefits received and their overall distribution. The level of benefits received by households depends only on village category, indicating equal distribution within villages across other demographic variables. However, an examination of the distribution of benefits in relation to conservation costs revealed residents experiencing the greatest costs are not directly targeted by IBPs, and residents who suffer the most from crop damage by wildlife (residents in DGV) actually benefited the least (Table 5).
Damage caused by wildlife is a problem faced in varying degrees by most villages surrounding PAs. The large animals protected in the CNP, such as rhinoceros (Rhinoceros unicornis), elephant (Elephas maximus) and tiger (Panthera tigris), have substantial implications for the livelihoods of surrounding villagers. Residents do not go out at night for fear of threats to personal safety, and villagers stated such fear actually encourages conversion to alternative fuel sources, in order to limit the need to enter the forest to collect resources. An increased trend towards stall feeding livestock can also be partially attributed to apprehension about entering the forest on a daily basis to graze livestock (Matthews et al. Reference Matthews, Shivakoti and Chhetri2000). Because there were a larger number of people growing crops and involved in subsistence agriculture in DGVs, households in these villages suffer most from crop loss and restrictions on access to resources. Livestock losses were most frequently reported by men and younger respondents, perhaps because these individuals typically protect livestock and are most likely to encounter wildlife. Younger respondents and members of middle caste, mainly the indigenous Tharu, were also more dependent on resource extraction.
The GV respondents perceived more household benefits from conservation and development than DGV respondents. This is in agreement with other studies of regional inequities in PA benefit distribution (Walpole & Goodwin Reference Walpole and Goodwin2000; Sekhar Reference Sekhar2003). No other demographic variables were related to perceptions of benefit receipt, indicating that, within villages, benefits are equal and not differentiated based on gender, age, occupation, wealth, education or caste. This contradicts common findings regarding benefit distribution in PAs in developing countries, where women and the poor benefit the least (Wells & Brandon Reference Wells and Brandon1993; Goodwin & Roe Reference Goodwin and Roe2001). The differences between benefits and costs in DGVs and GVs can be explained by differences in livelihood activities between communities. In DGVs, the primary livelihood activity is subsistence-based agriculture, requiring the direct use of resources. The livelihood activities of residents in GVs have largely been converted to tourism, increasing economic returns and minimizing subsistence resource demands. While agriculture and subsistence livelihoods require natural resource inputs, tourism depends on importing secondary market goods to fulfil tourist demands for food, water and souvenirs, and employment provides the cash flow necessary for purchasing market goods to fulfil household needs (Walpole & Goodwin Reference Walpole and Goodwin2000). Local people who are engaged in the tourism industry find it increasingly difficult to continue to visit the park for resource extraction, and thus have abandoned such practice (Stem et al. Reference Stem, Lassoie, Lee, Deshler and Schelhas2003).
The economic benefits received through direct employment in tourism are higher in GVs, and could explain why GV residents perceived higher overall household benefits than DGV residents. It has been estimated that the CNP provides employment opportunities in tourism to approximately 1% of the population surrounding the Park (Bookbinder et al. Reference Bookbinder, Dinerstein, Rijal, Cauley and Rajouria1998). While new figures are hard to obtain, it is likely that employment opportunities in tourism in Chitwan may have diminished because of the overall decline in tourist arrivals to Nepal since 2000 (Bhattarai et al. Reference Bhattarai, Conway and Shrestha2005). While direct employment in tourism is limited to residents of GVs, tourism benefits have been extended indirectly to other areas. The CNP instituted a bylaw in 1996, requiring that 50% of revenues from tourist entry fees be distributed to buffer zone committees for use in community development projects (HMGN [His Majesty's Government of Nepal] 1996). With approximately one-third of respondents identifying indirect benefits from tourism, local residents, especially in DGVs, have recognized this sharing of tourism revenues. The indirect tourism benefits more common in DGVs manifest themselves in communal development projects, which provide incrementally less benefit per household. It has been found in other studies that such social development projects provide no meaningful contribution to local livelihoods (McIvor Reference McIvor, Ghimire and Pimbert1997; Archabald & Naughton-Treves Reference Archabald and Naughton-Treves2001), and may explain why social development benefits were not recognized in DGVs.
Whether immigrants are attracted to the economic opportunities from tourism, urban or international travel agencies, or are suppliers of secondary market goods, outsiders are unintended beneficiaries of PA tourism (Ross & Wall Reference Ross and Wall1999; Sekhar Reference Sekhar2003). While this research does not involve examining the loss of local benefits to the entire realm of outsiders, no difference was found in benefit receipt perceptions between immigrants and native residents. Bookbinder et al. (Reference Bookbinder, Dinerstein, Rijal, Cauley and Rajouria1998) found 72% of hotel employees and 74% of nature guides in the CNP originated from the local area, however 61% of hotel ownership was non-local. Although some employment opportunities are available to local residents, with outside ownership and more than half of the bookings for hotels in the Chitwan area made in advance in Kathmandu, the local area loses substantial tourism revenues. The tourism revenue contributed to the local economy is further limited by deflated market conditions resulting from competitive pricing and budget travellers attracted to CNP (Bookbinder et al. Reference Bookbinder, Dinerstein, Rijal, Cauley and Rajouria1998).
Resource collection constitutes a significant daily activity of residents surrounding CNP (Matthews et al. Reference Matthews, Shivakoti and Chhetri2000; Stræde & Helles Reference Stræde and Helles2000; Nagendra et al. Reference Nagendra, Karmacharya and Karna2005). The availability of resources for use is considered a benefit from the Park and was the most frequent benefit mentioned by DGV residents. For three days every year the CNP allows grass extraction by buffer zone residents to fulfil personal needs (Stræde & Helles Reference Stræde and Helles2000). Thatched roof construction on Tharu houses requires 250 bundles of grass every 2–3 years, yet we found that typical extraction rates are only five bundles of grass per day per household. Based on these estimates, under the current three-day per year grass-cutting programme in CNP, residents would require sixteen years to collect enough grass for a traditional Tharu thatched roof. While respondents indicate resource provisions within the Park boundaries are inadequate, respondents still recognize household and community benefits from resources. Such recognition suggests the use of resources from the Park during the permitted grass-cutting period is supplemented by illegal extraction from the Park throughout the year, and from resources in buffer zone forests. On one occasion during the fieldwork, more than 200 women were seen crossing the Rapti River for illegal resource collection from the Park.
Conservation benefits were mentioned by less than one-fifth of respondents. Since such benefits are not typically recognized by rural residents in developing countries (Balmford & Whitten Reference Balmford and Whitten2003), these modest findings indicate an interesting trend in CNP. Local residents’ recognition of intrinsic benefits from conservation could provide an indication of the success of educational efforts on the part of DNPWC and partner organizations. Among the intrinsic benefits, respondents placed significant value on wild animals, suggesting that the presence of tourism affects local perceptions of wildlife. Exposure to tourists has been found to foster an appreciation for intrinsic conservation values (Stem et al. Reference Stem, Lassoie, Lee, Deshler and Schelhas2003). However, some wildlife conservation value may also be explained by religion (Heinen & Shrestha Reference Heinen and Shrestha2006).
Mitigation benefits were mentioned by only a few respondents. Despite the significant livelihood impacts of wildlife on crops and livestock, actions on the part of the Park management to mitigate damage to livelihoods are not recognized by the local people. In fact, the DNPWC does little to mitigate conflicts between wildlife and people. Farmers must carry out personal mitigation measures by constructing machans (watch towers) from where they protect crops by scaring wildlife at night. The Park does provide a compensation scheme to cover a portion of losses caused by wildlife, but the claim process is complicated and time consuming, requiring livelihood chores to be abandoned to complete and submit a claim. The amount received was often insufficient to cover the loss and, as a result, few villagers claimed for losses from wildlife. Crop loss has been increasing in frequency, which can be attributed to ineffective grassland management within the Park, increased quantity and quality of habitat outside the Park (from regeneration of and protection afforded to community forests), and successful wildlife conservation efforts (MFSC [Ministry for Forests and Soil Conservation] 2000; McLean & Stræde Reference McLean and Stræde2003; Heinen & Shrestha Reference Heinen and Shrestha2006). Some residents suggested erecting fences to surround the park and community forests to restrict wildlife movement; however, erecting fencing structures to prohibit access of large animals, such as elephants, is expensive, and often ineffective. (O'Connell-Rodwell et al. Reference O'Connell-Rodwell, Rodwell, Rice and Hart2000). Only 11% of the buffer zone population considered fences to be effective in preventing wildlife damage (MFSC 2000). Mitigation measures were one of the most frequently identified community needs (indicated by 46% of respondents). Given the widespread conflict with wildlife, improvements to mitigation measures surrounding CNP are necessary and would significantly contribute to improving local attitudes toward wildlife.
Participation was not recognized as a benefit from the Park. Under the traditional exclusionary park approach, active participation was not a consideration in the initial institutional design (Gbadegesin & Ayileka Reference Gbadegesin and Ayileka2000; Kapoor Reference Kapoor2001; Brown Reference Brown2002). Participation in CNP did not constitute active involvement or empowerment in Park resource management or decision making, and was limited to the consultation role provided for buffer zone management; it therefore provided few benefits. Some respondents did value the benefits provided by participation in community committees, such as provision for loans, and also recognized benefits from increased awareness of conservation issues owing to the Park agency's efforts in implementing local wildlife conservation education programmes.
Overall, the results suggest that the benefits from CNP are not distributed to account for losses resulting from protected wildlife or restrictions on access to resources. In fact, those suffering most from crop loss benefit least. Different levels of benefit receipt between villages account for this discrepancy between crop loss and benefits, and support the wide criticisms of IBPs in the literature in terms of the unfair distribution of benefits across large regional districts (Barrett & Arcese Reference Barrett and Arcese1995; Brandon Reference Brandon, Brandon, Redford and Sanderson1998). In contrast to GVs, DGVs experience the greatest costs associated with conservation, yet receive the least benefit from conservation. Within villages benefit distribution is equal, but not fair, as benefits are not preferentially targeted towards individuals bearing the most costs.
CONCLUSIONS
This paper has addressed the shortcomings of incentive-based conservation programmes, based on evidence from Nepal's Chitwan National Park. The establishment of the Park has strengthened conservation efforts, and incentives provided to local communities have improved relationships between the Park authority and local communities, yet we argue that IBPs can be made more effective if differences amongst the resident households and communities are considered in the delivery of incentives. Current IBPs have failed to take into consideration the discrepancy in costs borne by different households and communities. Incentives tend to be concentrated within specific villages (for example in villages closer to tourist attractions) and households not dependent on Park resources, and costs and benefits of conservation are therefore not shared equitably.
It has been argued that for IBPs to make meaningful contributions to conservation, benefits extended by a programme must address or alter the livelihood needs of local residents (Tisdell Reference Tisdell1999). The present study shows that most local residents in CNP perceived benefits from having the Park. However, for the majority of residents, the livelihood implications resulting from conservation remain unaddressed. While alternative energy sources have been promoted in the buffer zone, local people have remained dependent on natural resources for subsistence. So long as people continue to require resources to meet livelihood needs, no type of communal development benefit will suffice to alter extraction. Similarly, unless the losses from protected wildlife are directly offset by IBPs, people will continue to face personal hardships, and long-term support for conservation is therefore doubtful.
The suitability of tourism as an IBP is often criticized owing to the low benefits received at the local level, and the corresponding loss of income potential to outsiders (Honey Reference Honey1999; Tisdell Reference Tisdell1999; Walpole & Goodwin Reference Walpole and Goodwin2000; Goodwin & Roe Reference Goodwin and Roe2001; Hutton & Leader-Williams Reference Hutton and Leader-Williams2003; Sekhar Reference Sekhar2003). In order for IBPs to provide sufficient benefits to alter extractive behaviour, the retention of tourism revenue by the local communities needs to be maximized. The tourism industry in the buffer zone surrounding CNP has no formal mechanisms to avoid losses of revenue potential from the devaluation of products and services through competitive pricing. Using the existing committees established in the buffer zone, tourism needs to be regulated to prevent the unhealthy price competition currently common among hotel operators. IBPs need to encourage partnerships between local producers of goods and tourism service providers in order to integrate the local economy with the tourism industry and minimize the loss of revenue potential at the local level. This integration will also provide benefits on a more personal level, rather than the communal benefits typically extended by IBPs. Personal benefits will be better positioned to compensate individual victims of wildlife damages.
While this paper has provided an examination of the distribution of benefits recognized by local residents in the buffer zone of a national park, the real contributions to conservation made by such benefits and their ability to act as incentives can only be determined by comparing distribution with attitudes. Benefits extended by IBPs simply act as development projects, diverting funds for conservation, unless the benefits correspond with a genuine commitment to protecting natural resources. Such a commitment can only be achieved when local people receive sufficient benefits with a recognized connection to conservation. The true test of CNP's IBPs rests in the ability of benefits to conserve natural resources.
ACKNOWLEDGEMENTS
This study would not have been possible without funding provided by the Social Sciences and Humanities Research Council of Canada (Grant No. 410-2003-0136), research support from Damodar Khadka, Jeremy Mackenzie, Ray Chipeniuk and Gail Fondhal, field assistance from Shumita Chhaudhary and Bikram Chaudhari, and cooperation from the park staff and local residents. We thank Stella Nepal, for Fig. 1.