Introduction
High concentrations of nitrogen and phosphorus and low phytoplankton productivity are characteristic features of the Southern Ocean whose waters contain an estimated 0.500 mg N-NO3- dm-3 and 0.070 mgP reactive dm-3 - concentrations that do not inhibit the growth of phytoplankton (El-Sayed Reference El-Sayed and Holdgate1970, Konnov & Borodkin Reference Konnov, Borodkin, Klekowski and Opaliński1993, Atkinson & Whitehouse Reference Atkinson and Whitehouse2000). Of greater significance to primary production are the extreme environmental conditions of the Southern Ocean, in particular low water temperature, access to light and variable ice conditions (Kaufmann et al. Reference Kaufmann, Fisher, Walthus, King, Laubacher and Sullivan2003). These factors also limit primary production in the Antarctic waters of the Bransfield Strait, in which high concentrations of biogenic salts have been reported (Sturz et al. Reference Sturz, Gray, Dykes, King and Radtke2003). Similar high concentrations of nitrogen were reported by Samp (Reference Samp1980), Ballester et al. (Reference Ballester, Rovira, Castellvi, Julia and Castellvi1987) and Lipski (Reference Lipski1987) from the waters of Admiralty Bay (an area of 122.08 km2, 24.24 km3, mean depth 201.7 m and shoreline length 83.4 km). The drainage basin of the bay covers c. 361 km2, making this the largest inlet on King George Island and indeed anywhere in the South Shetland Islands. Admiralty Bay is fjord-like in nature and opens widely on to the south-facing Bransfield Strait (Anon 1985, Battke Reference Battke1990).
There are numerous sources of organic matter and biogenic compounds in the bay, including runoff of freshwater enriched with guano and the decay of the remains of macroalgae, either present in the water or cast up on the shore (Zieliński Reference Zieliński1981, Reference Zieliński1990, Juchnowicz-Bierbasz & Rakusa-Suszczewski Reference Juchnowicz-Bierbasz and Rakusa-Suszczewski2002, Nędzarek & Rakusa-Suszczewski Reference Nędzarek and Rakusa-Suszczewski2004). These and other factors ensure that the availability of nitrogen and phosphorus in the waters of Admiralty Bay is greater than that in the open waters around Antarctica. Phytoplankton in Admiralty Bay shows annual fluctuations in chlorophyll a content from 0.1 to 3.8 mg m-3 (average 0.5 mg m-3) (Biggs Reference Biggs1982, Bojanowski Reference Bojanowski1984, Lipski Reference Lipski1987, Rakusa-Suszczewski Reference Rakusa-Suszczewski1995) but average values for primary production are lower here than in the open waters around the South Shetland Islands, with the average concentration of chlorophyll a in Bransfield Strait waters being 1–2 mg m-3, for example (Figueiras et al. Reference Figueiras, Estrada, Lopez and Arbones1998, Castro et al. Reference Castro, Rios, Doval and Perez2002). The low primary production in Admiralty Bay reflects the limited stability of its waters and intensive vertical mixing (Szafrański & Lipski Reference Szafrański and Lipski1982, Bodungen et al. Reference Bodungen, Smetacek, Tilzer and Zietzchel1986, Lipski Reference Lipski1987, Lipski & Rakusa-Suszczewski Reference Lipski and Rakusa-Suszczewski1990, Kopczyńska Reference Kopczyńska1993). A significant role is also played by light conditions in the waters of the bay, the amount of suspended sediment flowing in from inland waters, and the low temperatures in the water column (Pęcherzewski Reference Pęcherzewski1980, Szafrański & Lipski Reference Szafrański and Lipski1982, Woźniak et al. 1984, Gurgul et al. Reference Gurgul, Stochmal, Szymczak and Rakusa-Suszczewski1992).
This paper provides data on: i) the spatial and seasonal variability of nitrogen and phosphorus concentrations in the surface layer of Admiralty Bay, ii) the effect of various sources of biogenic compounds, including those from the surface runoff of inland freshwater, from the decay of organic matter deposited in the waters of the bay and in relation to excretion and secretion by macrozoobenthos, iii) the role of the wind in the circulation of N and P between the waters of the bay and the surrounding land, and iv) the effect of the exchange of water between Admiralty Bay and the Bransfield Strait.
Methods
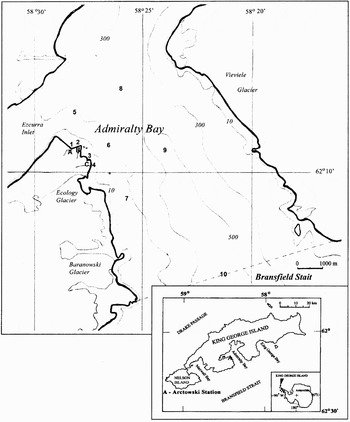
The studies were carried out at Poland's Arctowski Station in 2001 and 2005. Waters from Admiralty Bay were sampled at 1 m below the surface water at 10 sites (Fig. 1, sites 1–10) every two weeks in summer (January–March 2001 and November–December 2001) and once a month in winter (April–October 2001). Freshwater streams were sampled in summer at the same time as the seawater was sampled from Admiralty Bay. The outlet sections of three streams near Arctowski Station (Fig. 1, sites A, B, C) were analysed. Site A is at Petrified Forest Creek, an area not directly affected by the penguin colony, site B the watercourse in the vicinity of Shag Point (with surface runoff from the Adélie penguin colony), and site C is Ornithologists' Creek, (with surface runoff from the colony of Adélie and gentoo penguins plus giant petrels).
Map of the central basin of Admiralty Bay, King George Island, showing sites of water sampling from Admiralty Bay (sites 1–10) and from freshwater watercourses (sites A = Petrified Forest Creek, B = watercourse in Shag Point area, C = Ornithologists Creek).

To estimate the amounts of nitrogen and phosphorus excreted by the marine fauna, laboratory experiments on the in vivo release of these compounds by fish and macrozoobenthos were carried out. Experimental studies carried out in 2005 used:
- fish: Notothenia coriiceps Richardson - in one container six fish weighing on average 1.3 kg ind-1, Notothenia rossii Richardson - in one container six fish weighing on average 0.333 kg ind-1,
- amphipods: Waldeckia obesa (Chevreux) - three aquaria in each of which 100 g of amphipods were placed,
- starfish: Odontaster validus (Koehler) - two aquaria, in each of which six starfish of average mass 19.2 g ind-1 were placed,
- isopods: Glyptonotus antarcticus (Eights) - in one aquarium six gliptonotus of average mass 23.3 g ind-1 were placed,
- snails: Nacella concinna (Strebel) - in two aquaria, in each of which 20 snails of average mass 5.5 g ind-1 were placed,
- sea urchins: Sterechinus neumayeri (Meissner) - in three aquaria, in each of which six sea urchins of average mass 26 g ind-1 were placed.
In the experiment a constant volume of seawater per mass of animals was used (10 dm3 of water to each 100 g of mass), and during the whole experiment the water was aerated, its temperature kept at 0°C and six hours of light was supplied. The determination of nitrogen and phosphorus concentrations was made 24 hours after the animals were placed in the aquarium.
The samples were then assayed for mineral species of nitrogen (nitrite, nitrate, and ammonia), total nitrogen, reactive phosphorus, and total phosphorus (Grasshoff Reference Grasshoff1976 and APHA 1995). Using a CARL ZEISS SPECOL-1100 spectrophotometer N-NO2- was assayed with sulphanyl acid at 543 nm. N-NO3- was determined after reduction to nitrites on a Cu-Cd column. N-NH4+ was assayed with indophenol blue at 630 nm. Total nitrogen was determined, as nitrates, after mineralization with potassium hypersulphate. Organic nitrogen content was calculated as the difference between total nitrogen and mineral nitrogen (sum of nitrite, nitrate, and ammonium nitrogen contents). Availabilities of nitrogenous nutrients (N-NH4+ Av) are defined as their percentage in the total dissolved mineral pool. Reactive phosphorus was assayed using the molybdenate technique with ascorbic acid as a reducer at 882 nm. Total phosphorus, after mineralization with potassium hypersulphate, was assayed as reactive phosphorus. The difference between the two phosphorus species produced organic phosphorus. Statistical analyses used the Pearson linear regression (StatSoft 2005) at a significance level of 5%.
Results
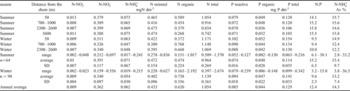
The hydrochemical studies carried out in Admiralty Bay throughout the year showed differences in nutrient concentrations between particular research sites and between seasons (Table I). N-NO3- was much higher than N-NH4+ and N-NO2- (average values of 0.362, 0.062 and 0.009 mgN dm-3, respectively). On average, within the annual cycle, organic nitrogen constituted 59% of total nitrogen. In the phosphorus pool, reactive phosphorus clearly dominated over organic phosphorus (annual averages of 0.085 and 0.044 dmP-3, respectively). On average, organic phosphorus constituted 34% of total phosphorus in an annual cycle.
Seasonal and spatial variability of nitrogen and phosphorus concentrations, Redfield's coefficient (N:P) and availability of nitrogen (N-NH4+Av) in the Admiralty Bay waters. The sites were grouped according to the distance from the shore: 50 m from the shore - sites 1, 2, 3, 4: 700–1000 m from the shore - sites 5, 6, 7; 2300 m from the shore - sites 8, 9; 3600 m - site 10 situated on the border of Admiralty Bay and Bransfield Strait.

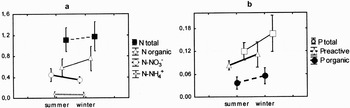
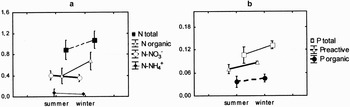
The seasonable variability in concentrations of biogenic compounds was repeated at each of the research sites with higher concentrations of nitrite-, nitrate-, ammonium- and total nitrogen were noted in the summer season, lower ones in winter. On average, the differences in concentrations of these biogenic compounds between the seasons were of 0.001, 0.051, 0.017 and 0.070 mgN dm-3 respectively. In contrast, in the cases of organic and total nitrogen, as well as reactive phosphorus, organic phosphorus and total phosphorus it was the winter concentrations that were highest. In the cases of these biogenic compounds, the respective mean inter-seasonal differences in concentrations were 0.264, 0.175, 0.020, 0.007 and 0.027 mgN or P dm-3 (Table I). Examples of the seasonal variabilities at the two sites most distant from each other are given in Figs 2 & 3. The N:P ratio (Nmineral:Preactive) was found to be higher in summer (at 15.2) and lower in winter (9.6) (Table I).
Seasonal differences in concentrations of biogenic compounds in the nearshore zone of Admiralty Bay, as these are subject to the direct influence of freshwater flowing in from the land, at Site 4 (A = selected forms of nitrogen, B = designated forms of phosphorus).

Seasonal differences in concentrations of biogenic compounds in the central part of Admiralty Bay, at Site 9 (A = selected forms of nitrogen, B = designated forms of phosphorus).

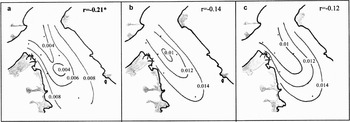
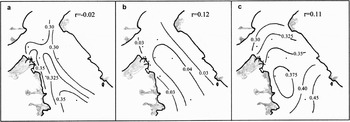
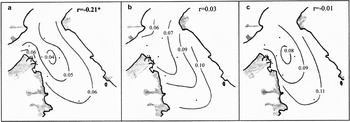
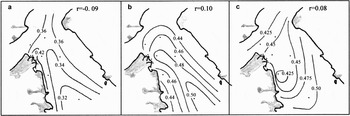
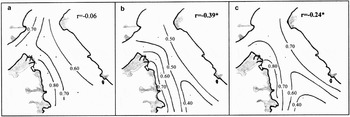
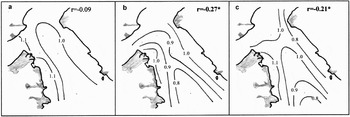
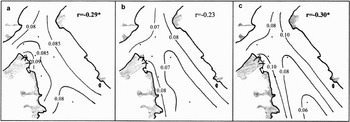
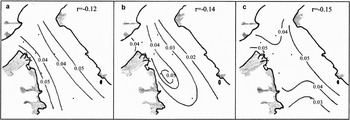
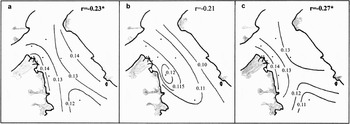
A characteristic trend towards higher concentrations of the analysed nutrients in the nearshore zone than in the open waters of Admiralty Bay was observed (Figs 4–12), while the significance of the relationships involved is confirmed by the correlation between concentrations of all of the biogenic compounds and distance from the shore. Statistical analysis mostly revealed inverse correlations for these relationships between concentrations and distances from the shore, and were significant for organic nitrogen (Fig. 8b) and total nitrogen (Fig. 9b) in summer, as well as N-NO2- (Fig. 4a), N-NH4+ (Fig. 6a), reactive phosphorus (Fig. 10a) and total phosphorus (Fig. 12a) in winter. For the annual cycle as a whole, the inverse correlation was significant for organic nitrogen (Fig. 8c), total nitrogen (Fig. 9c), reactive phosphorus (Fig. 10a) and total phosphorus (Fig. 12c). The trend revealed was not characteristic of nitrate-nitrogen only. In the summer and through the annual cycle as a whole, higher concentrations of nitrate-nitrogen were observed for the open waters of Admiralty Bay (Table I, Fig. 5).
Horizontal differentiation to concentration of nitrite-nitrogen [mgN dm-3] in surface layer of Admiralty Bay waters in a. winter, b. summer, and c. in a year-round.

Horizontal differentiation of the concentration of nitrate-nitrogen [mgN dm-3] in surface layer of Admiralty Bay waters in a. winter, b. summer, and c. in a year-round.

Horizontal differentiation of the concentration of ammonium-nitrogen [mgN dm-3] in surface layer of Admiralty Bay waters in a. winter, b. summer, and c. in a year-round.

Horizontal differentiation of the concentration of mineral-nitrogen [mgN dm-3] in surface layer of Admiralty Bay waters in a. winter, b. summer, and c. in a year-round.

Horizontal differentiation of the concentration of organic-nitrogen [mgN dm-3] in surface layer of Admiralty Bay waters in a. winter, b. summer, and c. in a year-round.

Horizontal differentiation of the concentration of total-nitrogen [mgN dm-3] in surface layer of Admiralty Bay waters in a. winter, b. summer, and c. in a year-round.

Horizontal differentiation of the concentration of reactive phosphorus [mgP dm-3] in surface layer of Admiralty Bay waters in a. winter, b. summer, and c. in a year-round.

Horizontal differentiation of the concentration of organic phosphorus [mgP dm-3] in surface layer of Admiralty Bay waters in a. winter, b. summer, and c. in a year-round.

Horizontal differentiation of the concentration of total phosphorus [mgP dm-3] in surface layer of Admiralty Bay waters in a. winter, b. summer, and c. in a year-round.

For the freshwater streams the lowest concentrations of nitrogen and phosphorus were observed in Petrified Forest Creek (site A), slightly higher concentrations in the watercourse flowing into the bay near Shag Point (site B), and the highest at Ornithologists Creek (site C) (Table II).
Average concentrations of nitrogen and phosphorus in waters of the streams flowing into Admiralty Bay in the vicinity of the H. Arctowski Station (A = Petrifield Forest Creek, B = water course in the Shag Point area, C = Ornithologists Creek).

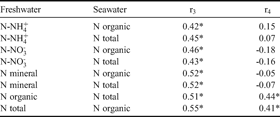
The statistical analysis for interrelationships between the same forms of nutrients at the different freshwater sites A, B and C and the near-shore water in the immediate vicinity of the streams (sites 1, 2 and 4) showed significant correlations for only nitrate-nitrogen, organic nitrogen and total nitrogen (Table III). Interestingly there were significant positive interrelationships (r3) between the different forms of nitrogen determined for the freshwater (sites A, B, C) and the marine waters of the seashore zone (sites 1, 2 and 4), but a lack of such correlations (r4) for most of the forms of nitrogen in the cases of the concentrations recorded in the freshwater (sites A, B, C) and in the open waters of the Bay (sites 8–10) (Table IV).
Pearson linear correlation coefficients for nitrogen and phosphorus concentrations compared between freshwater streams and in the nearshore zone (r1), as well as between freshwater streams and in open waters of Admiralty Bay (r2).

* = statistically significant correlations at P < 0.05
Pearson linear correlation coefficients for nitrogen concentrations found in freshwater and in nearshore zone (r3), and concentrations found in freshwater and in open waters of Admiralty Bay (r4).
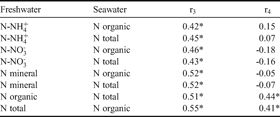
* = statistically significant correlations at P < 0.05
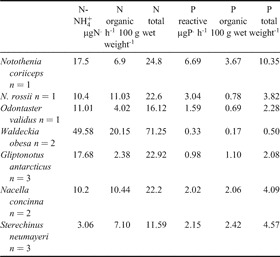
Excretion of nutrients by fish and macrozoobenthos varied depending on species. In the case of ammonium-nitrogen, the concentrations varied from 3.06–46.6 µg N 100 g-1of wet mass h-1. Much higher concentrations were observed for total nitrogen - from 11.6–71.3 µg N 100 g-1of wet mass h-1 (Table V). The concentrations of forms of phosphorus excreted by macrozoobenthos were lower, varying from 0.33–6.69 µg P 100 g-1of wet mass h-1 for reactive phosphorus and from 0.50–10.35 µg P 100 g-1 of wet mass h-1 for total phosphorus.
Excretion of nitrogen and phosphorus by selected marine species during 24 hours (n = number of repetitions).

Discussion
Earlier studies on nitrogen and phosphorus in Admiralty Bay focussed on the variability in concentrations of ammonium- and nitrate-nitrogen, as well as reactive phosphorus (Konnov & Borodkin Reference Konnov, Borodkin, Klekowski and Opaliński1993, Rakusa-Suszczewski Reference Rakusa-Suszczewski1995). The present study confirmed these earlier data and it can now be seen that the concentrations in question are characteristic of the western sector of the Southern Ocean (Goeyens et al. Reference Goeyens, Semeneh, Baumann, Elskens, Shopova and Dehairs1998, Figueiras et al. Reference Figueiras, Estrada, Lopez and Arbones1998, Sturz et al. Reference Sturz, Gray, Dykes, King and Radtke2003).
The Southern Ocean is a significant source of mineral salts and biogenic elements for the inland ecosystem of Antarctica. The transportation of mineral and organic matter from the sea to the land is mediated aerosols, and by the direct transfer by birds and mammals as they visit the land to breed. Most breeding colonies are located on the coast, are small in area, but represent a significant source of biogenic substances for terrestrial and marine ecosystems both in their immediate vicinity and for areas much further away. The amount of material brought ashore by birds constitutes a continuous source of nitrogen and phosphorus, including over the periods in which the breeding colonies have been seasonally abandoned. Of particular significance is wind transport of mineral salts over considerable distances inland. The wind also carries the microspores and plant seeds colonizing land that is newly exposed following the retreat of ice cover (Legrand et al. Reference Legrand, Ducroz, Wagenbach, Mulvaney and Hall1998, Fahnestock et al. Reference Fahnestock, Povirk and Welker2000, Aristarain & Delmas Reference Aristarain and Delmas2002, Suzuki et al. Reference Suzuki, Iizuka, Matsuoka, Furukawa, Kamiyama and Watanabe2002, Bertler et al. Reference Bertler2005, Fattori et al. Reference Fattori, Becagli, Bellandi, Castellano, Innocenti, Mannini, Severi, Vitale and Udisti2005). Such a process of succession is observed along the western shore of Admiralty Bay, where deglaciation has now been progressing for 30 years (the ice free area increasing in the period from 21–38 km2, Braun et al. Reference Braun, Simoes, Vogt, Bremer, Blindow, Pfender, Saurer, Aquino and Ferron2001). As such newly-exposed areas are poor in nitrogen and phosphorus, atmospheric precipitation constitutes an important source of biogenic salts. The precipitation in the area of the H. Arctowski Polish Antarctic Station is estimated to be 505 mm a year and is enriched in mineral salts, as well as nitrogen and phosphorus in the shore zone. The mineral and biogenic salts are then carried inland by the wind (Rakusa-Suszczewski Reference Rakusa-Suszczewski1995, Juchnowicz-Bierbasz & Rakusa-Suszczewski Reference Juchnowicz-Bierbasz and Rakusa-Suszczewski2002). Nędzarek & Rakusa-Suszczewski (unpublished) show that, on average, precipitation in an area about 3000 m distant from the seashore contains 0.208 mgN dm-3 of total nitrogen and 0.028 mgP dm-3 of total phosphorus. The authors estimate that annual loads of nitrogen and phosphorus deposited inland by means of precipitation could be as high as 0.752 kgN ha-1 and 0.061 kgP ha-1. They also determined that the amounts of mineral salts carried on to the land by the wind are directly proportional to the wind speed. Such relationships were not found for nitrogen and phosphorous, so that the main source of biogenic compounds in the case of precipitation must be the rookeries, rather than marine water carried by the wind in aerosol form or via oceanic evaporation.
Surface runoff of freshwater and mineral suspension affects the hydrological and hydro-optical conditions of Admiralty Bay. The runoff of freshwater from the land causes changes in salinity from 16.4 PSU in the nearshore zone to 34.2 PSU in the central part of the bay, while suspended mineral matter falls from 44.1–12.4 mg dm-3 (Pęcherzewski Reference Pęcherzewski1980, Szafrański & Lipski Reference Szafrański and Lipski1982). As Lipski (Reference Lipski1987) reported, the presence of this suspension is the main factor limiting the transparency of water.
Surface runoff to Admiralty Bay carried, not only the mineral suspension, but also nutrient salts washed out by precipitation from the guano birds deposit on the land. The main breeding colonies of penguins are located along the western shore, the amount of guano deposited during 24 hours in the region of the colony being an estimated c. 10 kg dry mass m-2 (Samp Reference Samp1980, Tatur & Myrcha Reference Tatur and Myrcha1984, Ballester et al. Reference Ballester, Rovira, Castellvi, Julia and Castellvi1987, Trivelpiece et al. Reference Trivelpiece, Trivelpeice and Volkman1987, Juchnowicz-Bierbasz & Rakusa-Suszczewski Reference Juchnowicz-Bierbasz and Rakusa-Suszczewski2002). The influx of salts from this source can result in an increase in the fertility of the nearshore zone and also the central part of the bay (Figs 4–12). Nearshore waters have higher concentrations of particular forms of nitrogen and phosphorus than the central part of the bay. Such differences in concentrations reflected that the surface runoff of freshwater is richer in biogenic substances than seawater. The fact that concentrations of biogenic compounds in the nearshore zone are modified by the influx of freshwater is confirmed by statistical analysis of the relationship between the concentrations of the different forms of N and P determined for fresh and marine waters (Table III). In general, there are directly proportional interrelationships between the concentrations of nutrients in the waters of the streams flowing into Admiralty Bay (sites A, B and C) and those in the waters of the nearshore zone thereof (sites 1, 2 and 4) and its open waters (sites 8–10) (Table III).
A further noteworthy feature of the cycling of biogenic elements between fresh and marine waters in the nearshore zone of Admiralty Bay is the rise in the concentration of organic nitrogen with a simultaneous drop in concentrations of ammonium-nitrogen (Table IV). An inverse correlation in the case of ammonium-nitrogen for the interrelationship between fresh and marine waters (r1 = -0.08) (Table III), as well as the high positive correlation between ammonium-nitrogen in the freshwater and organic nitrogen and total nitrogen in the marine water (r3 = 0.42 and r3 = 0.45, respectively) (Table IV) indicates a rapid uptake of ammonium-nitrogen by autotrophs. Numerous studies on seasonal concentrations of ammonium as observed against the background of changes in concentrations of chlorophyll illustrate the way in which autotrophs make use of ammonium-nitrogen first, and then nitrates and nitrites (Clarke & Leakey Reference Clarke and Leakey1996, Goeyens et al. Reference Goeyens, Semeneh, Baumann, Elskens, Shopova and Dehairs1998). The utilisation of ammonium-nitrogen by autotrophs is also depicted in Fig. 6. While it is true that the nearshore waters were only very slightly richer in this form of nitrogen (in association with the surface runoff), its use by autotrophs in this zone took place relatively rapidly, probably ensuring that statistically-significant differences as regards the relationship between ammonium-nitrogen concentrations and distances from the shore were not noted in the summer period (Fig. 6b), while they were present in the winter season (Fig. 6a).
Higher concentrations of nitrogen and phosphorus in the nearshore zone also result from the decay of organic matter derived from macroalgae. About 30% of the Admiralty Bay bottom is covered with macroalgae with an estimated biomass of 74 000 tonnes (Zieliński Reference Zieliński1990). According to Zieliński (Reference Zieliński1981) c. 279 t by dry mass of partly decayed macroalgal matter is deposited along the whole coast of Admiralty Bay. Taking into consideration this biomass of macroalgae and the concentrations of total nitrogen and total phosphorus released into the water from its remains in the course of 24-hour water extraction (7.4 mgN h-1 100 g of dry mass-1 and 6.3 mgP h-1 100 g of dry mass-1, respectively; according to Nędzarek & Rakusa-Suszczewski Reference Nędzarek and Rakusa-Suszczewski2004), it can be estimated that the daily release into the water for this algae is c. 495 kg of total nitrogen and c. 421 kg of total phosphorus. Much larger loads of nutrients will be released from fresh remains of macroalgae. However, their biomass has not been assessed. Nędzarek & Rakusa-Suszczewski (Reference Nędzarek and Rakusa-Suszczewski2004) report that fresh remains of macroalgae release 92 mgN h-1 100 g of dry mass-1 and 154 mgP h-1 100 g of dry mass-1 (averages for 10 species of macroalgae). Taking into consideration the same biomass as in the case of the already partly decayed remains of macroalgae deposited along the whole coast, the load of total nitrogen and total phosphorus can be estimated at c. 6.2 t N d-1and 10.3 t P d-1.
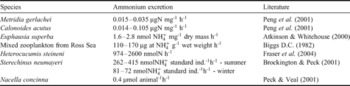
Another source of nitrogen and phosphorus is through excretion by fish and macrozoobenthos (Tables V & VI). Brockington & Peck (Reference Brockington and Peck2001) and Fraser et al. (Reference Fraser, Peck and Clarke2004) showed that the release of nitrogen is higher in summer and lower in winter. Clarke & Leakey (Reference Clarke and Leakey1996) report that the release of ammonia by Nacella concinna is an estimated 210 µmol m-2 d-1. At the same time, bottom deposits are shown to be an important source of ammonia, whose summer emission amounts to 319 µmol m-2 d-1 and is comparable to that found for mid-latitudes. The biomass of fish in Admiralty Bay is estimated at about 50 t (Rakusa-Suszczewski Reference Rakusa-Suszczewski1995), Notothenia coriiceps being a dominant species, in terms of both abundance and biomass (Barrera-Oro et al. Reference Barrera-Oro, Marschoff and Casaux2000). On the basis of the above assumptions it was estimated that the 24-hour loads of nitrogen and phosphorus released by fish can amount to about 0.3 kgN d-1 and 0.12 kgP d-1. Whereas the biomass of macrozoobenthos is an estimated 70 000 tonnes (Jazdżewski et al. Reference Jazdżewski, Jurasz, Kitel, Presler and Siciński1986), assuming that the average release of nutrients from the five species tested was 28.8 µgN total h-1 100 g wet mass-1 and 2.7 µgP total h-1 100 g wet mass-1, the 24-hour load of total nitrogen and total phosphorus could be estimated at about 482 kgN d-1 and 48 kgP d-1.
Concentrations of N-NH4+ by marine organisms previously reported.

The waters of Admiralty Bay are dynamically exchanged with the waters of the Bransfield Strait. Catewicz (Reference Catewicz1984) measured the principal currents driving this but was unable to note any correlation between the surface currents in the bay and wind speed and direction, as well as a close relationship between surface currents and the flow period, which is of half-day duration and of the mixed type (Catewicz & Kowalik 1984). A current is present in the northern part of the Bransfield Strait, running north-east in the surface layer, albeit with a rotation in a northerly direction at greater depths. The main current flowing out of the Bransfield Strait into the bay heads through its central part and along its eastern shore (Pruszak Reference Pruszak1980, Catewicz Reference Catewicz1984, Catewicz & Kowalik 1984, Lopez et al. Reference Lopez, Garcia and Arcilla1994) with a maximum speed of 105 cm s-1. This water from the Bransfield Strait shows a distinct stream of lower concentrations of total and organic nitrogen (Figs 8 & 9), whilst all the determined forms of phosphorus (Figs 10–12) probably also relate to the influx of the waters from the Strait. However, the nearshore zone and central part of the Admiralty Bay basin has higher concentrations of nitrogen and phosphorus. This pattern remained in place throughout the year.
The water from the Bransfield Strait enriched Admiralty Bay with nitrate-nitrogen (Fig. 5). Whilst the reverse trend was observed in the case of ammonium-nitrogen (Fig. 6). However, Admiralty Bay could supply Bransfield Strait with ammonium-nitrogen. This can be confirmed by the computed coefficient for the availability of nitrogen (N-NH4+ Av) (Table I). As Goeyens et al. (Reference Goeyens, Semeneh, Baumann, Elskens, Shopova and Dehairs1998) report, the availability of ammonium-nitrogen in the overall amount of mineral nitrogen is on average equal to 1.3–1.7%, maximally 7.55%. In the present studies, the availability of ammonium-nitrogen was greater on average (14%), and at the same time greater in summer (15.5%) and lower in winter (12.8%) (Table I). The observed decrease in the coefficient of availability of ammonium-nitrogen could be related to intensive uptake by picophytoplankton and phytobenthos after the failure of a diatom bloom resulting in improved light conditions (Gilbert Reference Gilbert1991). The lower value for the availability of ammonium-nitrogen could also reflect a limitation in supply via freshwater inputs from the land in winter, as well as a slowing of the decay of organic matter in the zone of tides and an intensification of nitrification (Clarke & Leakey Reference Clarke and Leakey1996).
The process of nitrification might also have represented a source of nitrate-nitrogen for the waters of Admiralty Bay (Figs 2a & 3a). In summer, both the reduction of organic matter containing organic nitrogen and the process by which reduced forms of nitrogen are oxidized proceeded more rapidly (lower concentrations of organic nitrogen, higher concentrations of nitrate-nitrogen). Winter in turn brought an increase in concentrations of organic and total nitrogen, while there was a decline in the concentration of nitrate-nitrogen brought about by a slowing of nitrification rates (obviously limited by low water temperatures). Year-round variability of concentrations was also noted in the case of the phosphorus types. Resources of both reactive and organic phosphorus were higher in winter than in the summer period, when the uptake of reactive phosphorus and the breakdown of organic matter containing phosphorus proceeded more intensively (Figs 2b & 3b).
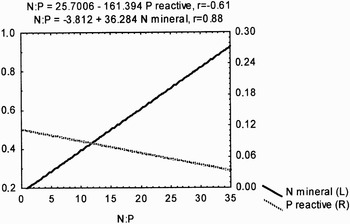
The availabilities of N and P act as major controls on primary production. If the N:P ratio (Redfield coefficient) falls within the range 10 to 20, then both elements may limit primary production in parallel (Guildford & Heckey Reference Guildford and Heckey2000, Rabalais Reference Rabalais2002). The values for the Redfield coefficient in Admiralty Bay were close to, or just slightly lower than, the classical Redfield coefficient equal to 16 (Redfield et al. Reference Redfield, Ketchum, Richards and Hill1963). Such a relationship may indicate that the two elements limit primary production simultaneously, as was shown for the waters of Borge Bay (on Signy Island) by Clarke & Leakey (Reference Clarke and Leakey1996). On the other hand, in the Bransfield Strait, the rather low N:P ratio reflects preferential P-assimilation in relation to nitrogen for Antarctic phytoplankton (Castro et al. Reference Castro, Rios, Doval and Perez2002). Statistical analysis points to proportionality in the relationship between the Redfield coefficient and the availability of mineral nitrogen (r = 0.88), as well as to an inverse relationship with reactive phosphorus (r = -0.61) (Fig. 13). Thus nitrogen availability may not be having a significant impact in limiting primary production whilst phosphorus may well be - something that was also reported for the waters of the Bransfield Strait by Castro et al. (Reference Castro, Rios, Doval and Perez2002).
Relationship between the Redfield Coefficient and the mineral nitrogen and reactive phosphorus concentrations in the waters of Admiralty Bay, as well as the coefficient of linear regression and statistically significant correlation coefficients.

As in Arctic conditions, significant limiting factors in the waters of Admiralty Bay could be light conditions and temperature (Clarke & Leakey Reference Clarke and Leakey1996, Goeyens et al. Reference Goeyens, Semeneh, Baumann, Elskens, Shopova and Dehairs1998, Figueiras & Arbones Reference Figueiras and Arbones1999, Kaufmann et al. Reference Kaufmann, Fisher, Walthus, King, Laubacher and Sullivan2003). As Wożniak et al. report (Reference Wożniak, Hapter and Maj1984), major fluctuations in primary production in Admiralty Bay are caused by considerable variability in light levels, depending on the day and season of the year. It is also possible that the inhibition of primary production is caused by UV-B radiation related to a small amount of yellow substances in the water (Gurgul et al. Reference Gurgul, Stochmal, Szymczak and Rakusa-Suszczewski1992).
Summary
The hydrochemical studies carried out on the waters of Admiralty Bay show that the determined concentrations of nitrogen and phosphorus were high and typical of the western sector of the Southern Ocean. At the same time, the waters of the bay are also characterized by a higher coefficient for available ammonium-nitrogen. The value noted for the Redfield coefficient points to preferential assimilation in relation to the availability of phosphorus as set against that of nitrogen. Both field based and laboratory research points to the main sources of nitrogen and phosphorus in the waters of the bay being the runoff from the land of freshwater enriched in biogenic compounds from the penguin rookeries, as well as the decomposition of macroalgae ongoing in the inflow zone and (to a limited degree only) excretion by fish and the macrozoobenthos. The noted spatial differentiation in concentrations of biogenic compounds (higher concentrations of N and P in the nearshore zone and in the central basin of Admiralty Bay, as well as a decline in concentrations in the direction of the Bransfield Strait) reflects the mutual multidirectional interactions between the land, “internal” sources of biogenic compounds and exchanges of water between Admiralty Bay and the Bransfield Strait.
Acknowledgements
I am most grateful to Dr Agnieszka Tórz, and to Prof Stanisław Rakusa-Suszczewski for assistance in preparing this manuscript, as well as to the anonymous reviewers for their valuable comments.