


During the 2024 presidential campaign, Donald Trump questioned Kamala Harris’s racial identity before a room of Black journalists. Describing Harris, a graduate of a historically Black university who has consistently identified as both Black and South Asian, Trump remarked, “I didn’t know she was Black until a number of years ago, when she happened to turn Black, and now, she wants to be known as Black. So, I don’t know, is she Indian or is she Black?”
Trump’s insinuation that Harris’s Black identity was opportunistic was widely viewed as an effort to weaponize racial authenticity for political gain and to undermine her support among Black voters.Footnote 1 The episode, however, did more than provoke controversy. It drew attention to how racial group boundaries are contested in American life, particularly when it comes to blackness (Hannah-Jones Reference Hannah-Jones2024).Footnote 2 It also raised a question that has long animated social and political conversations about race in this country: Who counts as Black in American society today?
This question reflects a basic reality that racial boundaries are not fixed. They are the product of social and political judgment and vary across contexts and historical moments (Omi and Winant Reference Omi and Winant1994). Commentary on Kamala Harris’s blackness—and before her, Barack Obama’s—illustrates this point. So do ordinary conversations about race, which reflect a public understanding of racial identity as something evaluated through judgments of prototypicality, authenticity, and belonging, rather than determined solely by ancestry (Citrin, Levy, and van Houweling Reference Citrin, Levy and van Houweling2014; Lemi Reference Lemi2021).
Although constructivist approaches to race and identity have long dominated the social sciences, much of American politics research continues to treat racial categories as fixed, with scholarship focused primarily on the effects of race on political behavior and outcomes (Egan Reference Egan2020) and far less attention to the construction of the category itself. This approach has yielded important insights, but it leaves unanswered basic questions about how racial categories are understood and applied in everyday life. We know far less, for example, about how people weigh visible traits or ancestry against politically meaningful cues when deciding how to classify someone racially or how classifiers’ own racial identities inform these judgments.
This study takes up these questions by treating racial classification not as an abstract or static phenomenon but as an everyday social and political practice (Nobles Reference Nobles2000). In particular, we examine how the category “Black” is understood in the public imagination by focusing on how people judge who counts as Black.Footnote 3 We do so using a conjoint experiment that varies sociopolitical traits, including partisanship, neighborhood context, spousal race, and incarceration history. This approach brings into view a paradox at the heart of Black identity. Black Americans have long been categorized through the rigid rule of hypodescent, or “the one-drop rule,” a system designed to enforce binary racial boundaries in the service of maintaining political and social hierarchies (Davis Reference Davis2010). Yet the category “Black” has always been and continues to be dynamic and contested (Saperstein and Gullickson Reference Saperstein and Gullickson2013).Footnote 4
We make three contributions to the study of race and identity in American politics. First, unlike prior work, we examine how political identity directly informs racial classification. This extends research on race and partisanship (Agadjanian and Lacy Reference Agadjanian and Lacy2021; Egan Reference Egan2020) and scholarship showing how political forces shape the meanings attached to ethnoracial groups (Nagel Reference Nagel1995; Posner Reference Posner2004). It also clarifies how politics operates within a broad literature on racial classification that has largely overlooked it (Abascal et al. Reference Abascal, Armenta, Halm and Hopkins2025; Saperstein and Penner Reference Saperstein and Penner2012; Schachter, Flores, and Maghbouleh Reference Schachter, Flores and Maghbouleh2021).
Second, we move beyond a homogeneous racial sample to examine how different racial groups engage sociopolitical cues when classifying others. Much of what we know about racial classification comes from research focused exclusively on White respondents or from studies that exclude non-White participants altogether (for reviews, see Roberts et al. Reference Roberts, Bareket-Shavit, Dollins, Goldie and Mortenson2020 and Pauker et al. Reference Pauker, Meyers, Sanchez, Gaither and Young2018; though see Abascal et al. Reference Abascal, Armenta, Halm and Hopkins2025; Maghbouleh, Schachter, and Flores Reference Maghbouleh, Schachter and Flores2022; and Roberts, Bareket-Shavit, and Wang Reference Roberts, Bareket-Shavit and Wang2021). Other work has examined how Black Americans understand racial boundaries but primarily in the context of political behavior and community sanctioning, rather than racial classification per se (Cohen Reference Cohen1999). We build on this work by analyzing how Black and mixed-race respondents, alongside White respondents, understand blackness.
Third, we align measurement more closely with practice by operationalizing racial classification through multiple outcomes. Racial classification is not only a binary judgment. People are often seen as more or less prototypical of a racial category.Footnote 5 To capture this variation, we present respondents with three classification outcomes: a relative blackness measure, a categorical classification item (Black, White, or mixed-race), and a continuous blackness scale ranging from 0 to 10.
Although race is often understood as socially constructed, our findings show that some cues remain especially powerful: parentage overwhelmingly anchors racial classification across respondents, with skin tone also playing a central role. Yet these seemingly foundational markers do not fully determine how individuals are classified. Even when individuals are described as dark-skinned with two Black parents, those identified as Republican are rated as less Black than those identified as Democrat.
Racial perceptions also operate along multiple dimensions. Respondents evaluate traits in relation to one another, and judgments of blackness depend on how targets compare to others. At the same time, categorical boundaries remain rigid in important respects; notably, the label “White” remains largely unavailable to individuals with a Black parent. Finally, the boundaries of blackness vary by the race of the classifier: Black respondents are more likely than White respondents to categorize a wider range of profiles as Black, with partisan cues playing a larger role in their classifications (White and Laird Reference White and Laird2020).
Background, Theory, and Argument
Race in the United States has long been organized through a rule of descent (Cornell and Hartmann Reference Cornell and Hartmann1998). For Black Americans, this took the form of hypodescent, a legal and social system that classified anyone with discernible African ancestry as Black and served to expand the population subject to enslavement (Nobles Reference Nobles2000).Footnote 6 Yet the rule was never applied uniformly. Courts and state actors relied on phenotype, social standing, and labor status when deciding who counted as Black (Davis Reference Davis2010; Sharfstein Reference Sharfstein2007).Footnote 7 So even as the one-drop rule became hardened over time, the lived experience of blackness remained variable, with racial classifications shifting alongside changes in law, economic position, and social context (Saperstein and Gullickson Reference Saperstein and Gullickson2013). After the census permitted multiracial identification in 2000, for example, the share of Black-White children identified solely as Black declined (Lichter and Qian Reference Lichter and Qian2018).
This history makes clear that, even where ancestry carried legal significance, blackness was never determined by descent alone: racial classification has always required interpretation. Drawing on Omi and Winant’s (Reference Omi and Winant1994) account of race as a social process, we treat racial categories as produced not only through institutions and law but also through everyday encounters in which people interpret visible traits, social cues, and contextual information. In this framework, racial classification includes categorical assignment, but it is not exhausted by it and cannot be reduced to inherited characteristics alone. It also reflects cultural associations, situational cues, and other socially meaningful signals (Freeman and Ambady Reference Freeman and Ambady2011). Accordingly, in what follows, we outline how specific target traits and the race of the classifier may inform judgments about who counts as Black.
Target Traits
We draw on Foladare’s (Reference Foladare1969) distinction between ascribed and acquired traits to examine how respondents classify someone as Black. Ascribed traits are assigned at birth or taken on involuntarily and are difficult or impossible to change. In contrast, acquired traits develop over time and reflect social position, cultural expectations, and political signals.Footnote 8 Our interest is in how respondents weigh these different kinds of traits when forming judgments about racial classification. In this section, we outline our expectations for how these traits may inform the construction of the category “Black.”
Ascribed Traits
Parentage and skin tone function as central embodied cues of racial group membership (Burge, Wamble, and Cuomo Reference Burge, Wamble and Cuomo2020; Monk Reference Monk2014). Prior work shows that individuals with at least one Black parent are more likely to be categorized as Black or non-White (Ho et al. Reference Ho, Sidanius, Levin and Banaji2011) and that darker skin is more closely associated with blackness than lighter skin (Blair, Judd, and Chapleau Reference Blair, Judd and Chapleau2004). We therefore expect targets with one Black and one White parent to be classified as less Black than those with two Black parents, and light-skinned targets to be classified as less Black than otherwise comparable dark-skinned targets.
Acquired Traits
Acquired traits capture socially meaningful cues that may influence racial classification judgments beyond ancestry and phenotype.
Political Partisanship. Race in the United States is closely linked to political behavior and partisanship (Ostfeld and Yadon Reference Ostfeld and Yadon2022; Westwood and Peterson Reference Westwood and Peterson2022). This connection is especially pronounced among Black Americans, nearly 90% of whom identify with the Democratic Party. White and Laird (Reference White and Laird2020) argue that this pattern reflects “racialized social constraint,” a set of in-group norms enforced by fellow group members. Building on this work, we expect that Republican cues, relative to Democratic cues, reduce the perceived blackness of an otherwise comparable target.Footnote 9
Neighborhood Composition and Race of Spouse. People often draw on contextual cues when racially classifying others (Porter, Liebler, and Noon Reference Porter, Liebler and Noon2016). Marriage can also signal identity and group attachment. Because intermarriage is less common among Black Americans and is sometimes viewed as a departure from the group, and because neighborhood context can signal social distance or proximity to Black communities (Banks Reference Banks2011; Lacy Reference Lacy2007), we expect individuals living in racially mixed or predominantly White neighborhoods or with non-Black spouses to be classified as less Black than those in predominantly Black neighborhoods or with Black spouses.
Class. Black Americans are widely associated with lower economic status relative to White Americans (Dupree et al. Reference Dupree, Torrez, Obioha and Fiske2021), a link reinforced by media portrayals that disproportionately associate poverty with blackness (Gilens Reference Gilens1999). We therefore expect poorer targets to be seen as more strongly associated with blackness than wealthier targets.
Gender. Racial categories are gendered, and the category “Black” is often associated with masculine traits (Schug, Alt, and Klauer Reference Schug, Alt and Klauer2015). We therefore expect male targets to be more readily associated with blackness than comparable female targets.
Incarceration History and Experiences with Discrimination. Blackness is a stigmatized social category (Jefferson Reference Jefferson2023), and that stigma is reinforced through unequal exposure to discrimination and the criminal legal system (Muhammad Reference Muhammad2019). These status-linked outcomes can shape racial classification. Saperstein and Penner (Reference Saperstein and Penner2012), for example, show that incarceration is associated with a shift toward darker racial identification. We therefore expect that individuals with a history of incarceration or frequent experiences of discrimination to be classified as more Black than otherwise comparable individuals.Footnote 10
Categorizer Race
Racial classification depends not only on the characteristics of the target but also on those of the classifier (Ho, Kteily, and Chen Reference Ho, Kteily and Chen2017). Classifiers draw on different historical frames and social experiences when interpreting racial cues, including cues tied to ancestry. For Black Americans, the one-drop rule became a marker of in-group solidarity and may remain more salient than it is for White Americans. Moreover, research suggests that members of lower-status groups are less inclined to draw narrow boundaries around group membership (Kim Reference Kim1999). Black Americans may therefore adopt broader definitions of blackness that include non-prototypical members (Gaither et al. Reference Gaither, Pauker, Slepian and Sommers2016). We accordingly expect Black respondents to hold a more expansive view of who counts as Black than White respondents.
Mixed-race White-Black Americans may approach racial classification differently. Navigating multiple racial identities can complicate views of racial categories as fixed or mutually exclusive (Bonam and Shih Reference Bonam and Shih2009). We expect mixed-race respondents to approach classification with greater nuance and to be more likely to categorize targets with one Black and one White parent as mixed-race.
We advance no general expectations about how classifier race conditions the influence of most traits, with one exception: partisanship. Given strong intragroup norms linking Black identity with Democratic affiliation (White, Laird, and Allen Reference White, Laird and Allen2014), partisan cues may carry greater weight in Black respondents’ judgments than in those of White or mixed-race respondents (Ocampo-Roland Reference Ocampo-Roland2025).
Critically, even when classifiers rely on the same traits, those traits may carry different meanings. A cue that signals typicality for some respondents may raise questions about group membership for others. Partisanship provides one illustration. For White respondents, a Republican cue may simply mark a target as less typical of Black Americans, given the group’s strong Democratic alignment. For Black respondents, the same cue may carry more normative weight by calling into question the target’s cultural standing within the group. Our design allows us to observe these differences in reliance while recognizing that the interpretations underlying them may vary across groups.
Data and Methods
We developed a conjoint experiment in which racial classification was our outcome of interest. Conjoint designs allow researchers to estimate how respondents weigh multiple attributes simultaneously. In this context, the design enables us to disentangle how people evaluate observationally correlated traits, such as class background and partisanship, when deciding whether a profile should be understood as “Black.”Footnote 11
The survey was administered by Qualtrics Panels between December 2020 and February 2021.Footnote 12 The full sample includes 935 Black Americans, 962 White Americans, and 488 Black-White mixed-race Americans (Rendelman et al. Reference Rendleman, Jefferson and Davenport2026). Within-group quotas ensured balance on age and sex.Footnote 13 As with many online panels, the sample is somewhat more highly educated than the population, a point we return to later.
The survey began with a demographic inventory that included age, gender, race, ethnicity, parent race, homeownership, income, marital status, political ideology, and party identification. Respondents were then randomly sorted into one of two conditions. One group completed a series of randomly ordered questionnaires measuring additional respondent-level characteristics before proceeding to the conjoint experiment. The second group completed the conjoint first.
Respondents viewed one of four fully randomized conjoint designs using the attributes as summarized in table 1. To assess whether ancestry anchors racial classification, half of the respondents were shown a conjoint that excluded parentage. This design allowed us to examine how the absence of ancestry cues shapes racial classification judgments. To address potential order effects, skin tone appeared at the bottom of the attribute list for half of the respondents. In the analyses, we pooled respondents across designs and accounted for skin tone placement.Footnote 14
List of Traits Used in Conjoint Profiles

Table 1 Long description
The table consists of three columns: Category, Trait, and Trait Type.
* Parentage: Includes Two Black parents (baseline) and One Black parent, one White parent. Trait Type: Ascribed.
* Skin tone: Includes Dark-skinned (baseline) and Light-skinned. Trait Type: Ascribed.
* Party I D: Includes Democrat (baseline) and Republican. Trait Type: Acquired.
* Neighborhood: Includes Predominantly Black neighborhood (baseline), Neighborhood with equal numbers of Black and White people, and Predominantly White neighborhood. Trait Type: Acquired.
* Spouse: Includes Married with a Black spouse (baseline), Married with a Hispanic spouse, Married with a White spouse, Married with an Asian spouse, and Not married. Trait Type: Acquired.
* Gender: Includes Male (baseline) and Female. Trait Type: Acquired.
* Class background: Includes Poor (baseline), Middle-class, and Upper-class. Trait Type: Acquired.
* Incarceration history: Includes Yes, has been incarcerated (baseline) and No, has never been incarcerated. Trait Type: Acquired.
* Experience with discrimination: Includes Often (baseline), Rarely, and Sometimes. Trait Type: Acquired.
* We adopted a coarse measure of skin tone. More fine-grained approaches exist (Abrajano, Elmendorf, and Quinn Reference Abrajano, Elmendorf and Quinn2023; Ostfeld and Yadon Reference Ostfeld and Yadon2022) and may reveal additional nuance in how skin tone interacts with sociopolitical cues.
We intentionally omitted photographic images. Our goal was not to assess how respondents classify actual individuals or faces but to examine the schematic representations that guide racial classification when people evaluate profiles defined by demographic and sociopolitical traits. Text-only descriptions required respondents to rely on nonvisual cues, similar to audit designs (e.g., Bertrand and Mullainathan Reference Bertrand and Mullainathan2004). This approach allowed us to move beyond phenotypic cues often treated as markers of “objective” group membership (Huddy Reference Huddy, Huddy, Sears and Levy2013), while also providing greater researcher control and supporting tighter causal inference.Footnote 15
The conjoint instrument consists of five screens (Supplemental Information (SI) figure B.1 includes examples). On each screen, respondents evaluated paired profiles and were asked three questions designed to capture different dimensions of racial classification:
-
1. Relative race: “All things considered, which person would you most identify as Black?” (Person A or Person B)
-
2. Categorical race: “How would you identify Person [profile designator]?” (White, Black, or mixed-race)
-
3. Continuous race: “Regardless of your answer to the previous question, on a scale from 0 (not at all) to 10 (very), how strongly would you identify Person [profile designator] as Black?”
Respondents first viewed two side-by-side profiles and answered the relative race question. They were then shown the full attributes of one profile and asked the categorical and continuous questions. The same sequence followed for the second profile before respondents moved to the next screen.
A key strength of our design is the use of both paired-profile and single-profile tasks. The paired-profile task resembles real-world perceptions (Hainmueller and Hopkins Reference Hainmueller and Hopkins2015), but the forced choice raises the possibility that some respondents may view both profiles as equally Black—an option not available in binary tasks. Our multiple outcome measures address this limitation. The relative race measure captures classification in a comparative context; the categorical measure mirrors conventional race measures; and the continuous measure captures within-category variation in perceived “blackness.”
Although categorical race is the mode of classification most often used in bureaucratic and institutional settings, there is good reason to believe that relative and continuous measures capture meaningful social understandings of race. Categorical judgments may hinge more directly on ancestry cues, whereas relative and continuous judgments more naturally reflect the social and contextual signals people use in everyday racial perception. The continuous measure, in particular, aligns both with constructivist accounts that emphasize the fluid and internally differentiated nature of racial categories and with evidence that racial perception often operates through graded judgments of prototypicality and authenticity, rather than strict categorical boundaries (Monk Reference Monk2022; Omi and Winant Reference Omi and Winant1994). Using all three measures allows us to observe distinct but related facets of the classification process.Footnote 16
Because our study is designed to examine how respondents construct the category “Black,” we explicitly asked respondents to assess profiles in relation to blackness. Although such framing might appear to encourage respondents to search for markers of blackness, several features of our conjoint design mitigate this concern. First, the relative-choice task does not require respondents to identify who is Black, only who is more Black. Second, in the other tasks, respondents are free to classify profiles as White or mixed-race or to place them near zero on the blackness scale. Third, because all profile attributes are independently randomized, any increased attention that respondents may pay to race as a result of the task framing applies equally across attribute levels and therefore does not bias the relative causal estimates that are central to the conjoint design. As the results show, respondents routinely used the full range of available categories, indicating that the framing did not mechanically push them toward affirming blackness.
Results
Our baseline analyses examine the full sample and assess how profile characteristics shape perceptions of relative, categorical, and continuous race. We then leverage our diverse sample to examine whether White, Black, and Black-White mixed-race Americans construct the category “Black” in similar ways.
Relative Race
As a first pass at understanding how Americans perceive blackness, we estimate average marginal component effects (AMCEs), which capture the marginal effect of each attribute averaged over the joint distribution of the remaining attributes. Because attributes are independently randomized, AMCEs can be estimated simultaneously using linear regression without concern for confounding (Hainmueller, Hopkins, and Yamamoto Reference Hainmueller, Hopkins and Yamamoto2014). The AMCE has a straightforward causal interpretation: it reflects the degree to which an attribute increases or decreases the likelihood that a respondent selects a given profile as “more Black,” relative to the baseline categories listed in table 1.
The unit of analysis is the rated profile. The dependent variable equals 1 when a profile is identified as more Black in the relative-race question and 0 otherwise. Independent variables are indicators for each attribute. To account for the non-independence of responses from the same participant, we cluster standard errors by respondent and include a control for the location of the skin-tone attribute (top versus bottom of the screen).
Respondents were asked, “All things considered, which person would you most identify as Black?” Table 2, column 1 presents point estimates from the conjoint that included parentage information. As expected, ascribed characteristics—parentage and skin tone—are statistically significant and substantively strong determinants of perceived relative blackness. Compared to an otherwise identical profile with two Black parents, a profile with one Black parent and one White parent is 27.5 percentage points less likely to be identified as the more Black profile. Similarly, a light-skinned profile is 12.6 percentage points less likely to be identified as more Black than an otherwise identical dark-skinned profile.
Relative Race Results, Average Marginal Component Effects (AMCEs)

Table 2 Long description
The table presents results for the dependent variable: Effect on Pr(Profile identified as more Black) across two models, (1) and (2). All coefficients are negative, indicating a decreased probability compared to the reference group.
* Parentage (ref. Two Black parents): One Black parent, one White parent has an effect of minus 0.275 in model 1.
* Skin-Tone (ref. Dark-skinned): Light-skinned has an effect of minus 0.126 in model 1 and minus 0.196 in model 2.
* Party I D (ref. Democrat): Republican has an effect of minus 0.076 in model 1 and minus 0.079 in model 2.
* Neighborhood (ref. Predominantly Black): Neighborhood with equal numbers of Black and White people shows minus 0.028 in model 1 and minus 0.064 in model 2. Predominantly White neighborhood shows minus 0.058 in model 1 and minus 0.131 in model 2.
* Spouse (ref. Married with a Black spouse): Effects range from minus 0.044 for Not married to minus 0.086 for an Asian spouse in model 1, and minus 0.068 to minus 0.118 in model 2.
* Gender (ref. Male): Female shows minus 0.006 in model 1 and minus 0.017 in model 2 (not statistically significant).
* Class background (ref. Poor): Upper class shows minus 0.028 in model 1 and minus 0.023 in model 2.
* Incarceration history (ref. Yes): No history shows minus 0.005 in model 1 and minus 0.023 in model 2.
* Experience with discrimination (ref. Often): Rarely experiences discrimination shows minus 0.064 in model 1 and minus 0.132 in model 2.
Model statistics: Observations are 11,990 for model 1 and 11,876 for model 2. Both include skin-tone location controls. R-squared is 0.107 for model 1 and 0.077 for model 2. Standard errors are provided in parentheses below each coefficient.
Notes: Standard errors clustered by respondent in parentheses. Table F.1 presents results including skin-tone location controls. *p < 0.05; **p < 0.01 (two-tailed tests).
These results underscore the importance of ancestry and phenotype in Americans’ judgments about who is Black and are consistent with prior work (Schachter, Flores, and Maghbouleh Reference Schachter, Flores and Maghbouleh2021). Notably, however, these are not the only attributes that matter. Acquired traits also shape perceptions of relative blackness.
Partisanship is one such cue. Relative to profiles described as Democrats, profiles described as Republicans are 7.6 percentage points less likely to be identified as the more Black profile when parentage information is available (table 2, column 1). Residential and marital context also condition these judgments. Living in a racially mixed or predominantly White neighborhood—relative to a predominantly Black neighborhood—and having a non-Black spouse or being unmarried each reduce the likelihood that a profile is identified as more Black. These patterns suggest that residential and marital choices, in addition to their personal significance, influence how individuals are classified racially, all else equal.
Socioeconomic status matters as well. Compared to a profile described as poor, one described as upper class is 2.8 percentage points less likely to be identified as more Black. This pattern aligns with research showing that affluence can “whiten” racial perception (Davenport Reference Davenport2016; Schwartzman Reference Schwartzman2007). Importantly, this effect persists even when the analysis is restricted to profiles with two Black parents (SI section I), indicating that class operates independently of ancestry.Footnote 17
We observe a related pattern for stigmatized social experiences. In the conjoint that includes parentage, profiles described as rarely or sometimes experiencing discrimination are less likely to be identified as the more Black profile than those described as often experiencing discrimination.
What happens when information about racial parentage is absent? Table 2, column 2 reports results from the conjoint that omits parentage cues.Footnote 18 Respondents rely on a similar set of traits, but effect sizes increase. In the absence of ancestry information, stigmatized experiences become newly consequential or increase in importance. For example, profiles that rarely experience discrimination are 13.2 percentage points less likely to be identified as more Black than profiles that often experience discrimination; this difference is statistically significant in a formal interaction test assessing whether the absence of parentage cues moderates the effect of discrimination experiences (SI table F.4). This divergence suggests that when strong ancestry cues are unavailable, respondents rely more heavily on other signals when constructing blackness. Experiencing racial discrimination, in particular, appears to function as a marker of blackness in the public imagination.
It bears repeating that the findings we report for each attribute account for the presence of all other attributes, allowing for causal interpretation. To return to the partisanship example, observing “Republican” rather than “Democrat” leads respondents to identify an otherwise identical profile as less Black.Footnote 19
Given the unusual nature of asking respondents to select which profile appears “more Black,” one might worry that the task encouraged random or inattentive responding. If so, attribute estimates would be weak and statistically indistinguishable from zero. Instead, we observe clear and systematic variation across attributes. Although SI sections D and E provide additional data-quality checks, the main results already indicate that respondents engaged meaningfully with the task.
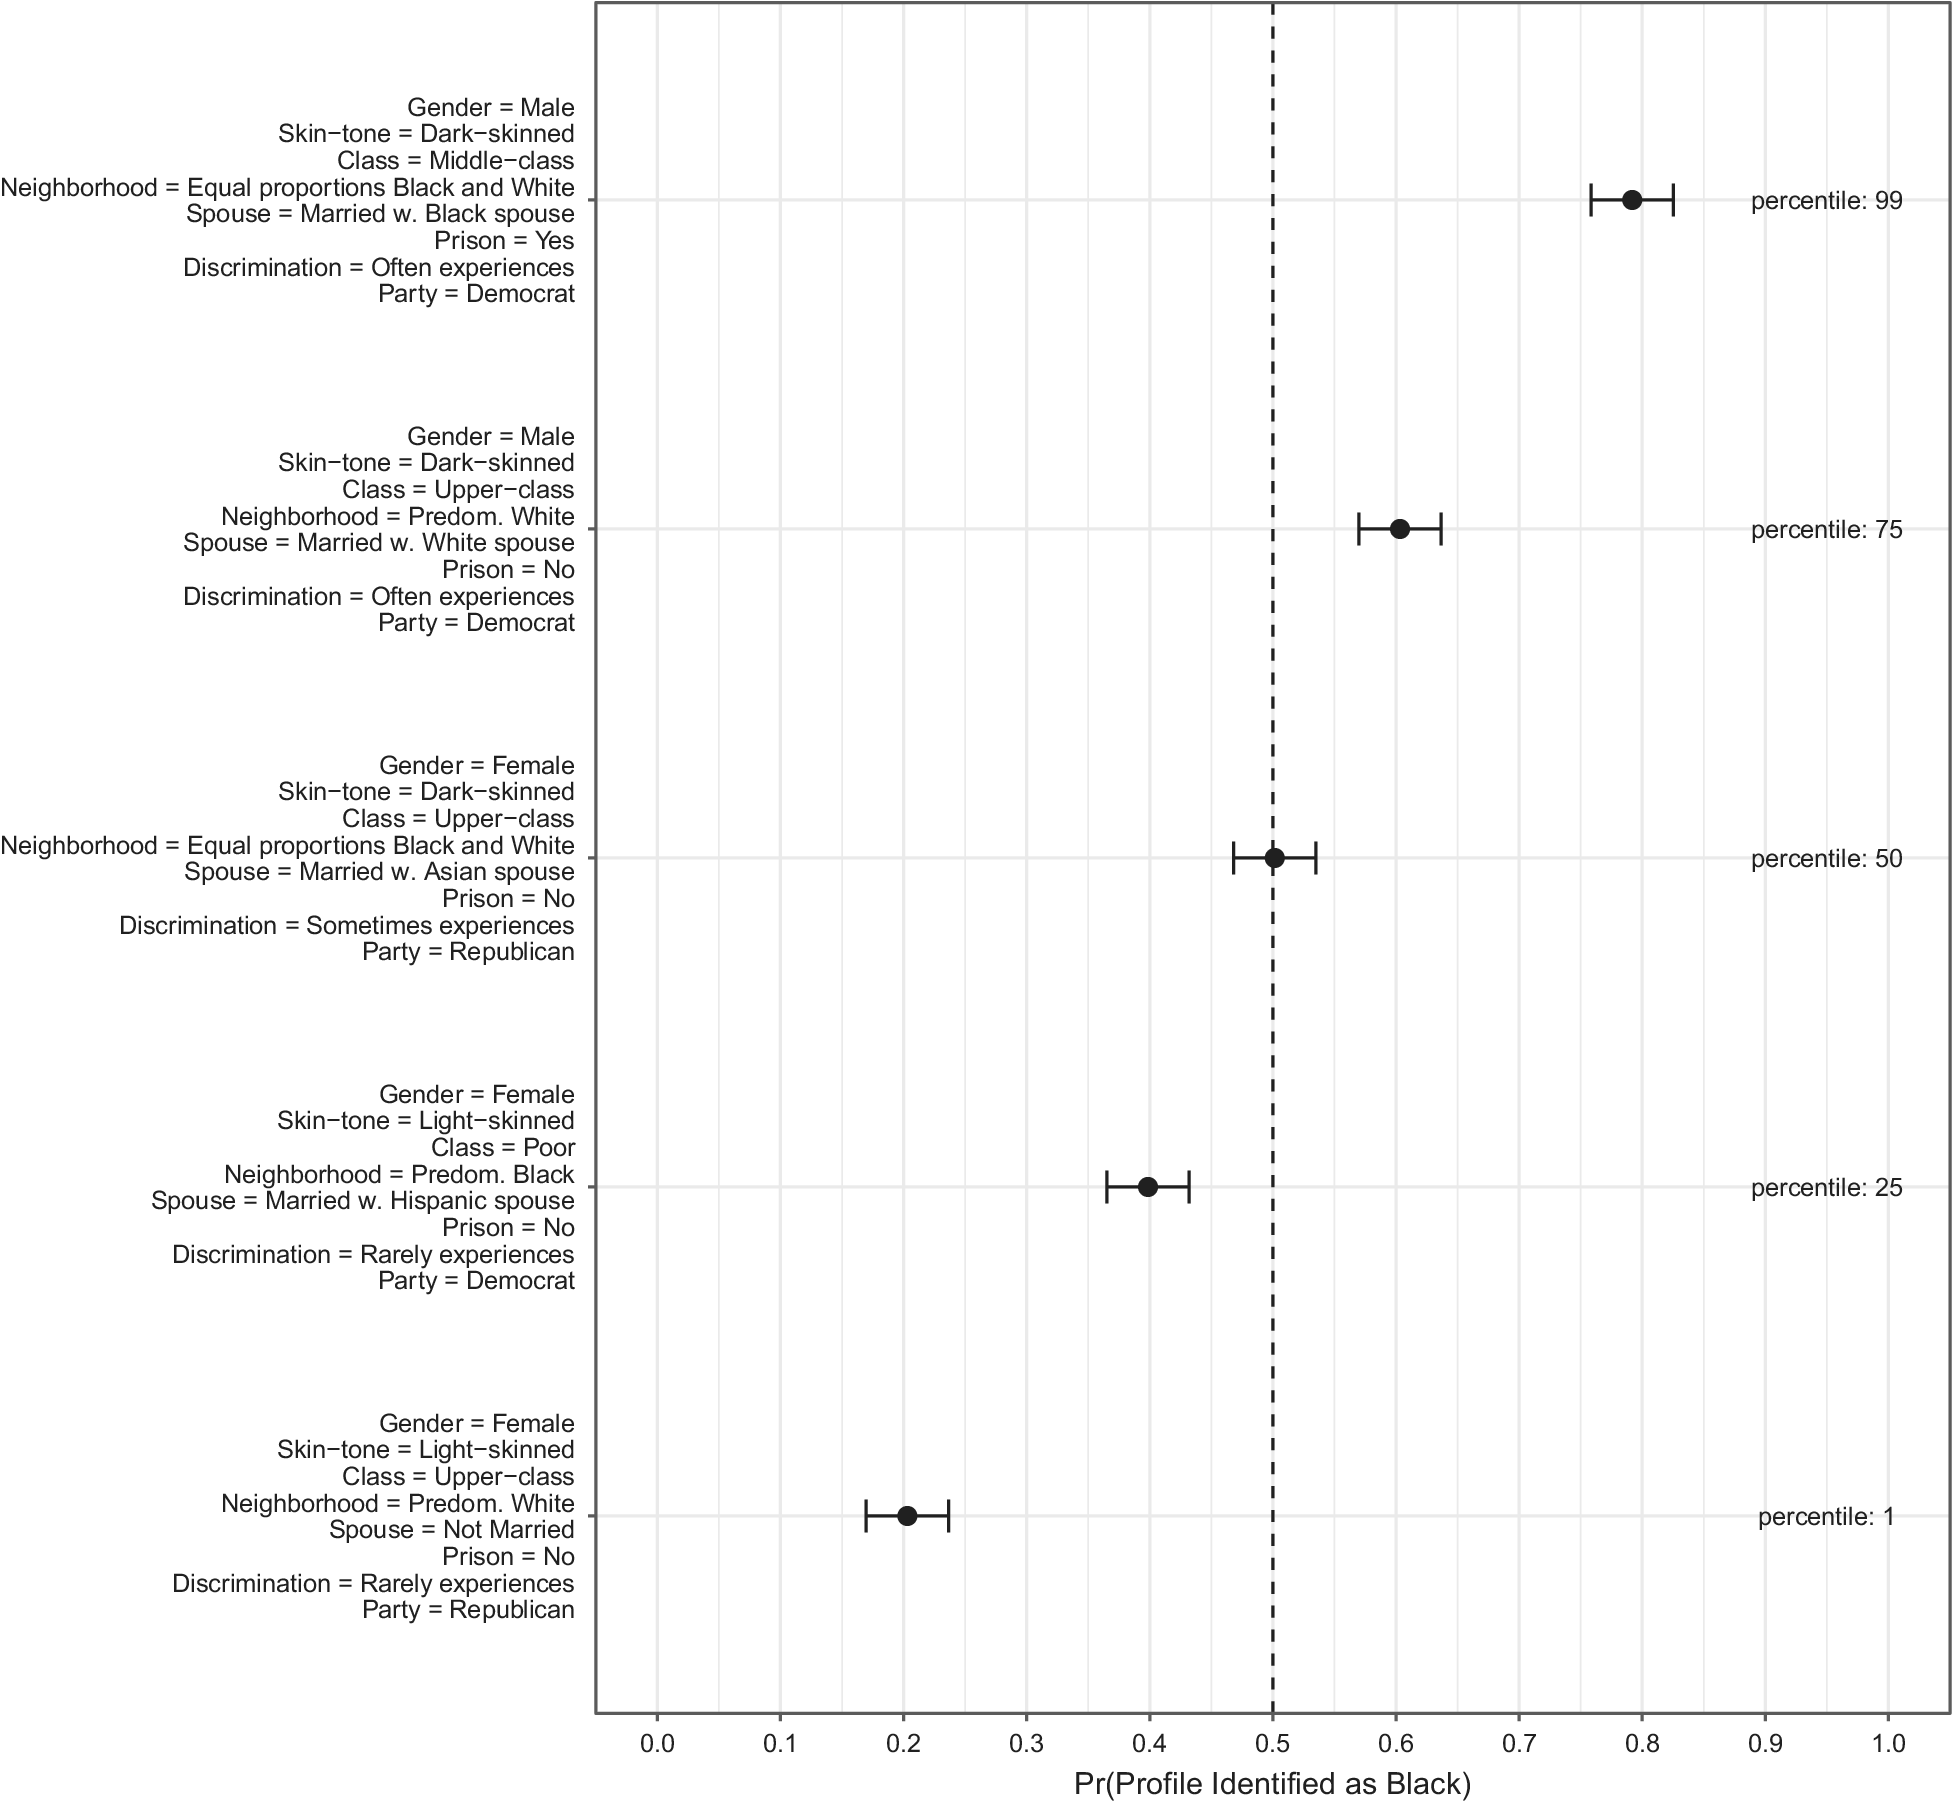
The AMCEs clarify how individual attributes shape perceptions of relative blackness. But racial classification involves evaluating multiple cues simultaneously. To illustrate how these traits operate in combination, figure 1 reports the predicted probability that selected sample profiles are identified as the “more Black” option.
Estimated Probability of Being Identified as More Black for Selected Profiles
Figure 1 shows the estimated probability of being identified as the more Black profile for selected sample profiles (
$ N=\mathrm{11,876} $
 rated profiles). Each set of traits represents one sample profile drawn from the 1st, 25th, 50th, 75th, or 99th percentiles of the predicted-probability distribution. Bars represent 95% confidence intervals. The estimates are based on the benchmark OLS model with clustered standard errors shown in table 2. SI Figure F.1 shows a similar figure including parentage cues. SI table F.2 shows additional sample profiles at low-, medium-, and high-predictive probabilities of being selected.

Figure 1 Long description
The chart features a horizontal axis labeled P r (Profile Identified as Black) ranging from 0.0 to 1.0. A vertical dashed line marks the 0.5 probability threshold. Five distinct profiles are plotted from top to bottom.
* Profile 1 (Top): Gender = Male, Skin-tone = Dark-skinned, Class = Middle-class, Neighborhood = Equal proportions Black and White, Spouse = Married w. Black spouse, Prison = Yes, Discrimination = Often experiences, Party = Democrat. The data point is at approximately 0.79 with a narrow error bar, labeled percentile: 99.
* Profile 2: Gender = Male, Skin-tone = Dark-skinned, Class = Upper-class, Neighborhood = Predom. White, Spouse = Married w. White spouse, Prison = No, Discrimination = Often experiences, Party = Democrat. The data point is at approximately 0.61, labeled percentile: 75.
* Profile 3: Gender = Female, Skin-tone = Dark-skinned, Class = Upper-class, Neighborhood = Equal proportions Black and White, Spouse = Married w. Asian spouse, Prison = No, Discrimination = Sometimes experiences, Party = Republican. The data point sits exactly on the 0.5 line, labeled percentile: 50.
* Profile 4: Gender = Female, Skin-tone = Light-skinned, Class = Poor, Neighborhood = Predom. Black, Spouse = Married w. Hispanic spouse, Prison = No, Discrimination = Rarely experiences, Party = Democrat. The data point is at approximately 0.40, labeled percentile: 25.
* Profile 5 (Bottom): Gender = Female, Skin-tone = Light-skinned, Class = Upper-class, Neighborhood = Predom. White, Spouse = Not Married, Prison = No, Discrimination = Rarely experiences, Party = Republican. The data point is at approximately 0.20, labeled percentile: 1.
Figure 1 is constructed using data from the conjoint condition that omits parentage cues (table 2, column 2). We estimate the predicted probability that each profile is identified as more Black and then array these predictions along a distribution ranging from never chosen (Pr = 0) to always chosen (Pr = 1). We display sample profiles drawn from the 1st, 25th, 50th, 75th, and 99th percentiles of this distribution. Because respondents must select one profile in each pair, the baseline probability of being identified as more Black is 0.5.
The profiles shown are intuitive. The profile most likely to be identified as more Black—a profile at the 99th percentile—is male, dark-skinned, middle class, lives in a racially diverse neighborhood, has a Black spouse, has been incarcerated, often experiences discrimination, and is a Democrat. At the opposite end of the distribution is a profile that is female, light-skinned, upper class, lives in a predominantly White neighborhood, is unmarried, has never been incarcerated, rarely experiences discrimination, and is a Republican. Profiles drawn from the middle of the distribution fall between these poles.
Figure 1 should be read as illustrative rather than deterministic. Each profile’s position reflects the combined influence of multiple traits, some of which matter far more than others. In the profile most likely to be identified as more Black, attributes such as dark skin, incarceration history, and partisanship exert substantially larger effects than gender or neighborhood composition or class background. The figure serves two purposes. It gives readers a concrete sense of the judgments that respondents were asked to render, and it illustrates that racial classification is a composite process in which people interpret profiles as configurations of cues, rather than as isolated traits.Footnote 20
Categorical Race
A key feature of our design is that respondents are asked to consider profile race in multiple ways. The previous section analyzed relative race: how respondents judge which of two profiles appears “more Black.” We now turn to categorical race and examine how profile attributes shape the likelihood that a target is classified as Black, White, or mixed-race.
Table 3 presents results from three linear probability models. The specifications mirror the baseline conjoint analysis, but here the dependent variable is respondents’ answer to the question, “How would you identify Person [profile designator]?” For ease of presentation, we construct binary outcome variables. For example, the probability that a profile is identified as White takes a value of 1 if a respondent selected “White” and 0 otherwise.Footnote 21
Categorical-Race Results

Table 3 Long description
The table displays regression coefficients with standard errors in parentheses. The dependent variables are Pr(ID’ed as Black), Pr(ID’ed as Mixed), and Pr(ID’ed as White), each with two model specifications.
Key independent variables and findings include:
* Parentage (ref. Two Black parents): One Black and one White parent significantly decreases the probability of being identified as Black (-0.534) and increases the probability of being identified as Mixed (0.521) and White (0.012).
* Skin-Tone (ref. Dark-skinned): Light-skinned status significantly decreases the probability of being identified as Black (-0.069 and -0.333) and increases the probability of being identified as Mixed (0.064 and 0.165) and White (0.168 in model 2).
* Party ID (ref. Democrat): Republican identity shows a small but significant decrease in the probability of being identified as Black (-0.016 and -0.052).
* Neighborhood (ref. Predominantly Black): Living in predominantly White neighborhoods significantly decreases the probability of being identified as Black (-0.123) and increases the probability of being identified as White (0.111).
* Spouse (ref. Black spouse): Having a Hispanic, White, or Asian spouse generally decreases the probability of being identified as Black and increases the probability of being identified as Mixed.
* Incarceration history (ref. Yes): Having never been incarcerated significantly decreases the probability of being identified as Black (-0.019 and -0.030) and increases the probability of being identified as White (0.016 and 0.026).
* Experience with discrimination (ref. Often): Rarely or sometimes experiencing discrimination is associated with a lower probability of being identified as Black.
Bottom rows indicate approximately 11,900 observations per model, the inclusion of skin-tone location controls, and R-squared values ranging from 0.003 to 0.299. Significance levels are marked as * p < 0.05 and ** p < 0.01.
Notes: Standard errors clustered by respondent in parentheses. Table G.1 presents results including skin-tone location controls. *p < 0.05; **p < 0.01 (two-tailed tests).
For reference, in the conjoint that included parentage, 55.5 percent of profiles were categorized as Black, 36.8 percent as mixed-race, and 7.7 percent as White. In the conjoint that omitted parentage, 52.8 percent of profiles were categorized as Black, 27.8 percent as mixed-race, and 19.4 percent as White.Footnote 22
Many of the estimates in columns 1 and 2 of table 3 mirror those in the relative-race analysis. Parentage and skin tone remain strong predictors of categorization, but they are not the only ones. Respondents evaluate these cues alongside a broader set of social and political attributes when assigning categorical labels.
One difference worth noting is that gender plays a somewhat larger and more precisely estimated role in the categorical task than in the relative one. In addition, when parentage information is available, profiles with one Black parent and one White parent are overwhelmingly categorized as mixed-race rather than Black.
The White category, however, is sharply constrained. Although the coefficient on parentage for the probability of being classified as White is positive, the effect is substantively small. At roughly one percentage point, it represents only a 15% increase over the baseline probability that profiles in this condition were categorized as White in this condition. This result highlights a striking asymmetry. Having a Black parent largely renders one non-White. Put differently, for individuals with immediate Black ancestry, a singularly White label remains largely outside the bounds of acceptability.
When parentage cues are absent, other attributes become more consequential. Light-skinned profiles are more likely to be categorized as mixed-race or White than dark-skinned profiles. Living in neighborhoods with more White residents, having a non-Black spouse, reporting fewer stigmatized social experiences, and identifying as Republican similarly increase the likelihood of being classified into non-Black categories. In short, both ascribed and acquired traits matter for whether profiles are classified as mixed-race or, less frequently, White.
Continuous Race
We now turn to our third and final outcome: the continuous-race measure, which asks respondents, “On a scale from 0 (not at all) to 10 (very) how strongly would you identify Person [Profile designator] as Black?” This measure allows us to examine whether respondents treat blackness as a categorical identity and as something that varies by degree.
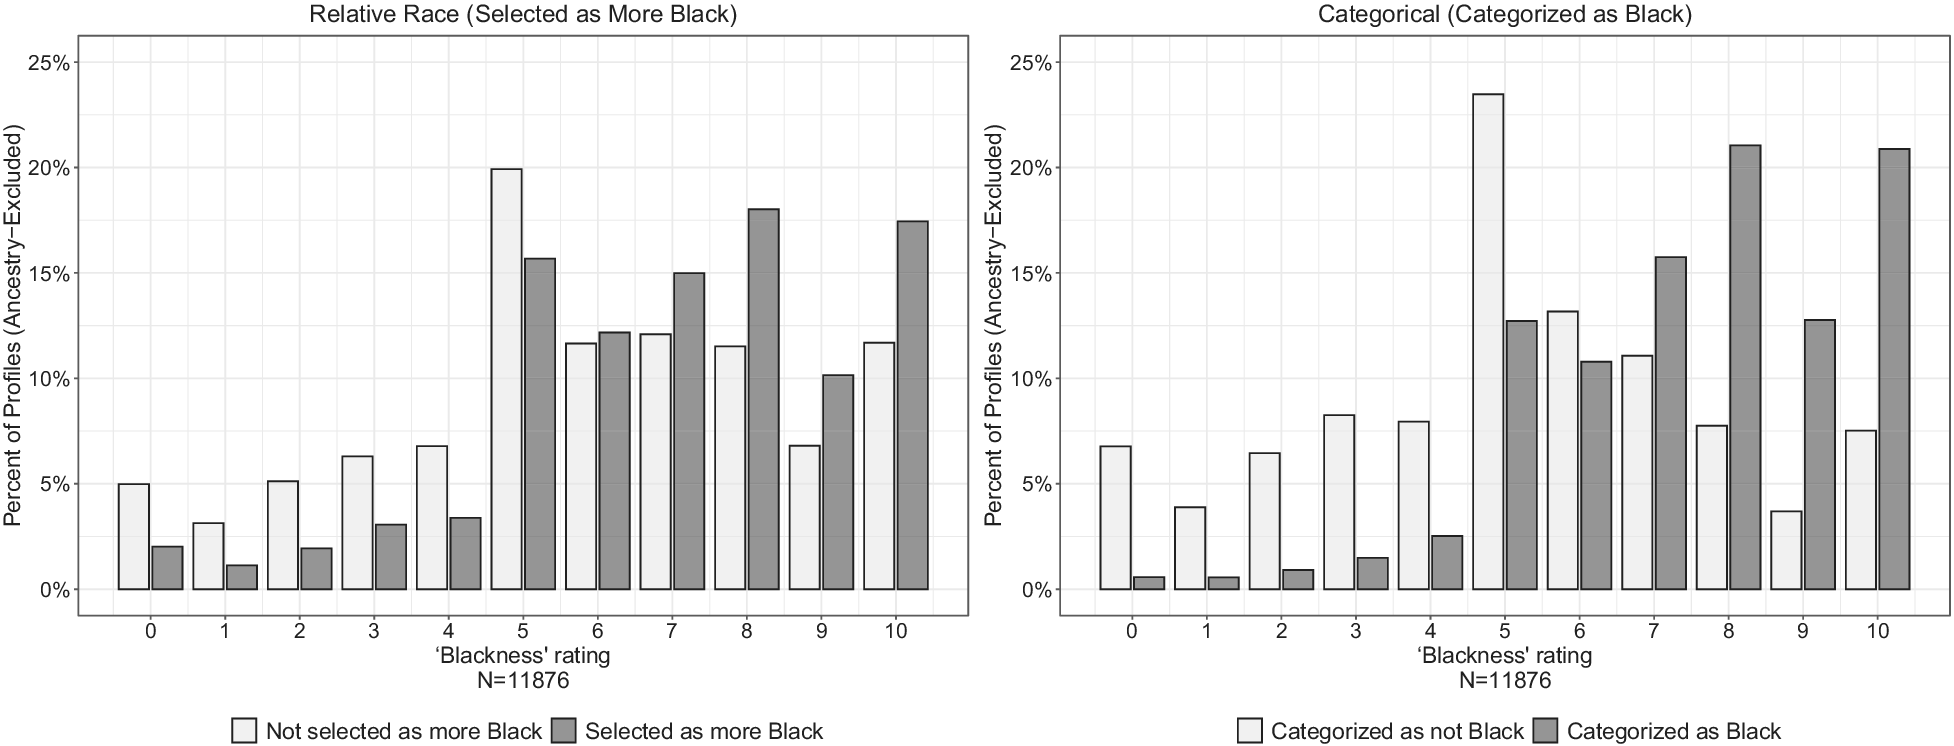
To assess this variation, we examine how profiles that were selected as more Black in the relative-race task or categorized as Black in the categorical task are rated on the continuous scale and compare them to profiles that were not. Figure 2 presents results from the conjoint that omits parentage race information, focusing on profiles that may be perceived as more racially ambiguous.
Blackness Scale Ratings by Relative- and Categorical-Race Measures
Both panels plot the distribution of blackness-scale ratings for profiles in the conjoint that omits parentage. In the left panel, profiles are grouped by whether respondents selected them as the more Black profile in the relative-race task. Dark bars correspond to profiles selected as more Black, and light bars correspond to profiles not selected. In the right panel, profiles are grouped by whether respondents categorized them as Black in the categorical-race question. Dark bars correspond to profiles categorized as Black, and light bars correspond to profiles categorized as not Black. In both panels, profiles selected as more Black or categorized as Black tend to receive higher ratings on the continuous scale, although profiles selected or categorized as Black are not all rated as equally Black.

Figure 2 Long description
A two-panel bar chart with a shared sample size of N = 11876. Both panels feature an X axis labeled Blackness rating ranging from 0 to 10 and a Y axis labeled Percent of Profiles Ancestry-Excluded ranging from 0 percent to 25 percent.
Left Panel: Relative Race (Selected as More Black).
Light gray bars represent Not selected as more Black and dark gray bars represent Selected as more Black. For ratings 0 through 4, light gray bars are higher, peaking near 7 percent. At rating 5, there is a sharp increase where light gray reaches 20 percent and dark gray reaches approximately 16 percent. For ratings 6 through 10, dark gray bars generally exceed light gray bars, with dark gray peaks at ratings 8 and 10 near 18 percent.
Right Panel: Categorical (Categorized as Black).
Light gray bars represent Categorized as not Black and dark gray bars represent Categorized as Black. For ratings 0 through 4, light gray bars are significantly higher than dark gray bars, which remain below 3 percent. At rating 5, light gray bars peak at their highest point of approximately 24 percent. From ratings 8 to 10, dark gray bars dominate, peaking at approximately 21 percent for ratings 8 and 10, while light gray bars drop below 8 percent.
Profiles identified as the more Black option in the relative-race task receive higher ratings on the continuous scale (mean
$ =6.94 $
 , SD
$ =2.36 $
 ) than profiles not chosen as more Black (mean
$ =5.84 $
 , SD
$ =2.73 $
 ), a statistically significant difference (p
$ <0.01 $
 ). We observe a similar pattern in the categorical task. Profiles categorized as Black receive higher ratings on the continuous scale (mean
$ =7.48 $
 , SD
$ =2.04 $
 ) than profiles not categorized as Black (mean
$ =5.18 $
 , SD
$ =2.65 $
 ), again a statistically significant difference (p
$ <0.01 $
 ).Footnote
23
Importantly, figure 2 shows that even among profiles categorized as Black, only a small share receive the maximum rating of 10, and many fall in the middle of the scale. Respondents thus distinguish among Black profiles in meaningful ways, indicating that blackness is not treated as a uniform or fixed status. Instead, respondents perceive gradations of blackness that coexist with categorical assignments.Footnote 24
Viewed alongside the relative and categorical measures, these results show that respondents’ assessments vary systematically with profile attributes across multiple modes of racial classification.
The Role of Classifier Race in Constructing “Black”
As noted earlier, existing research on racial classification rarely considers that people from different racial groups may construct blackness—and racial categories more broadly—in distinct ways. Two possibilities follow. Different groups may draw the boundaries of “Black” in different places, or they may rely on different cues (or weigh the same cues differently) when deciding whether someone counts as Black. In this section, we examine both possibilities.
Do Different Racial Groups Construct Racial Boundaries Differently?
We begin by asking whether Black, mixed-race, and White Americans differ in how expansive they perceive the category “Black” to be. Profiles with Black-White parentage provide a particularly informative test, because they sit at the margins of categorical boundaries and may be perceived with some ambiguity (Egan Reference Egan2020; Chandra Reference Chandra2006; Ho et al. Reference Ho, Sidanius, Levin and Banaji2011).
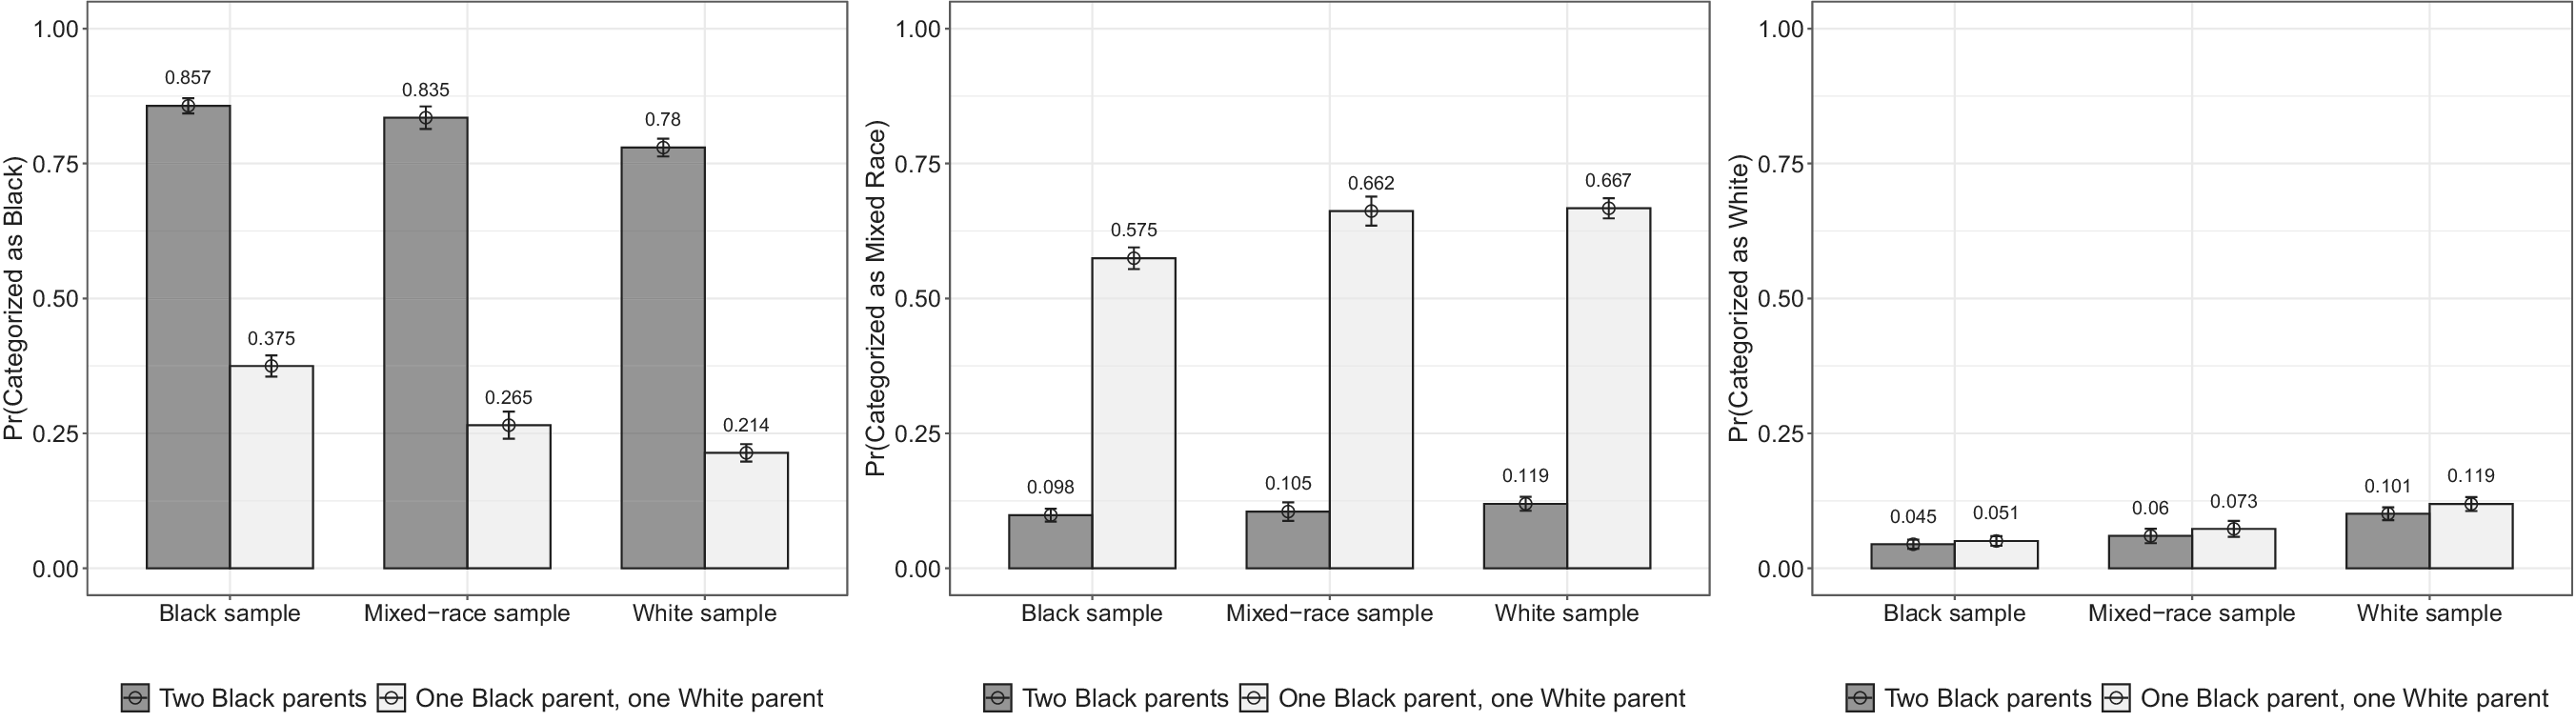
Consistent with our expectations, Black respondents are more likely than their White and mixed-race counterparts to classify these profiles as Black. The first panel of figure 3 presents these results, showing that the predicted probability that a Black-White-parentage profile is categorized as Black is 0.375 (SD
$ =0.484 $
 ) among Black respondents. That probability falls to 0.265 (SD
$ =0.442 $
 ) among mixed-race respondents and to 0.214 (SD
$ =.410 $
 ) among White respondents, roughly 11 and 16 percentage points lower, respectively. This pattern indicates that the categorical boundary around blackness is wider for Black Americans than for non-Black Americans.
Probability of Profiles’ Categorization as a Racial Group, by Respondent Race
The figure shows the probability that a given profile type (two Black parents versus one Black and one White parent) was categorized as a given race by respondents of different racial groups. The leftmost panel depicts estimates for whether profiles are categorized as Black, the middle panel depicts estimates for whether profiles are categorized as mixed-race, and the rightmost panel depicts estimates for whether profiles are categorized as White. For example, in the leftmost profile, the probability that a profile with two Black parents is categorized as Black when seen by Black respondents is approximately .86; 95% confidence intervals are shown alongside point estimates. We similarly plot average placements from the continuous-race task by profile parentage and respondent race, which are shown in SI figure H.1.

Figure 3 Long description
A multi-panel figure with three horizontal panels. Each panel has an x-axis labeled with three respondent groups: Black sample, Mixed-race sample, and White sample. The y-axis represents probability from 0.00 to 1.00. A legend at the bottom indicates dark gray bars for Two Black parents and light gray bars for One Black parent, one White parent.
Left Panel: Pr(Categorized as Black).
* Black sample: Two Black parents at 0.857, One Black/One White at 0.375.
* Mixed-race sample: Two Black parents at 0.835, One Black/One White at 0.265.
* White sample: Two Black parents at 0.78, One Black/One White at 0.214.
Middle Panel: Pr(Categorized as Mixed Race).
* Black sample: Two Black parents at 0.098, One Black/One White at 0.575.
* Mixed-race sample: Two Black parents at 0.105, One Black/One White at 0.662.
* White sample: Two Black parents at 0.119, One Black/One White at 0.667.
Right Panel: Pr(Categorized as White).
* Black sample: Two Black parents at 0.045, One Black/One White at 0.051.
* Mixed-race sample: Two Black parents at 0.06, One Black/One White at 0.073.
* White sample: Two Black parents at 0.101, One Black/One White at 0.119.
All bars include vertical error bars representing confidence intervals.
The second and third panels of figure 3 reinforce this conclusion. Among profiles with one Black and one White parent, Black respondents are less likely than mixed-race or White respondents to classify these profiles as mixed-race. White respondents, in contrast, are the group most likely to classify the same profiles as White (White Americans: 0.119; mixed-race Americans: 0.073; Black Americans: 0.051). Although the boundaries of whiteness are generally understood to exclude those with Black ancestry, White Americans are nonetheless the group most willing to extend a White label to individuals with one Black parent.Footnote 25
Evidence from the continuous blackness scale aligns closely with these categorical results, showing that Black respondents assign higher average blackness ratings to profiles than do White respondents (SI figure H.9). Notably, profiles with two Black parents are placed near the upper end of the scale across all respondent groups and are rarely placed toward the lower end, even as average placements fall short of the scale maximum and exhibit some spread. The categorical measures show a comparable pattern, with two-Black-parent profiles overwhelmingly classified as Black, although not without some residual variation.
These findings reveal a systematic asymmetry in racial boundary drawing. Respondents tend to apply broader boundaries to their own racial category, with mixed-race respondents occupying an intermediate position. They are more likely than Black respondents to assign a multiracial label, but, like Black respondents, they are less willing than White respondents to classify individuals with Black ancestry as White. At the same time, these patterns reinforce the importance of parentage in classification judgments, even though it is not fully determinative.
These patterns also speak to how different groups relate to the historical “one-drop” rule. Black respondents are more likely to classify mixed-parentage profiles as Black, whereas White respondents are more likely to classify mixed-parentage profiles as White. This difference suggests less consistent reliance on hypodescent among White respondents. In this sense, the asymmetry we observe is not simply about expansiveness but about differential adherence to ancestry-based classification rules. Black respondents’ broader inclusion of mixed-parentage individuals into the Black category is more consistent with hypodescent, whereas White respondents appear more willing to relax this rule by extending a White label to individuals with Black ancestry.
These findings suggest that contemporary applications of the one-drop rule are uneven across groups. Rather than uniformly governing racial classification, hypodescent appears to be more strongly reflected in Black respondents’ judgments, and White respondents exhibit greater flexibility in assigning whiteness to individuals with partial Black ancestry.
Do Racial Groups Rely Differently on Attributes When Constructing Blackness?
Classifier race may also matter in how respondents weigh specific attributes when deciding whether a profile counts as Black. Although we did not have strong expectations for most traits, we anticipated that Black Americans might rely more heavily on partisanship, given well-documented in-group norms linking Black identity with Democratic identification (White, Laird, and Allen Reference White, Laird and Allen2014).
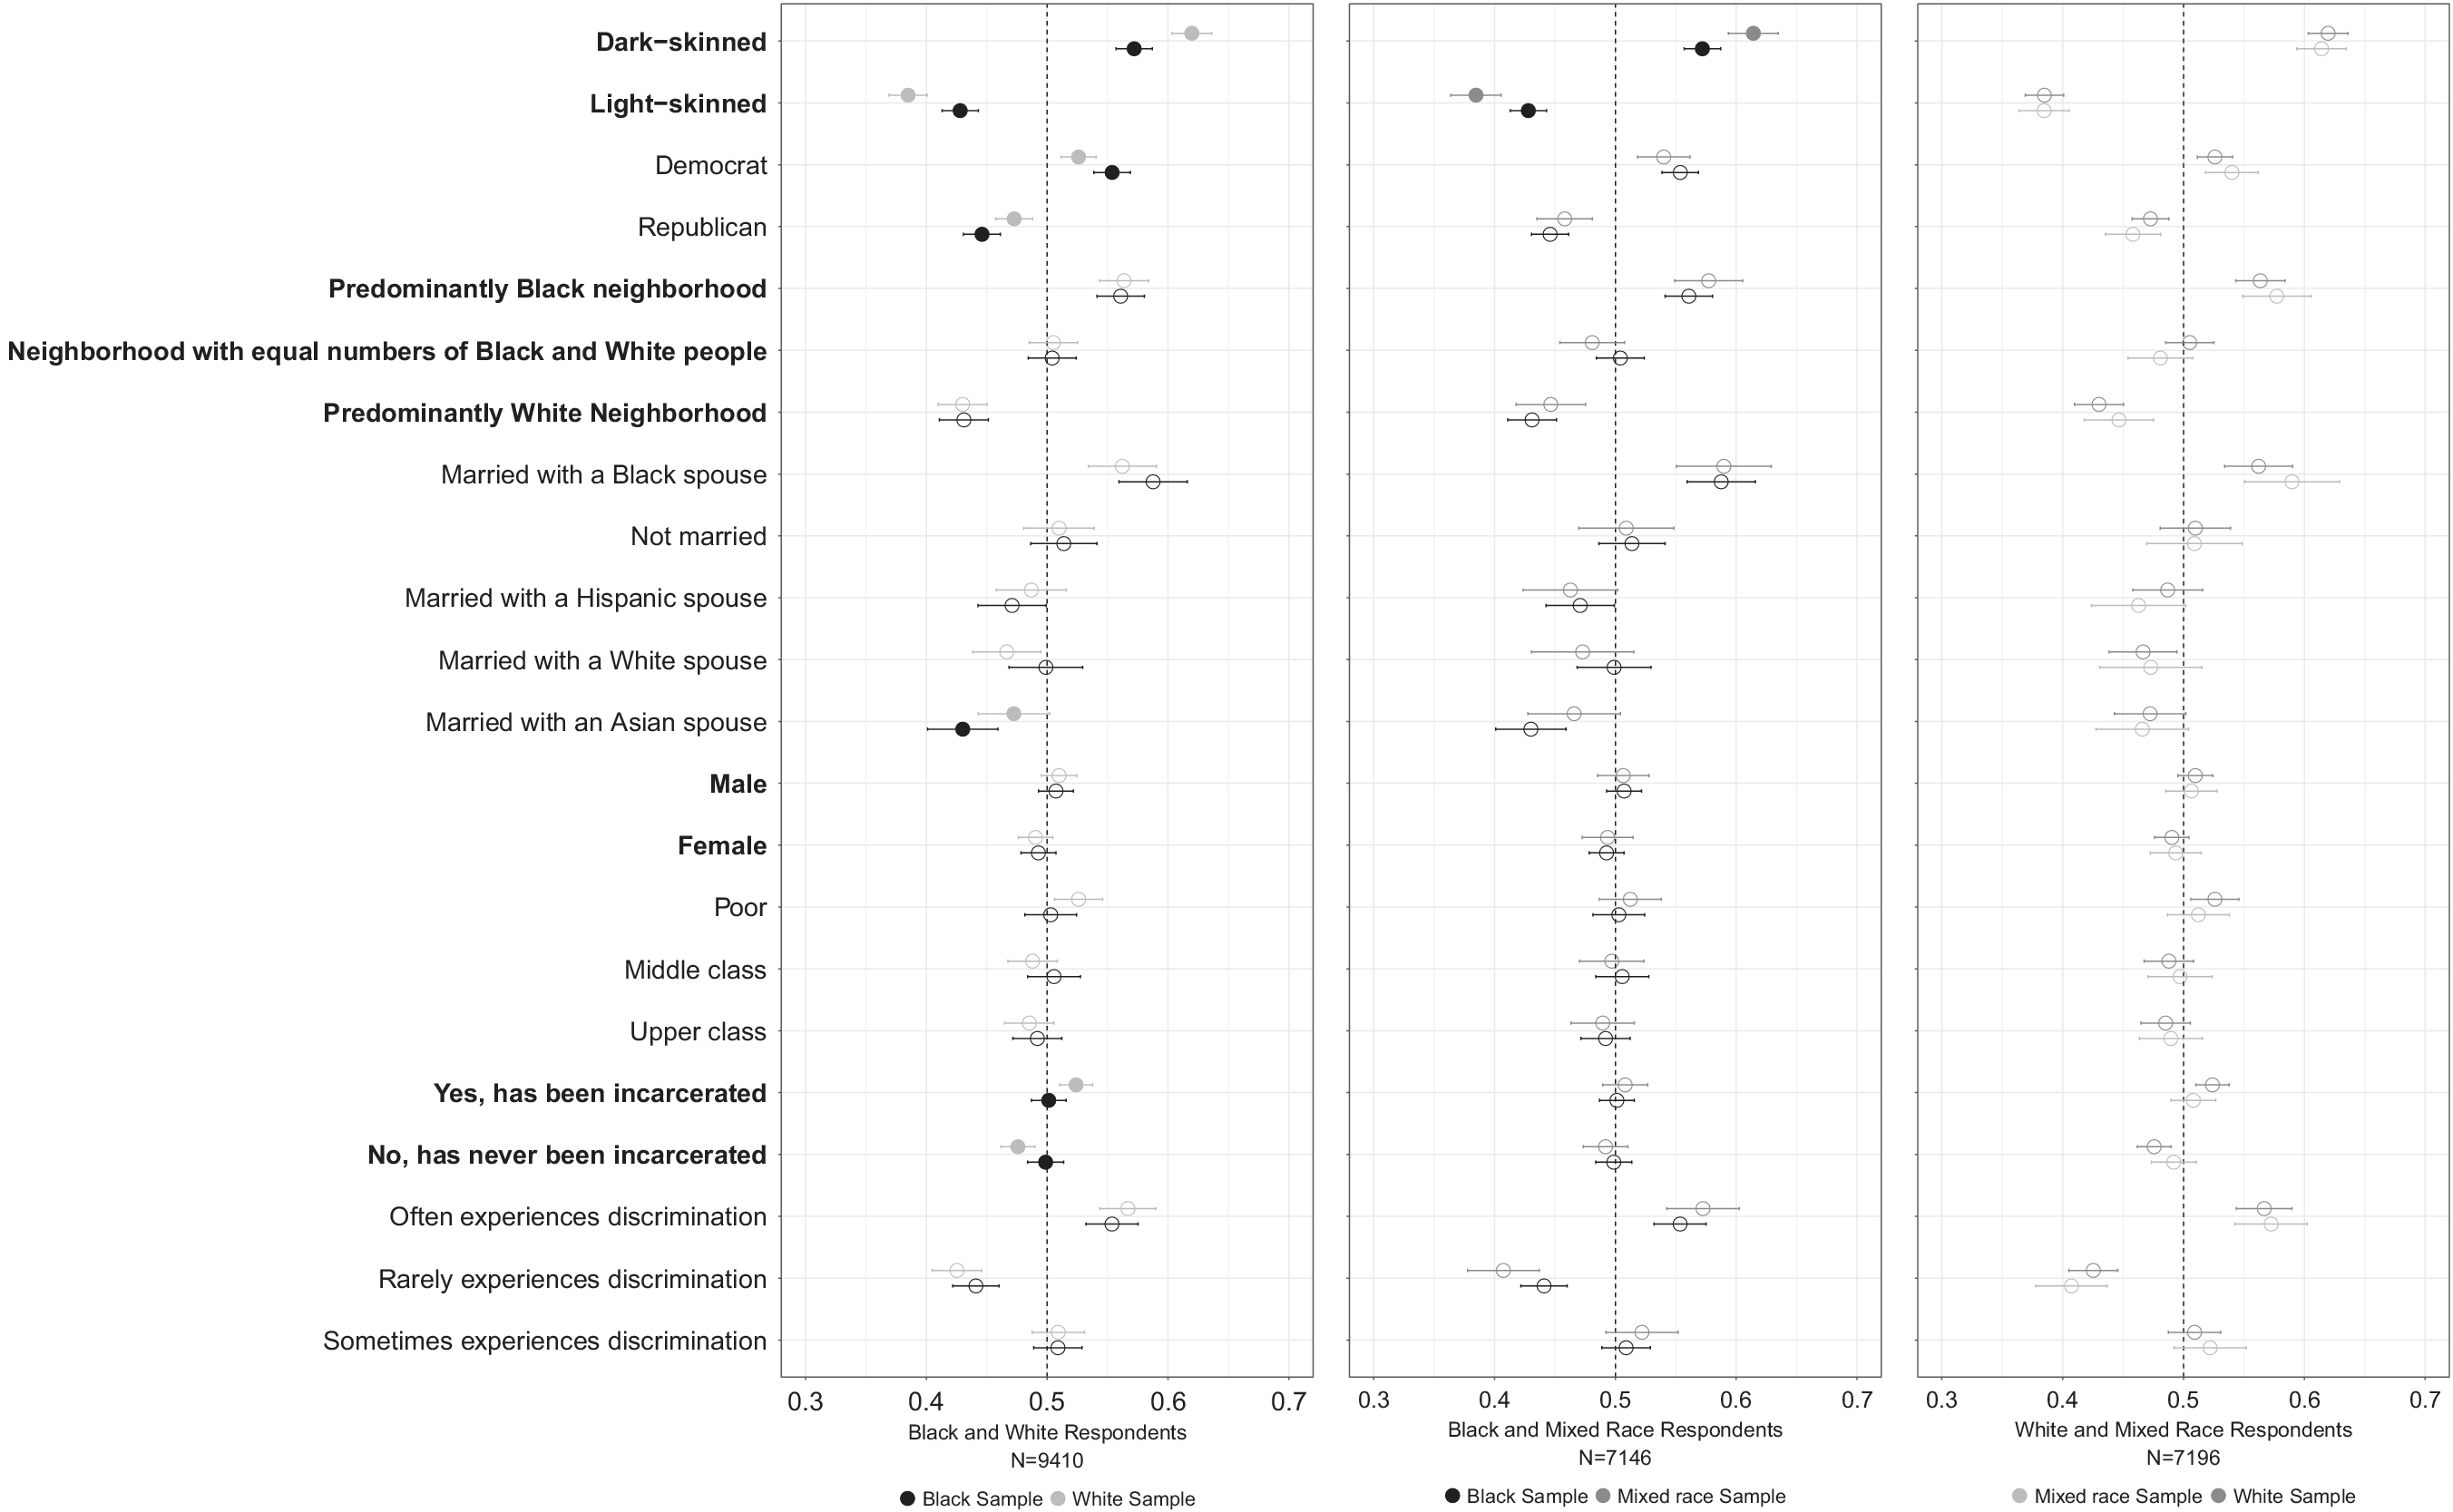
To assess this possibility, we examine respondents’ answers to the relative-race question (“All things considered, which person would you most identify as Black?”) Following best practices, figure 4 presents marginal means by racial group.Footnote 26
Marginal Means by Racial Group for Conjoint Omitting Parentage Information
The horizontal axis plots marginal means estimates with 95% confidence intervals, and the vertical axis indicates each category. Estimates are computed over rated profiles (the unit of analysis throughout). Differences that are significant at the 5% level are denoted by the colored-in points. SI table F.3 shows full point estimates.

Figure 4 Long description
A multi-panel figure with three horizontal panels. Each panel has a Y-axis listing 21 categorical attributes and an X-axis representing marginal means from 0.3 to 0.7 with a dashed vertical reference line at 0.5.
Panel 1 (Left): Black and White Respondents, N equals 9410. Compares Black Sample (black dots) and White Sample (light gray dots). Key findings: Dark-skinned and Democrat attributes show higher means for both groups, while Light-skinned and Republican show lower means. Married with a Black spouse shows a high mean for the Black sample.
Panel 2 (Center): Black and Mixed Race Respondents, N equals 7146. Compares Black Sample (black dots) and Mixed race Sample (dark gray dots). Trends are similar to Panel 1, with Dark-skinned and Democrat attributes showing the highest positive deviation from the 0.5 baseline.
Panel 3 (Right): White and Mixed Race Respondents, N equals 7196. Compares Mixed race Sample (dark gray dots) and White Sample (light gray dots). The data points for both groups are closely aligned across most categories, including neighborhood types and socioeconomic status.
Common Y-axis labels from top to bottom: Dark-skinned, Light-skinned, Democrat, Republican, Predominantly Black neighborhood, Neighborhood with equal numbers of Black and White people, Predominantly White Neighborhood, Married with a Black spouse, Not married, Married with a Hispanic spouse, Married with a White spouse, Married with an Asian spouse, Male, Female, Poor, Middle class, Upper class, Yes, has been incarcerated, No, has never been incarcerated, Often experiences discrimination, Rarely experiences discrimination, Sometimes experiences discrimination.
The first panel compares Black and White respondents, with shaded points indicating differences that are statistically significant at the 5% level. Across most attributes, Black and White respondents evaluate profiles similarly, indicating broad agreement in how blackness is constructed. However, several differences emerge. White respondents place greater weight on skin tone and incarceration history, whereas these cues—particularly incarceration—have little effect on Black respondents’ classifications.Footnote 27 In contrast, partisanship produces one of the clearest divergences: Black respondents rely more heavily on partisan cues, with Republican identification signaling a departure from established in-group norms and reducing perceived blackness (White and Laird Reference White and Laird2020).
The second panel of figure 4 compares Black and mixed-race respondents, whose evaluations are largely similar. The primary difference is that skin tone is less consequential for Black respondents than for mixed-race respondents.
Taken together, these results show that, in the absence of ancestry information, Black and mixed-race respondents are more likely than White respondents to draw political boundaries around blackness, and White respondents rely more heavily on phenotypic and stigmatized cues—particularly skin tone and incarceration—when making racial classifications.
Discussion
This article examines how the category “Black,” often treated as fixed in political science research, is constructed through judgments that draw on ancestry, appearance, politics, and social context. Rather than assuming racial identity as a stable background characteristic, we show that racial classification is an evaluative process shaped by multiple cues and interpreted differently across groups. By examining partisanship as a cue for racial classification, comparing multiple measures of race, and analyzing judgments made by Black, White, and mixed-race respondents, we offer a more complete account of how the boundaries of blackness are drawn and enforced in contemporary American life.
Several findings merit emphasis. First, our results provide clear evidence that blackness is not static. Ascribed traits such as parentage and skin tone remain powerful anchors of racial classification, but they do not operate alone. Political identity also matters. Profiles described as Republican are consistently viewed as less Black than otherwise identical profiles described as Democrat, even when those profiles are dark-skinned and have two Black parents. This pattern highlights how partisanship has become a racialized signal, particularly within evaluations of Black identity. In this sense, our findings give empirical support to Fields’s (Reference Fields2016: 6) observation that strong Black identity is widely understood as “incompatible with Republican partisanship” (an assumption he challenges).
We find that, overall, “Black” is conceptualized similarly across perceiver race; different groups tend to rely on traits comparably in their assessment of blackness, suggesting some shared understanding of the racial category’s meaning. We do, however, observe some important differences across groups. Notably, effects of partisan cues are especially pronounced among Black respondents. For these respondents, partisan cues function as more than ideological markers; they likely serve as signals of alignment with group norms and collective interests. These patterns cohere with Cohen’s (Reference Cohen1999) argument that people may be viewed as “less Black” when they violate widely shared criteria for group membership. In practice, such judgments can invite forms of boundary policing in which attitudes are read as indicators of racial authenticity. These dynamics may shape interpersonal relations, candidate evaluation, and participation, because those perceived to violate group norms risk social sanctioning (White and Laird Reference White and Laird2020).
At the same time, Black respondents hold a more expansive conception of blackness than do White or mixed-race respondents. They are less likely to rely on skin tone when classifying others and more willing to categorize individuals with mixed parentage as Black. This broader boundary reflects the historical and social realities of Black communities, which have long encompassed wide phenotypic variation under conditions shaped by the one-drop rule and racial mixing (Dawson Reference Dawson1994; Hochschild and Weaver Reference Hochschild and Weaver2007). Black respondents’ judgments appear less tied to appearance and more attentive to social location and perceived connection to Black communities.
This expansiveness, however, does not imply an absence of evaluation. Black respondents’ greater emphasis on sociopolitical and relational cues, including partisanship and spouse’s race, suggests that judgments about blackness also involve assessments of cultural embeddedness and shared experience. For example, as shown in figure 4, Black respondents are less likely than White respondents to classify profiles with an Asian spouse as Black, a pattern consistent with the idea that a spouse’s race can signal cultural proximity or distance from the Black community (Banks Reference Banks2011) and with research noting that Asians occupy a status position closer to White Americans (Kim Reference Kim2004).
White respondents, in contrast, tend to construe the boundaries of blackness more narrowly. As cues for blackness, White respondents place greater weight than Black respondents on dark skin and incarceration history—traits that have long been racialized in stereotypical and stigmatizing ways. They are also more likely than Black or mixed-race respondents to categorize profiles of mixed parentage as White.
Although this pattern may initially seem surprising, it aligns with the historical ways in which racial boundaries have been enforced. As Davis (Reference Davis2010) notes, the one-drop rule operated not only through parentage but also through the surveillance of visible traits, such as phenotype, and markers of social position. Courts routinely relied on appearance and status to determine racial group membership (Sharfstein Reference Sharfstein2007).Footnote 28 Viewed in that light, White respondents’ emphasis on skin tone and incarceration—rather than ancestry alone—is consistent with a long history in which surveillable and socially meaningful traits were treated as decisive for racial assignment. In an era of increasing intermarriage, parentage may simply be less legible to White respondents than it once was, and visible and status-linked cues may carry greater weight.
These patterns complicate narratives suggesting that whiteness is uniformly protected or tightly policed. Instead, they point to contextual flexibility in racial assignment. They may also reflect contemporary incentives. Just as Black Americans may be motivated to maintain an expansive view of their group’s boundaries, White Americans, especially in a political environment where many perceive their group’s status as threatened, may have incentives to construe blackness more narrowly (Craig and Richeson Reference Craig and Richeson2014; Jardina Reference Jardina2019). If numerical and symbolic power are perceived to be at stake, limiting who “counts” as part of an out-group can serve psychological and political ends.
These results point to meaningful differences in how racial membership is understood across groups. Black Americans tend to draw in-group boundaries using political, cultural, and relational cues, whereas White Americans place greater weight on phenotypical and stereotypical markers. Accounts of racial classification that rely solely on White respondents therefore miss important variation in how racial categories are drawn and enforced. Studies that do not sample non-White respondents or disaggregate by perceiver race cannot capture the distinct approaches to racial assignment we document (e.g., Saperstein and Penner Reference Saperstein and Penner2012; Schachter, Flores, and Maghbouleh Reference Schachter, Flores and Maghbouleh2021).
Finally, our multidimensional approach to measuring race clarifies how people actually evaluate blackness in practice. Respondents do not rely on a single mode of classification. They compare profiles to one another, assign categorical labels, and make graded judgments about how strongly someone is seen as Black. These modes do not collapse into a single judgment. The relative-race measure captures comparative assessments, where some traits make a profile appear more or less Black in relation to others. The categorical measure reveals the persistence of hard boundaries, most notably the continued resistance to assigning a White label to individuals with Black ancestry. And the continuous measure shows that even within the category Black, respondents perceive meaningful variation. Blackness, in other words, is not treated as an on–off status but as something people see as varying by degree.
Limits and Future Directions
The attributes we examine capture several central cues people draw on when classifying blackness, but they do not exhaust the set of signals that may shape racial perception. Other phenotypical markers beyond skin tone, such as hair texture or facial features; presentational cues like clothing, speech, or accent; and signals of national origin, may also matter (Brown and Lemi Reference Brown and Lemi2021; Waters Reference Waters1999). Future work should examine how these additional cues, alone and in combination with the traits we study, influence judgments of who counts as Black.
Our design also centers blackness as the focal category. Respondents were asked to assess whether a profile is, and how strongly it is, Black, and we vary attributes that prior research links to blackness to estimate their relative importance. This is a deliberate scope condition. The meaning, history, and boundaries of other racialized categories are structured differently. Because the one-drop rule was uniquely applied to Black Americans, the criteria that render blackness legible are not symmetric with those that define whiteness, indigeneity, Hispanicity, or Asianness. For example, whiteness has historically been policed through exclusion and narrow ancestry requirements; thus, in a conjoint focused on whiteness, we would expect respondents, particularly White respondents, to prioritize European ancestry and phenotype more heavily, with institutional or status cues playing a more limited role. Moreover, tribal affiliation may be especially salient for American Indianness (Nagel Reference Nagel1995), whereas language fluency, national origin, or immigration status may weigh more for Latinoness or Asianness (Fraga et al. Reference Fraga, Garcia, Segura, Jones-Correa, Hero and Martinez-Ebers2010; Wong et al. Reference Wong, Ramakrishnan, Lee, Junn and Wong2011). Future research should examine how race is cued for these groups and should also sample respondents from a wider range of ethnoracial categories. One natural extension would be a set of designs that rotate the focal category across groups and incorporate language, surname, and broader skin tone cues, allowing researchers to examine cross-category substitution, including in dialogue with work on Afro-Latinidad (Hernández Reference Hernández2003; Matos, Greene, and Sanbonmatsu Reference Matos, Greene and Sanbonmatsu2023).
Relatedly, our results speak most directly to the multidimensional ways in which people construct blackness—biological, cultural, and political—but we cannot fully disentangle these mechanisms. Parentage and skin tone map most clearly onto biological understandings of race; neighborhood context, spouse’s race, and class reflect cultural proximity and social position; and partisanship highlights a political dimension tied to group interests. Our evidence suggests that respondents draw on all three and that their relative importance varies by classifier race. Designs that more explicitly prime or manipulate these dimensions would help clarify how different understandings of blackness are activated and combined in practice.
Our approach also focuses on how unfamiliar targets are classified in a low-stakes context, where respondents’ judgments carry no material consequences. Racial classification may operate differently in contexts where decisions are tied to concrete penalties or rewards, such as hiring, housing, or criminal justice. Embedding similar classification tasks in audit studies or high-stakes experimental vignettes would help assess how the patterns we document translate to settings where racial categorization has tangible consequences.
Given the current design, we are also limited in our ability to adjudicate why White respondents were more likely than Black respondents to classify profiles with mixed parentage as mixed-race rather than Black. In discussing these findings, we speculate that this pattern may reflect concerns about shifting racial demographics, including reluctance to expand the size of a racial out-group or heightened sensitivity to group boundaries under perceived status threat. This interpretation is consistent with work on racial threat and group position (Abascal Reference Abascal2020; Craig and Richeson Reference Craig and Richeson2014), but it remains speculative. Directly testing these mechanisms will require designs that more explicitly measure or manipulate perceived demographic change and intergroup threat.
We further acknowledge that our sample, drawn from an online panel, is somewhat more educated than the general US population. This matters because education may influence how openly people express stereotypical views and could attenuate the magnitude of some attribute effects. At the same time, random assignment within the conjoint design ensures that estimated attribute effects are internally valid, even if some respondents are more constrained in how they report their views. To the extent that higher education dampens reliance on stereotypes, our estimates likely represent conservative lower bounds.
Finally, this study is grounded in the US racial context, where the one-drop rule, segregation, and mass incarceration have structured how blackness is policed and surveilled and therefore how it is constructed (Nobles Reference Nobles2000; Sharfstein Reference Sharfstein2007; Telles and Paschel Reference Telles and Paschel2014). In other national settings, racial categories are organized differently and may operate with greater flexibility. Extending this framework cross-nationally would allow scholars to assess how the relative weight placed on ancestry, phenotype, status, and political cues varies across institutional and historical environments and how those environments shape the meanings attached to blackness and to other racialized identities.
Conclusions
We advance a simple but demanding claim: if race is socially constructed, then scholars must do more than gesture toward that fact. We must examine how those constructions operate, what cues they draw on, and how they vary across observers and contexts. Our aim has been to take that task seriously.
We do so by developing a multidimensional account of racial classification that captures how racial categories are applied in practice. Drawing on constructivist theories of identity (Monk Reference Monk2022; Omi and Winant Reference Omi and Winant1994), we show that racial classification is social, political, and cultural, not merely demographic. Rather than treating race as a stable background characteristic, our approach foregrounds the evaluative judgments through which racial identities are assigned and interpreted. In this respect, we build on prior work that urges political scientists to move beyond race as a fixed predictor of political outcomes and instead to interrogate the process through which race comes to matter politically (e.g., Egan Reference Egan2020; Jefferson, Neuner, and Pasek Reference Jefferson, Neuner and Pasek2021; Sen and Wasow Reference Sen and Wasow2016).
This approach also reflects how race operates in everyday life. Although many scholarly accounts treat race as a fixed or binary category, racial group membership often operates along a continuum. People do not stop at asking whether someone is Black; they assess how Black they are. Public debates over the “blackness” of Barack Obama, Kamala Harris, or Clarence Thomas routinely invoke ancestry, cultural ties, and political commitments, and voters often evaluate Black candidates with similar attention to expression and signaling (Wamble Reference Wamble2024). By examining relative, categorical, and continuous constructions of blackness in tandem, our study brings empirical clarity to these common but understudied modes of classification.
Our work also contributes to conversations about partisanship and racial identity. For Black Americans in particular, partisanship appears to do more than signal political preferences; it also conveys information about racial group loyalty. As Cohen (Reference Cohen1999) argued, not all in-group members are viewed as equally belonging within the boundaries of blackness. More colloquially, one might say, “Not all skin folks are kin folks.” Our results show that politics enters into these judgments, helping explain why Black Republican candidates often struggle to gain traction among Black voters: their partisanship is read, in part, as a statement about their blackness.
All told, our findings bring empirical and theoretical clarity to a basic claim that animates scholarship on race across the social sciences: racial categories are not innate but made. The category has meaning because people collectively imbue it with meaning. This is not unique to race. Other social identities, such as gender and sexuality, also derive their meaning from sociopolitical processes and remain contested and context dependent. Importantly, recognizing the constructed and fictive character of race is not meant to minimize its significance. On the contrary, it is precisely because race organizes real hierarchies and produces real consequences that it demands the kind of careful, critical scrutiny that we have brought to it here.
Supplementary material
To view supplementary material for this article, please visit http://doi.org/10.1017/S1537592726105787.
Data Availability
Data replication sets are available in Harvard Dataverse at: https://doi.org/10.7910/DVN/MRXND8.
Acknowledgments
For helpful comments and suggestions, we thank Alexander Agadjanian, Jacob Brown, Will Bullock, Daniel Carpenter, Katie Clayton, Ryan Enos, Justin Grimmer, Jake Grumbach, Jens Hainmueller, Ellis Monk, Fabian Neuner, Spencer Piston, Jennifer Richeson, Aliya Saperstein, Luisa Schwartzman, Alicia Sheares, Paul Sniderman, Mike Tomz, Robb Willer, Soichiro Yamauchi, and Erez Yoeli, as well as seminar participants at Harvard, NYU, UC San Diego, Yale, University of Michigan, University of Pennsylvania, the APSA Political Psychology Seminar Series, the Social Lab in Stanford’s Department of Psychology, and the Center for Advanced Study in the Behavioral Sciences at Stanford University. The protocol for this study was approved by the Stanford IRB (
$ \#52580 $
 ) and the Harvard IRB (IRB20-
$ 1618 $
 ). Authors’ names are listed alphabetically; each contributed to all aspects of the project’s design, execution, and writing.
Funding Statement
The study was funded by the authors’ university research accounts.
Competing Interests
The author(s) declare none.






 Open access

