Implications
Different studies have highlighted the stability of goat milk fat composition under a variety of feeding strategies; however, the physiological basis for this particular response is not clear. The present study in lactating goats fed oil supplements includes a unique set of data on fatty acid composition and lipogenic gene mRNA abundance in four tissues involved in lipid metabolism. The results are consistent with a specific role of each tissue in lipid metabolism, although the response to the dietary treatments did not seem to be mediated by changes in the mRNA abundance of genes encoding key lipogenic enzymes and the related transcription factors.
Introduction
The animal's diet is a major factor determining the quality of dairy products and, consequently, considerable attention has been paid in the last few decades to the nutritional means that could modify the fatty acid (FA) composition of milk in ruminants (Chilliard et al., Reference Chilliard, Glasser, Ferlay, Bernard, Rouel and Doreau2007). In dairy goats, the partial substitution of sunflower-seed oil in the diet by fish oil (a source of very long-chain n-3 polyunsaturated FAs (PUFA)) reduced the n-6:n-3 FA ratio of milk fat without reversing the low saturated FA and the high c9,t11-18:2 and t11-18:1 concentrations achieved (Bernard et al., Reference Bernard, Mouriot, Rouel, Glasser, Capitan, Pujos-Guillot, Chardigny and Chilliard2010). Remarkably, feeding sunflower-seed oil and fish oil plus additional starch compared with sunflower-seed oil alone affected neither the percentage of t10-18:1 in milk fat nor dairy goat performance, which contrasts with the important reductions in milk fat content and yield and the marked increases in t10-18:1 concentrations in cows or sheep fed n-6 PUFA-rich oils and fish oil (Invernizzi et al., Reference Invernizzi, Thering, McGuire, Savoini and Loor2010; Toral et al., Reference Toral, Frutos, Hervás, Gómez-Cortés, Juárez and de la Fuente2010). However, the complex interactions between lipid supplements and forage type and level make direct comparisons among studies difficult, especially in small ruminants, on which few studies are available.
The physiological basis for the particular response of dairy goats to lipid supplements is not clear yet, but probably differs from that of other ruminant species, given the known inter-species differences in digestive and metabolic processes (Chilliard et al., Reference Chilliard, Glasser, Ferlay, Bernard, Rouel and Doreau2007). Molecular biology techniques offer a valuable and new approach to study the mechanisms underlying the nutritional regulation of mammary lipogenesis. In this regard, reductions in milk fat synthesis in cows fed plant oils rich in n-6 PUFA and fish oil have been related to variations in lipogenic gene expression not only in the mammary gland but also in other body tissues (Harvatine and Bauman, Reference Harvatine and Bauman2006; Thering et al., Reference Thering, Graugnard, Piantoni and Loor2009; Invernizzi et al., Reference Invernizzi, Thering, McGuire, Savoini and Loor2010). Although these changes were attributed in cows to modifications in the partitioning of nutrients towards non-mammary tissues (Thering et al., Reference Thering, Graugnard, Piantoni and Loor2009), studies in dairy goats characterising lipid metabolism in body tissues or nutritional regulation are still scant to assume that the same may happen in this species (Bernard et al., Reference Bernard, Rouel, Leroux, Ferlay, Faulconnier and Legrand2005a and Reference Bernard, Bonnet, Leroux, Shingfield and Chilliard2009). Further, there is no available information on simultaneous measurements of FA composition, expression of genes encoding key lipogenic enzymes and related transcription factors in goat body tissues.
Therefore, the present study was conducted on lactating goats with the main objective of characterising the FA composition of the mammary secretory tissue and the major body tissues that are involved in lipid metabolism in the lactating ruminant (i.e. liver and omental and perirenal adipose tissues (ATs)) together with the mRNA abundance of lipogenic genes and transcription factors involved in FA metabolism. A second objective was to examine the impact of the addition of fish oil and starch to a diet containing sunflower-seed oil on the same parameters in an attempt to improve the knowledge of the nutritional regulation of lipogenesis in lactating goats.
Material and methods
Animals, experimental diets and management
All experimental procedures were approved by the Animal Care Committee of INRA in accordance with the ‘Use of Vertebrates for Scientific Purposes Act’ of 1985.
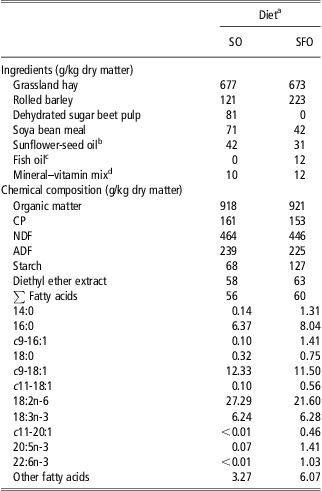
Eight multiparous, non-pregnant Alpine goats at day 266 (s.d. 7) of lactation at the beginning of the experiment were used. The goats were housed in individual tie stalls and randomly divided into two groups balanced for milk yield, parity and stage of lactation. Each goat was assigned to one of two experimental diets. The diets consisted of grassland hay distributed ad libitum and a concentrate mixture, which included 90 g of sunflower oil per day (the SO diet; Huileries de Lapalisse SA, Lapalisse, France), or a combination of 60 g of sunflower oil and 30 g of fish oil per day (SA Daudruy Van Cauwenberghe & Fils, Dunkerque, France) plus 102 g/day of additional starch from rolled barley (the SFO diet). The ingredients of the diets are shown in Table 1.
Ingredients and chemical composition of the ingested experimental diets

SO = sunflower-seed oil; SFO = sunflower-seed oil and fish oil (2:1) plus starch from rolled barley.
aFor each experimental diet, n = 4.
bContained (g/kg) 14:0 (0.9), 16:0 (72.0), c9-16:1 (1.3), c9-18:1 (290.8), 18:2n-6 (597.1), 18:3n-3 (14.9), 20:5n-3 (1.8), 22:6n-3 (0.2).
cContained (g/kg) 14:0 (79.0), 16:0 (169.5), c9-16:1 (89.3), 18:0 (29.8), c9-18:1 (147.9), 18:2n-6 (39.5), 18:3n-3 (16.0), 20:5n-3 (91.6), 22:6n-3 (69.0).
dReported to contain (g/kg) Ca (240), P (60), Mg (50), Na (15), Zn (7), Mn (6), α-tocopherol (0.3), retinol (0.2), cholecalciferol (0.002) (Usine d'Ussel, Murat, France).
The experiment lasted for 21 days (which corresponded to the second period of a crossover study; see Bernard et al., Reference Bernard, Mouriot, Rouel, Glasser, Capitan, Pujos-Guillot, Chardigny and Chilliard2010 for details). The goats were milked at 0730 and 1530 h, and fresh diets were offered in two equal meals after the milking. The effects of the treatments on animal performance and milk FA composition have been reported earlier (Bernard et al., Reference Bernard, Mouriot, Rouel, Glasser, Capitan, Pujos-Guillot, Chardigny and Chilliard2010).
Measurements and sampling procedures
The individual feed intake was recorded during the last week of the experimental period. Representative samples of the experimental diets were collected daily and stored at −20°C until they were analysed for their chemical composition (Association of Official Analytical Chemists, 2004).
On day 21 of the experiment, blood samples from the jugular vein were collected before the morning feeding using evacuated collection tubes containing potassium-EDTA (CML, Nemours, France). Plasma was obtained by centrifugation at 1500 × g for 15 min and stored at −20°C until being analysed for insulin, leptin and metabolite concentration, as described previously (Loor et al., Reference Loor, Ferlay, Ollier and Chilliard2005). On the same day, the goats were slaughtered just after the morning milking, and samples of the mammary secretory tissue, liver and omental and perirenal ATs were collected under sterile conditions, frozen in liquid N2 and stored at −80°C until the FA analysis and RNA extraction.
Lipid analysis
The lipids in the diets were extracted (Folch et al., Reference Folch, Lees and Sloane Stanley1957) and transesterified as outlined previously (Bernard et al., Reference Bernard, Rouel, Leroux, Ferlay, Faulconnier and Legrand2005a; Loor et al., 2005). The total lipids in 500 mg of mammary and liver tissues and in 30 mg of omental and perirenal ATs were extracted (Folch et al., Reference Folch, Lees and Sloane Stanley1957) and converted to FA methyl esters (FAME), as described by Glass (Reference Glass1971). The methyl esters were separated and quantified using a gas chromatograph equipped with a flame ionisation detector (Thermo Finnigan, Les Ullis, France) and 100 m fused silica capillary column (CP-SIL 88; Chrompack 7489, Middelburg, The Netherlands) using H2 as the carrier and fuel gas. The total FAME profile was determined using a temperature gradient programme (Loor et al., Reference Loor, Ferlay, Ollier and Chilliard2005), and isomers of 18:1 were further resolved in a separate analysis under isothermal conditions (Shingfield et al., Reference Shingfield, Ahvenjärvi, Toivonen, Äröla, Nurmela, Huhtanen and Griinari2003). The peaks were routinely identified using authentic standards (Sigma, Saint-Quentin Fallavier, France). The identification of 18:1 isomers was verified on the basis of FAME standard mixtures and chromatograms reported in the literature (e.g. Shingfield et al., Reference Shingfield, Ahvenjärvi, Toivonen, Äröla, Nurmela, Huhtanen and Griinari2003).
RNA isolation and real-time reverse transcription-PCR (RT-PCR)
Total RNA was isolated from each tissue, purified further and evaluated for concentration and integrity (Bernard et al., Reference Bernard, Rouel, Leroux, Ferlay, Faulconnier and Legrand2005a). Quantitative RT-PCR was carried out (Bernard et al., Reference Bernard, Rouel, Leroux, Ferlay, Faulconnier and Legrand2005a) using specific primers and probes (Supplementary Table S1) for the following candidate genes: FA translocase (CD36) and solute carrier family 27, member 6 (SLC27A6), which are involved in the uptake and intracellular transport of FA; FA synthase (FASN), which is involved in de novo FA synthesis; FA desaturases 1 and 2 (FADS1 and FADS2), stearoyl-CoA desaturase (SCD1 and SCD5) and elongation of very long-chain FA protein 2 and 5 (ELOVL2 and ELOVL5), which are involved, respectively, in the Δ5,6,9-desaturation and elongation processes of FA; and the transcription factors sterol regulatory element binding transcription factor 1 (SREBF1), liver X receptor alpha (LXRA), peroxisome proliferator-activated receptor alpha (PPARA), peroxisome proliferator-activated receptor gamma (PPARG1) and Sp1 transcription factor (SP1), which are involved in the regulation of lipogenic gene expression. To account for variation in RNA integrity, RNA quantification and cDNA synthesis, the mRNA abundance was normalised using the geometric mean of three housekeeping genes (peptidyl-prolyl cis-trans isomerase A or cyclophilin A (PPIA), ubiquitously expressed transcript (UXT) and eukaryotic translation initiation factor 3 subunit K (EIF3K)), which were identified as suitable internal controls from among several tested (M. Bonnet, UMR 1213-INRA, personal communication). The abundance of candidate gene transcripts was expressed as the mRNA copy number relative to the geometric mean of the three housekeeping genes.
Statistical analysis
The FA composition and mRNA abundances of each tissue, as well as the plasma metabolites and hormones, were analysed by one-way ANOVA using the MIXED procedure of the Statistical Analysis System software package version 9.1 (SAS Institute Inc., Cary, NC, USA). The statistical model included the fixed effect of the treatment. For data on mRNA abundance and major FA in the four tissues, a separate one-way ANOVA was performed including the fixed effects of the tissue in the statistical model. In both cases, the random effect of animal was used as the error term to contrast the effect of either dietary treatment or tissue site. The differences between means were evaluated using the ‘pdiff option’ of the ‘LS means’ statement of the MIXED procedure. Pearson correlation coefficients (r) were generated for associations between the tissue mRNA abundance and the concentration of specific FA in the tissues using the CORR procedure of SAS. The treatment effects were declared significant at P < 0.05 and considered a trend towards significance at P < 0.10.
Results
Diet composition
The chemical composition of the diets is given in Table 1. By design, the SFO diet provided greater amounts of starch and long-chain n-3 PUFA, such as 20:5n-3 and 22:6n-3, compared with the SO diet, whereas the content of 18:2n-6 (the major FA in both diets) was 21% higher and the content of 16:0 was 26% lower in this latter treatment.
Plasma metabolites and hormones
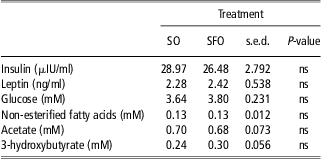
As shown in Table 2, the experimental treatment did not affect the concentrations of insulin, leptin or plasma metabolites.
Effect of fish oil and additional starch on plasma insulin, leptin and metabolites concentration in dairy goats fed a diet containing sunflower-seed oil
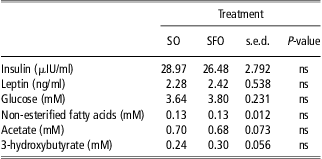
SO = sunflower-seed oil; SFO = sunflower-seed oil and fish oil (2:1) plus starch from rolled barley.
ns = non-significant P > 0.10.
Tissue FA composition
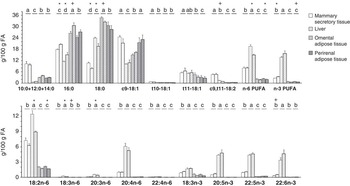
The experimental treatment had no effect (P > 0.10) on the total fat content of the goat tissues (with mean values of 32, 43, 858 and 824 mg of extracted lipid/g fresh tissue for the mammary tissue, liver and omental and perirenal ATs, respectively). This section and the related discussion focusses on the major FAs in the body tissues shown in Figure 1. For a complete profile, please see Supplementary Table S3.
Fatty acid (FA) profile (means + s.d.) of the mammary secretory tissue, liver and omental and perirenal adipose tissues in dairy goats fed a diet supplemented with sunflower-seed oil alone (plain bar) or in combination with fish oil and additional starch (dotted bar). a,b,c,dWithin a FA or group of FAs, different letters indicate significant differences (P < 0.05). Within each tissue, *indicates significant differences (P < 0.05), and + indicates a tendency towards significance (P < 0.10) between the experimental treatments.

Regardless of the location in the body, the main FAs in tissues were 16:0, 18:0 and c9-18:1 (Figure 1). The concentrations of n-6 and n-3 PUFA were low in AT but were relatively high in the mammary secretory tissue and particularly in the liver (Figure 1). The mammary tissue contained the highest levels of 10:0 + 12:0 + 14:0 and c9,t11-18:2, but all of the very long-chain PUFAs were much more abundant in the liver (Figure 1). The 18:2n-6 was the major n-6 PUFA in all tissues, whereas other FAs of this family were always found in very low concentrations, except for 20:4n-6 in the liver, which represented up to 33% of n-6 PUFA. Furthermore, the proportions of the major very long-chain n-3 PUFAs in the liver, namely, 20:5n-3, 22:5n-3 and 22:6n-3, were comparable between them (Figure 1). In the other tissues, 22:5n-3 was the most abundant very long-chain n-3 PUFA, particularly in AT, where its concentrations were fourfold to sixfold higher than those of 20:5n-3 and 22:6n-3 (Figure 1).
Diet fish oil and additional starch modified the relative proportions of several FAs. These changes were limited in the case of AT, and for the perirenal AT only the decrease (P = 0.008) in 18:2n-6 was quantitatively important (Figure 1), whereas tendencies (P < 0.10) to higher 16:0 and lower 18:0 were observed in the omental AT of goats fed the SFO diet (Figure 1). In contrast, the increase in 16:0 and the reduction in 18:0 with the SFO diet were statistically significant for the mammary tissue and the liver (Figure 1) and were accompanied by variation (P < 0.05) in several cis- and trans-18:1 and 18:2 isomers in both tissues (Supplementary Table S3) without changes in the proportions of t11- or t10-18:1 (Figure 1). The concentrations of individual n-3 PUFA were not significantly affected by the experimental diet, except for a trend to higher 22:6n-3 proportion (P = 0.096) in the mammary secretory tissue of goats on the SFO diet. Furthermore, this treatment increased the percentage of total n-3 PUFA (P = 0.021) in the mammary secretory tissue. In the liver, the SFO diet significantly decreased total n-6 PUFA, particularly 18:2n-6, 18:3n-6 and 20:3n-6 levels, and tended to reduce the c9,t11-18:2 content (P = 0.056; Figure 1).
Tissue mRNA abundance
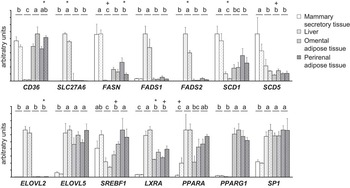
The mRNA abundances of the candidate genes in the four tissues are presented in Figure 2.
mRNA relative abundance (means + s.d.) of lipogenic genes and transcription factors of the mammary secretory tissue, liver and omental and perirenal adipose tissues in dairy goats fed a diet supplemented with sunflower-seed oil alone (plain bar) or in combination with fish oil and additional starch (dotted bar). (mRNA levels are expressed in arbitrary units determined as abundance relative to the geometric mean of PPIA, UXT and EIF3K mRNA). a,b,c,dWithin a gene, different letters indicate significant differences (P < 0.05). Within each tissue, *indicates significant differences (P < 0.05) and + indicates a tendency towards significance (P < 0.10) between the experimental treatments. PPIA = peptidyl-prolyl cis-trans isomerase A or cyclophilin A; UXT = ubiquitously expressed transcript; EIF3K = eukaryotic translation initiation factor 3 subunit K; CD36 = FA translocase; SLC27A6 = solute carrier family 27, member 6; FASN = fatty acid synthase; FADS1 and FADS2 = FA desaturases 1 and 2; SCD1 and SCD5 = stearoyl-CoA desaturase 1 and 5; ELOVL2 and ELOVL5 = elongation of very long-chain FA protein 2 and 5; SREBF1 = sterol regulatory element binding transcription factor 1; LXRA = liver X receptor alpha; PPARA = peroxisome proliferator-activated receptor alpha; PPARG1 = peroxisome proliferator-activated receptor gamma.

The SLC27A6, FADS2, ELOVL2 and LXRA transcripts were much more abundant (P < 0.001) in the liver than in other tissues. The highest abundances of FASN, SCD1 and SCD5 and the lowest abundances of LXRA, PPARA, SP1 and ELOVL5 were observed in the mammary secretory tissue (P < 0.001; Figure 2). The mRNA abundance of SP1 and ELOVL5 did not differ between the liver and the two ATs (P > 0.10). Furthermore, there were almost no differences in mRNA abundance of the target genes between the omental and perirenal ATs, except for SREBF1, which was higher in the latter AT (P < 0.001; Figure 2). In this regard, the mRNA abundance of SREBF1 in the mammary tissue was intermediate to that in the omental and perirenal ATs, whereas the abundance of PPARG1 was much higher (P < 0.001) in the ATs.
No difference between treatments was observed for the abundance of mRNA encoding for FADS1, ELOVL5, PPARG1 and SP1 in the body tissues (Figure 2). Similarly, there was no variation in mammary mRNA abundance for any of the other genes studied, with the exception of a trend (P = 0.072) towards greater PPARA mRNA abundance in the SFO diet. In contrast, in goats fed the SFO diet, several differences were observed for the liver, such as lower SLC27A6, SCD1 and FADS2 mRNA abundance, as well as increases in LXRA in the omental AT, and increases in CD36 together with reductions in FASN in the perirenal AT.
Discussion
Several studies have highlighted the stability of goat milk fat secretion and composition under a variety of feeding strategies (Chilliard et al., Reference Chilliard, Glasser, Ferlay, Bernard, Rouel and Doreau2007), including diet supplementation with sunflower-seed oil and fish oil (Bernard et al., Reference Bernard, Mouriot, Rouel, Glasser, Capitan, Pujos-Guillot, Chardigny and Chilliard2010), which is a combination of lipid supplements that causes milk fat depression in dairy cows and sheep (Thering et al., Reference Thering, Graugnard, Piantoni and Loor2009; Invernizzi et al., Reference Invernizzi, Thering, McGuire, Savoini and Loor2010; Toral et al., Reference Toral, Frutos, Hervás, Gómez-Cortés, Juárez and de la Fuente2010). Although comparisons between studies can seldom be made because of the few data available in goats and the variation in basal diet composition and/or lipid supplementation, inter-species differences in lipid metabolism have been highlighted previously (Chilliard et al., Reference Chilliard, Glasser, Ferlay, Bernard, Rouel and Doreau2007).
A better knowledge of tissue FA composition is necessary to improve our understanding of lipid metabolism in ruminants; however, in dairy goats, there are few studies on this subject (see review by Banskalieva et al., Reference Banskalieva, Sahlu and Goetsch2000). The data on FA composition are especially scarce in the case of mammary tissue, and the present results indicate that, with respect to the longer-chain FA, the mammary FA profile resembled mostly that of milk fat (Bernard et al., Reference Bernard, Mouriot, Rouel, Glasser, Capitan, Pujos-Guillot, Chardigny and Chilliard2010), with the exception of relatively higher concentrations of n-3 PUFA. On the contrary, 10:0 + 12:0 + 14:0 were present in lower amounts in the mammary FA profile than in milk (Bernard et al., Reference Bernard, Mouriot, Rouel, Glasser, Capitan, Pujos-Guillot, Chardigny and Chilliard2010), which is consistent with previous reports in ruminants (Christie, Reference Christie1981). The appearance of these FAs in mammary secretory tissue could be partially explained by their presence in unsecreted cytosolic lipid droplets (Christie, Reference Christie1981; Moore and Christie, Reference Moore and Christie1981); however, the virtual absence of shorter FAs puts this hypothesis into question and suggests that they may represent constituent lipids of the mammary tissue.
Most of the constituent long-chain FAs of mammary tissue probably derive from plasma FA uptake, a process that could involve different proteins, such as solute carrier family 27 transporters. In cows, SLC27A6 has been identified as the most abundant transcript isoform in the mammary tissue, and its mRNA abundance is increased during lactation, being highest in the first few weeks postpartum (Bionaz and Loor, Reference Bionaz and Loor2008a). In the mammary tissue of goats, the abundance of the SLC27A6 transcript was low compared with that of other tissues (Figure 2), which may be related to the advanced stage of lactation and/or to tissue-specific expression.
De novo FA synthesis is a key process for milk fat secretion and explains the higher mRNA abundance of the FASN gene in the mammary tissue compared with other body tissues, as previously observed in lactating goats (Bernard et al., Reference Bernard, Leroux, Bonnet, Rouel, Martin and Chilliard2005b). The FAs originating from de novo synthesis and, mainly, those coming from mammary uptake can also be subjected to the action of Δ9-desaturase, which is encoded by two gene isoforms, SCD1 and SCD5 (Lengi and Corl, Reference Lengi and Corl2007). In lactating goats, SCD1 and SCD5 were more highly expressed in the mammary gland than in other tissues (Figure 2); these expressions are consistent with their relative c9-18:1 concentrations (Figure 1) and the known relevance of Δ9-desaturation in the maintenance of adequate milk fat fluidity (Chilliard et al., Reference Chilliard, Ferlay, Mansbridge and Doreau2000). However, the importance of other desaturases (such as Δ5- and Δ6-desaturases) seems marginal. Accordingly, only traces of FADS2 mRNA were found in the mammary tissue, which contrasts with a low but measurable abundance of FADS1 transcripts (Figure 2). This is in agreement with the results of mRNA abundance obtained in cows (Bionaz and Loor, Reference Bionaz and Loor2008a) but is contrary to proteomic analysis in this latter species (Peng et al., Reference Peng, Rawson, McLauchlan, Lehnert, Snell and Jordan2008). In contrast, the presence of ELOVL5 mRNA in the mammary tissue of goats (even in lower abundances than in other tissues) was unexpected because it is usually accepted that mammary tissue lacks elongases (Moore and Christie, Reference Moore and Christie1981). Determining whether the mRNA abundance of ELOVL5 has a role in the content of 22:5n-3 in caprine mammary tissue (Figure 1) needs further research.
A recent study on bovine mammary epithelial cells (McFadden and Corl, Reference McFadden and Corl2010) has proposed that the mRNA abundance of SREBF1 (which regulates the transcription of lipogenic genes in ruminants; Harvatine and Bauman, Reference Harvatine and Bauman2006) could be controlled by LXRA, a transcription factor whose mRNA was present at low levels in the mammary tissue of lactating goats (Figure 2). A relevant role of PPARG in the lactating mammary gland has also been suggested in cows (Bionaz and Loor, Reference Bionaz and Loor2008b; Kadegowda et al., Reference Kadegowda, Bionaz, Piperova, Erdman and Loor2009), but its mRNA abundance in the mammary tissue of goats was very low compared with that in ATs (Figure 2).
The hepatic tissue was characterised by a high SLC27A6 mRNA abundance, suggesting an involvement of the solute carrier family SLC27A in hepatic FA transport, as has been observed in beef cattle (Cherfaoui et al., Reference Cherfaoui, Durand, Bonnet, Cassar-Malek, Bauchart, Thomas and Gruffat2012). In contrast, the low abundance of FASN mRNA in the caprine liver is consistent with the low enzymatic activity of the corresponding protein in this tissue (Bernard et al., Reference Bernard, Bonnet, Leroux, Shingfield and Chilliard2009) and supports the minor relevance of de novo FA synthesis in the liver of ruminants (Christie, Reference Christie1981). In these animals, however, the relative importance of hepatic Δ9-desaturation is not completely clear yet (Palmquist et al., Reference Palmquist, Lock, Shingfield and Bauman2005), and reports on gene mRNA abundance are inconsistent on this issue, with evidence of much lower SCD1 mRNA abundance in the liver than in the AT of cows (Lengi and Corl, Reference Lengi and Corl2007) or no differences among them in sheep (Ward et al., Reference Ward, Travers, Richards, Vernon, Salter, Buttery and Barber1998) and goats (Bernard et al., Reference Bernard, Bonnet, Leroux, Shingfield and Chilliard2009). Because Δ9-desaturase is very active in ruminant AT (Palmquist et al., Reference Palmquist, Lock, Shingfield and Bauman2005), it is interesting that the liver SCD1 mRNA abundance was similar to that observed in the omental AT, which suggests that the hepatic tissue could be a site of potential Δ9-desaturation in the caprine. In addition, SCD5 mRNA abundance was found to be similar between the liver and the two ATs (although the cycle threshold values were always lower than for SCD1, as shown in Supplementary Table S2).
The FA composition of the goat liver and the high mRNA abundance of FADS1, FADS2, ELOVL2 and ELOVL5 support a recent study on cattle (Cherfaoui et al., Reference Cherfaoui, Durand, Bonnet, Cassar-Malek, Bauchart, Thomas and Gruffat2012) that suggests that the ruminant liver can efficiently convert 18:2n-6 or 18:3n-3 into longer-chain n-6 and n-3 FA. However, substantial differences between both pathways would most likely exist in the goat liver. For example, the high accumulation of 20:4n-6 and the relatively low 18:3n-6, 20:3n-6 and 22:4n-6 proportions suggest that 20:4n-6 elongation is a limiting step in long-chain n-6 PUFA synthesis in goats, whereas 20:5n-3, 22:5n-3 and 22:6n-3 (the end product of this pathway; Miyazaki and Ntambi, Reference Miyazaki and Ntambi2008) were all found in high proportions and comparable levels in hepatic tissue, independently of their different dietary supply (Figure 1). However, a study on bovines has shown different levels of accumulation of 20:5n-3, 22:5n-3 and 22:6n-3 in the liver (with a preferential accumulation of 22:5n-3; Cherfaoui et al., Reference Cherfaoui, Durand, Bonnet, Cassar-Malek, Bauchart, Thomas and Gruffat2012). Furthermore, the total n-3 PUFA proportion was 70% lower than the total n-6 PUFA in bovines (Cherfaoui et al., Reference Cherfaoui, Durand, Bonnet, Cassar-Malek, Bauchart, Thomas and Gruffat2012), whereas no major difference between the total concentration of n-6 and n-3 PUFA was observed in the hepatic tissue of goats (Figure 2). All together, these results suggest potential differences between ruminant species in FA elongation and desaturation in the liver.
The PPARA transcription factor, which has a role inducing FADS1 and FADS2 gene expression in hepatic tissue (Miyazaki and Ntambi, Reference Miyazaki and Ntambi2008), in addition to its involvement in β-oxidation of FA (Litherland et al., Reference Litherland, Bionaz, Wallace, Loor and Drackley2010), was relatively highly expressed in goat liver. LXRA could be another important transcription factor regulating lipogenic gene expression in the liver and is highly expressed in this tissue in goats (Figure 2) and bovines (Cherfaoui et al., Reference Cherfaoui, Durand, Bonnet, Cassar-Malek, Bauchart, Thomas and Gruffat2012). In the liver of goats, LXRA mRNA abundance was correlated to that of SP1 (r = 0.84, P = 0.008), but the specific role of this latter transcription factor in lipid metabolism in the liver of ruminants is not known yet.
The present experiment was conducted on goats at the end of the lactation cycle. Taking into account their positive energy balance (Bernard et al., Reference Bernard, Mouriot, Rouel, Glasser, Capitan, Pujos-Guillot, Chardigny and Chilliard2010) and the low concentration of plasma non-esterified FAs, it would be expected that AT lipogenesis was more important than lipolysis (Chilliard et al., Reference Chilliard, Gagliostro, Flechet, Lefaivre and Sebastian1991). Accordingly, CD36 was preferentially expressed in ATs, which is consistent with a relevant uptake of circulating FAs to reconstitute body reserves at the end of lactation.
As mentioned above, the ATs are major sites for Δ9-desaturation in ruminants; however, lower abundances of SCD1 mRNA in the omental and perirenal ATs of lactating goats compared with those in the mammary secretory tissue are in agreement with previous data in caprines (Bernard et al., Reference Bernard, Bonnet, Leroux, Shingfield and Chilliard2009), but no similar comparison is possible for the other gene isoform, SCD5. The mRNA abundance of the genes encoding for the other two desaturases studied, namely, FADS1 and FADS2, was much lower in the omental and perirenal ATs than in the liver (Figure 2), in accordance with their respective concentrations of n-3 PUFA (Figure 1). Relatively poor mRNA abundances of FADS1, FADS2, ELOVL5 and ELOVL2 have been also described in the intermuscular fat of cattle (Cherfaoui et al., Reference Cherfaoui, Durand, Bonnet, Cassar-Malek, Bauchart, Thomas and Gruffat2012). However, although only traces of ELOVL2 mRNA were detected in the AT of goats, the mRNA abundance of ELOVL5 did not differ between the AT and the liver (Figure 2). Thus, it can be speculated that part of the 22:5n-3 found in these sites (Figure 1) might be related to 20:5n-3 elongation via ELOVL5 protein activity (Miyazaki and Ntambi, Reference Miyazaki and Ntambi2008; Guillou et al., Reference Guillou, Zadravec, Martin and Jacobsson2010). In addition, the absence of ELOVL2, responsible for the subsequent elongation of 22:5n-3 (Guillou et al., Reference Guillou, Zadravec, Martin and Jacobsson2010), would also contribute to the appearance of this PUFA at higher levels in the AT of goats.
Among the transcription factors that have been characterised in ruminants, PPARG1 seems to be the major regulator of lipid metabolism in AT (Sundvold et al., Reference Sundvold, Brzozowska and Lien1997; Schmitt et al., Reference Schmitt, Ballou, Correa, DePeters, Drackley and Loor2011). In the present study, PPARG1 mRNA abundance was high in the omental and perirenal ATs, with no differences between them, whereas SREBF1 mRNA abundance, which could be involved in the anabolic pathways related to PPARG signalling in AT (Schmitt et al., Reference Schmitt, Ballou, Correa, DePeters, Drackley and Loor2011), was higher in the perirenal than in the omental site. Relatively high mRNA abundances of LXRA were found in both ATs; further, in the omental site, LXRA was also strongly correlated with CD36 and PPARA transcripts (r = 0.96, P < 0.001; and r = 0.91, P = 0.002, respectively), which suggests a similar regulation for each pair of genes.
All together, these results constitute a unique set of data on FA composition and mRNA abundances of candidate genes in four tissues involved in lipid metabolism in dairy ruminants. Nevertheless, the different lipid profiles and starch content of the two diets had few evident repercussions on the FA composition and abundance of the studied transcripts in goat tissues. In this regard, it should be noted that n-3 PUFAs are extensively metabolised in the rumen and their transfer from the diet to ruminant-derived products is always very limited (Chilliard et al., Reference Chilliard, Glasser, Ferlay, Bernard, Rouel and Doreau2007). Therefore, this would explain why feeding an SFO diet did not increase the very low concentrations of n-3 PUFA in the AT of goats, and agrees with previous results in cows fed low levels (<2% dry matter) of fish oil (Noci et al., Reference Noci, Monahan, Scollan and Moloney2007). On the other hand, the results on milk fat (Bernard et al., Reference Bernard, Mouriot, Rouel, Glasser, Capitan, Pujos-Guillot, Chardigny and Chilliard2010) were consistent with an inhibitory effect of the higher levels of 18:2n-6 in the SO (compared with the SFO) diet on mammary de novo FA synthesis. However, this response was not mediated by changes in the mRNA abundance of genes involved in FA uptake and de novo synthesis in the mammary tissue, in agreement with previous reports on goats fed sunflower-seed oil (Bernard et al., Reference Bernard, Rouel, Leroux, Ferlay, Faulconnier and Legrand2005a and Reference Bernard, Bonnet, Leroux, Shingfield and Chilliard2009). In the perirenal AT, however, feeding the goats the SFO diet reduced the mRNA abundance of FASN and increased that of CD36 (with a negative correlation between them; r = −0.79; P = 0.019), but this result was not related to changes in the relative proportions of de novo (⩽C14) and long-chain (⩾C18) FAs.
In the liver, the SFO diet reduced the mRNA abundance of SCD1, FADS2 and SLC27A6. In this regard, and despite the low mRNA abundance of SCD1 in both treatments, the reduction in the SCD1 transcript in the liver of goats fed the SFO diet could be related to the effect of n-3 PUFA from fish oil (Ahnadi et al., Reference Ahnadi, Beswick, Delbecchi, Kennelly and Lacasse2002) or to the higher amount of starch supplied by this diet (Bernard et al., Reference Bernard, Leroux, Rouel, Bonnet and Chilliard2012). It has been suggested that this inhibitory effect of carbohydrates on SCD1 mRNA abundance in the liver can be mediated by hormonal factors, such as leptinaemia (Lengi and Corl, Reference Lengi and Corl2007; Bernard et al., Reference Bernard, Leroux, Rouel, Bonnet and Chilliard2012), but no difference in the concentration of plasma leptin between the two experimental groups was observed in our study. On the other hand, the reduction in the mRNA abundance of FADS2 in the liver of goats fed the SFO diet, most likely caused by a negative effect of n-3 PUFA on the expression of this gene (Cho et al., Reference Cho, Nakamura and Clarke1999), might explain the decrease in the 18:3n-6 and 20:3n-6 concentrations in the liver, which could also be related to the lower supply of their precursor, 18:2n-6, in the SFO diet. In contrast, the different dietary treatments did not lead to changes in the mRNA abundance of the transcription factors regulating lipogenic gene expression (i.e. SREBF1, PPARG1, PPARA and LXR; Miyazaki and Ntambi, Reference Miyazaki and Ntambi2008), suggesting that the effects of the SFO diet on SCD1, FADS2 and SLC27A6 mRNA abundances are mediated via other mechanisms than through variation in the expression of these transcription factors. Thus, the study of the amount of protein and/or activity of lipogenic enzymes could provide further insight into the mechanisms by which dietary composition affects tissue lipid metabolism in lactating ruminants.
Conclusions
In conclusion, the data on mRNA abundances and FA profiles are in accordance with the specific physiological adaptation in the lipid metabolism of body tissues that is likely to occur during late lactation because of the coexistence of an active lipogenesis in the mammary secretory tissue and a significant anabolic activity in the omental and perirenal ATs. The mammary secretory tissue and, more markedly, the liver were characterised by relatively high PUFA concentrations. In the mammary tissue, the major PUFAs were C18 FAs, derived from plasma uptake. In the liver, C20 and C22 PUFAs were much more abundant, in accordance with the high mRNA abundances of FADS1, FADS2, ELOVL2 and ELOVL5, which encode the enzymes involved in very long-chain n-3 and n-6 PUFA synthesis. However, substantial differences between n-3 and n-6 pathways would most likely exist in the goat liver. Surprisingly, comparable ELOVL5 mRNA abundances were found in the liver and in the omental and perirenal ATs, despite the fact that the latter tissues were characterised by high concentrations of saturated FA and very low C20 and C22 PUFA levels.
The partial substitution of sunflower-seed oil by fish oil and the additional starch in the diet induced limited changes in the mRNA abundance of genes involved in lipid metabolism, and these were not associated with the few variations observed in tissue FA composition.
Acknowledgements
The present study was supported by the Agence Nationale de la Recherche (ANR, France; ANR-05-PNRA-No.5.E.24). P.G. Toral was granted a fellowship from the Fundación Alfonso Martín Escudero (Madrid, Spain). The authors gratefully acknowledge the staff of Unité Expérimentale des Ruminants de Theix (INRA, France) for the diligent care of the experimental animals and assistance in slaughtering, and J. Rouel, D. Bany, S. Bes, E. Tixier and M. Tourret from UMR 1213 Herbivores (INRA, France) for assistance in the management of the animals, sampling and laboratory analysis.
Supplementary materials
For supplementary material referred to in this article, please visit http://dx.doi.org/10.1017/S1751731113000049