1. Introduction
The stratigraphic variation of the 13C/12C values in marine carbonate (δ13Ccarb) is increasingly used as a correlation tool (Saltzman & Thomas, Reference Saltzman, Thomas, Gradstein, Ogg, Schmitz and Ogg2012) with carbon isotopic excursions, such as the pronounced negative carbon isotope excursion (CIE) at the Ypresian GSSP (Global Boundary Stratotype Section and Point) (base Eocene) (Vandenberghe et al. Reference Vandenberghe, Hilgen, Speijer, Gradstein, Ogg, Schmitz and Ogg2012), used as the primary means of global correlation. Similarly, where key stratigraphic boundaries remain undefined (e.g. large parts of the Cambrian (Peng & Babcock, Reference Peng and Babcock2011)) or useful biostratigraphic markers are facies-dependent (e.g. conodonts and graptolites within the Ordovician and Silurian (Bergström et al. Reference Bergström, Lehnert, Calner and Joachimski2012)) the identification and correlation of CIEs has significantly aided our ability to correlate. Indeed, our knowledge of the carbon isotopic record is such that standard δ13Ccarb curves are available for much of the Phanerozoic, including the Silurian (Cramer et al. Reference Cramer, Brett, Melchin, Männik, Kleffner, Mclaughlin, Loydell, Munnecke, Jeppsson, Corradini, Brunton and Saltzman2011; Melchin et al. Reference Melchin, Sadler, Cramer, Gradstein, Ogg, Schmitz and Ogg2012). However, the generalized character of these standard curves masks significant local variations in the magnitude and morphology of many CIEs (e.g. Buggisch & Mann, Reference Buggisch and Mann2004, figs 12, 13; Price et al. Reference Price, Főzy and Pálfy2016, figs 6, 8). In particular, sedimentation upon carbonate platforms is typically dominated by biogenic benthic shallow-water carbonate producers, with the associated heterogeneity of carbonate platforms (e.g. lagoons, shoals, intershelf basins, barrier reefs, patch reefs) resulting in much local isotopic variability. These local isotopic variations are principally related to palaeobathymetry and its impact upon the types of carbonate producers, carbonate sedimentation and production rates and the exchange of waters between isotopically different reservoirs (e.g. open-ocean versus epicontinental seas), as well as secondary diagenetic processes (e.g. Holmden et al. Reference Holmden, Creaser, Muehlenbachs, Leslie and Bergstrom1998; Da Silva & Boulvain, Reference Da Silva and Boulvain2008; Swart, Reference Swart2008; Weissert et al. Reference Weissert, Joachimski and Sarnthein2008; Saltzman & Thomas, Reference Saltzman, Thomas, Gradstein, Ogg, Schmitz and Ogg2012). For example, within the Silurian Baltic Basin absolute δ13Ccarb values of the Homerian Carbon Isotope Excursion are generally observed to decrease with increasing palaeobathymetry, with peak values more than 4 ‰ within lagoonal settings decreasing to less than 1 ‰ within the outer shelf (Jarochowska & Munnecke, Reference Jarochowska and Munnecke2015). While these changes are geographically rather gradual across the low-relief ramp topography of the Baltic Basin (on average −1 ‰ per 100 km within the East Baltic), the localized response of carbonate factories to episodes of sea-level change can result in rapid temporal and spatial changes in palaeobathymetry and isotopic values. For example, a sea-level fall may result in the rapid progradation of isotopically heavier shallow marine carbonates into a deeper-water isotopically lighter setting. Similarly, a sea-level rise may result in all or parts of the carbonate platform back-stepping, giving up, catching up or keeping up, each with their own influence on palaeobathymetry and isotopic values. Thus, the local responses of a carbonate platform to sea-level change will result in local isotopic variations and hinder our ability to clearly establish the onset, termination and internal subdivisions of CIEs and therefore our ability to correlate CIEs.
Here we demonstrate the carbon isotope variability associated with a well-known Silurian CIE (Homerian Carbon Isotope Excursion; also termed the Mulde Carbon Isotope Excursion by some authors), as expressed on a relatively small Silurian carbonate platform (Midland Platform, Avalonia) and within an age-synchronous platform interior carbonate succession (Much Wenlock Limestone Formation) (Fig. 1). Based upon a high-resolution sequence-stratigraphic and bentonite framework, it is apparent that local variations in relative sea-level influence the magnitude and morphology of the carbon isotopic record (δ13Ccarb) within marine carbonate rocks.
Locality maps for the Midland Platform. (a) Areas attributed to the Midland Platform and Welsh Basin showing the broad location of the study area. (b) Outcrop of the Much Wenlock Limestone Formation across the northern and central part of the Midland Platform with study areas located. (c) The Storridge and Suckley (Hereford–Worcestershire) areas showing the location of measured sections at Whitman’s Hill Quarry (SO 7490 4830) and Bruff Business Park (SO 7365 5065); (d) The Dudley (West Midlands) area showing the location of measured sections at Castle Hill, Wren’s Nest Hill and Mons Hill: Castle Mill Basin (CMB) (SO 9454 9164), Reef Knoll Stairwell (RKS) (SO 9363 9202), Lower NCC Cutting (LNC) (SO 9380 9222), Seven Sisters Quarry North (SSQ) (SO 9358 9188), Upper NCC Cutting (UNC) (SO 9382 9222), Reef Knoll Quarry (RKQ) (SO 9356 9200 and SO 9358 9210), Snake Pit Quarry (SPQ) (SO 9383 9228) and Lion’s Mouth Cavern (LMC) (SO 9354 9161).

2. Geological setting
The upper Wenlock Series (Homerian Stage) Much Wenlock Limestone Formation (MWLF) reflects shallow-marine mixed carbonate and siliciclastic deposition upon the gently subsiding Midland Platform of eastern Avalonia (Bassett et al. Reference Bassett, Bluck, Cave, Holland, Lawson, Cope, Ingham and Rawson1992). During Homerian times the Midland Platform was within the tropics, situated some 13° S of the equator (Torsvik et al. Reference Torsvik, Trench, Svensson and Walderhaug1993), as reflected by an abundance of tropical patch-reefs and a diverse fossil biota (Ratcliffe & Thomas, Reference Ratcliffe and Thomas1999; Ray & Thomas, Reference Ray and Thomas2007). In general terms, the MWLF thins and shows diachroneity between the platform interior and its western margin with the Welsh Basin. Within the platform interior the MWLF achieves a thickness of 37 to 57 m and broadly corresponds to the latest Cyrtograptus lundgreni to Colonograptus ludensis graptolite biozones (Fry et al. Reference Fry, Ray, Wheeley, Boomer, Jarochowska and Loydell2017). In addition, the MWLF has been subdivided into three members (Lower Quarried Limestone, Nodular Beds and Upper Quarried Limestone members) according to the relative abundances of limestone and silty-mudstone, with such variations broadly reflecting episodes of relative sea-level change. Lastly, the MWLF is under- and overlain by thick successions of occasionally graptolitic silty mudstone, the Coalbrookdale and Lower Elton formations respectively. The transitional facies between these silty mudstones and the MWLF have been informally and locally referred to as the Basement Beds and Passage Beds (Butler, Reference Butler1939), and their local inclusion in the MWLF has resulted in minor diachroneity across the platform interior. As a means of removing this diachroneity and synchronizing litho- and chronostratigraphy, we consider the locally identifiable Basement Beds as belonging to the uppermost Coalbrookdale Formation, and the regionally identifiable Passage Beds as belonging to the uppermost MWLF.
Previous carbon isotope studies of the Midland Platform have documented the dual peaked Homerian CIE, with the most extensive records derived from the Silurian inliers of the Dudley area, West Midlands (Corfield et al. Reference Corfield, Siveter, Cartlidge and McKerrow1992; Marshall et al. Reference Marshall, Thomas, Boomer and Ray2012). In addition, parts of the Homerian CIE have been documented elsewhere upon the Midland Platform, with records from the type Wenlock and Ludlow areas (Much Wenlock and Ludlow) being particularly important for age calibration (Blain et al. Reference Blain, Ray and Wheeley2016; Fry et al. Reference Fry, Ray, Wheeley, Boomer, Jarochowska and Loydell2017).
2.a. Stratigraphic precision within the study area
The ability to accurately resolve the stratigraphic record is critical to understanding past global change and the variability of the carbon isotopic record. Unfortunately, for the majority of Wenlock sections that document the Homerian CIE the stratigraphic resolution is less than that required to test such variability, with the result that the peaks and troughs in the carbon isotopic record are considered near-isochronous and form the basis of correlation. However, high-resolution stratigraphic techniques such as the correlation of changes in sea-level caused by Milankovitch forcing of ice sheet dynamics and the correlation of volcanic ash layers can approach isochronous correlation, and can therefore be used to examine differences between local carbon isotopic curves.
The sections described herein are from the Dudley (West Midlands), Storridge and Suckley (Hereford–Worcestershire) areas and are considered characteristic of the platform interior (Fig. 1b), in that they reflect the earliest onset of the deposition of the MWLF, which begins with an interval of microbial carbonates (Lower Quarried Limestone Member) indicative of restricted circulation within a platform interior setting (Ratcliffe, Reference Ratcliffe1988). Based upon comparison with the Geologic Time Scale 2012 (Melchin et al. Reference Melchin, Sadler, Cramer, Gradstein, Ogg, Schmitz and Ogg2012) and the alternative absolute age determinations of Cramer et al. (Reference Cramer, Condon, Söderlund, Marshall, Worton, Thomas, Calner, Ray, Perrier, Boomer, Patchett and Jeppsson2012), the MWLF and the Homerian CIE likely equate to an interval of 0.6 to 1.9 million years, with a high-resolution radioisotopic date from near the top of the MWLF at Dudley providing an in situ upper absolute age limit of 427.86 ± 0.32 Ma (Cramer et al. Reference Cramer, Condon, Söderlund, Marshall, Worton, Thomas, Calner, Ray, Perrier, Boomer, Patchett and Jeppsson2012). Correlation between these sections (c. 48 km between the most distal sections) has been achieved by means of high-resolution sequence stratigraphy and the geochemical correlation of a prominent volcanic ash horizon (bentonite) within the middle of the formation.
The details of correlation across the study area are given in Ray et al. (Reference Ray, Richards, Brett, Morton and Brown2013), but are summarized here. In terms of sequence stratigraphy, the MWLF is represented by two regressive episodes separated by a marked transgression. These broad sea-level changes are well documented from a number of palaeocontinents (e.g. Avalonia, Baltica, Gondwana and Laurentia) and are considered to be eustatic in nature (e.g. Johnson, Reference Johnson2006). The expression of these eustatic variations across the study area and the wider Midland Platform (e.g. Ray et al. Reference Ray, Brett, Thomas and Collings2010, Reference Ray, Richards, Brett, Morton and Brown2013; Fry et al. Reference Fry, Ray, Wheeley, Boomer, Jarochowska and Loydell2017) allows the MWLF to be subdivided into sequence-stratigraphic systems tracts (see Simmons, Reference Simmons, Gradstein, Ogg, Schmitz and Ogg2012) according to the rate and direction of sea-level change. Furthermore, each systems tract (i.e. transgressive, highstand and falling stage systems tracts) has been further subdivided into multiple upward-shallowing cycles (parasequences), which can be distinguished from each other and correlated according to differences in thickness and the magnitude of relative sea-level change. Thus, sea-level trends may be observed through successive parasequences, and these stacking patterns reflect broader lithological trends that are expressed as systems tracts. Such correlations allow for the subdivision of the MWLF into 12 parasequences (PS1 to PS12) and, based upon a 0.6 to 1.9 Ma duration for the MWLF, suggest a mean parasequence duration in the order of 50 to 150 ka. Accordingly, it seems likely that the parasequences, being part of a broader eustatic trend, may be reflective of short eccentricity Milankovitch cycles of ~100 ka duration and are therefore suitable for high-resolution correlation.
The sequence-stratigraphic subdivision and correlation of the MWLF has been additionally confirmed by the geochemical fingerprinting and correlation of volcanic ash layers (bentonites; also termed K-bentonites or metabentonites by some authors). The correlation of bentonites within the MWLF is of particular significance in that the deposition of the bulk of volcanic ejecta can be considered instantaneous on geological timescales (see Huff, Reference Huff2016). Across the study area the presence of volcanic apatite crystals within the bentonites and the rare earth element (REE) geochemical signature of the apatite crystals has been used as a means of distinguishing between individual bentonites (Ray et al. Reference Ray, Richards, Brett, Morton and Brown2013). In particular, apatite REE data from most bentonites within the MWLF probably originated from a granodiorite magmatic source, with the exception of a bentonite horizon within the middle of the formation that has a distinctively mafic composition, more akin to that of a gabbro or syenite. This distinctively mafic bentonite has been geochemically identified in sections at Dudley (Wren’s Nest Hill) and Storridge (Whitman’s Hill) and occurs in the flooding interval at the base of parasequence 8 (PS8), thereby confirming the near-isochronous deposition of PS8, the highstand systems tract and the Nodular Beds Member. In addition, this bentonite is notably thicker than the majority of other bentonites (120–200 mm), thereby allowing for easy identification in other sections across the area, including in the Bruff Business Park section (Ray et al. Reference Ray, Richards, Brett, Morton and Brown2013).
Within the wider Wenlock of the Midland Platform, bentonite geochemistry has also been used to confirm the synchronicity of sequence-stratigraphic correlations. For example, a bentonite has been correlated within the MWLF from Dudley (West Midlands) to Wenlock Edge (Shropshire) and confirms the correlation of PS10 over a distance of c. 40 km (Ray et al. Reference Ray, Collings, Worton and Jones2011). Similarly, within the lower Wenlock a bentonite has been used to confirm the correlation of a parasequence (cycle 5) within the uppermost Buildwas and Woolhope Limestone formations, over a distance of 62 km (Hughes & Ray, Reference Hughes and Ray2016). Based upon these combined bentonite-sequence stratigraphic studies it is apparent that the parasequences of the Midland Platform represent discrete and approximately age-synchronous depositional episodes that likely result from Milankovitch cycles (i.e. short eccentricity), and as such are ideal for the comparison of carbon isotopic values across the study area.
3. Sampling and analytical methods
The succession of Hereford–Worcestershire has not previously been subject to detailed carbon isotopic analysis and has consequently formed the focus of our sampling efforts (Fig. 1c). The Whitman’s Hill Quarry contains the uppermost Coalbrookdale Formation (15.8 m) and the lower two-thirds of the MWLF (24.4 m), and has been sampled in its entirety. Approximately 2.5 km N-NW of Whitman’s Hill is the Bruff Business Park section which contains the whole of the MWLF, as well as parts of the under- and overlying formations. Owing to faulting near the base of the MWLF (Fig. 2), our sampling has focused upon the interval above this fault zone and immediately above a distinctively thick (120 mm) and a regionally traceable marker bentonite (WH9 of Ray et al. Reference Ray, Richards, Brett, Morton and Brown2013). Accordingly, at Bruff Business Park the upper half of the MWLF (21.9 m) and the basal Lower Elton Formation (8.2 m) has been sampled. In combining samples from both Whitman’s Hill Quarry and Bruff Business Park, a local composite carbon isotope curve has been made and, based upon the correlation of the marker bentonite and parasequences, there is an approximate sampling overlap of 6 m between sections. In terms of sedimentology, the results of hand-specimen analysis and a limited number of thin-sections have previously been reported for the Hereford–Worcestershire succession (Penn, Reference Penn1971; Ray et al. Reference Ray, Richards, Brett, Morton and Brown2013; Päßler et al. Reference Päßler, Jarochowska, Ray, Munnecke and Worton2014), alongside more regional studies (Phipps & Reeve, Reference Phipps and Reeve1967). However, as a means of further improving our understanding of the succession, a number of thin-sections were created to confirm and improve upon the existing sedimentological descriptions and to investigate intervals that show considerable regional variability and may consequently impact upon the local carbon isotopic signature.
Stratigraphic overview of Whitman’s Hill Quarry and Bruff Business Park modified from Ray et al. (Reference Ray, Richards, Brett, Morton and Brown2013), showing the carbon isotopic values, the position of parasequences (PS), bentonite correlations (Marker Bentonite), lithostratigraphic units and transitional intervals (Passage Beds).

Given the existing and detailed sedimentological (Butler, Reference Butler1939; Oliver, Reference Oliver1981; Ratcliffe, Reference Ratcliffe1988; Ratcliffe & Thomas, Reference Ratcliffe and Thomas1999; Ray & Thomas, Reference Ray and Thomas2007; Ray et al. Reference Ray, Brett, Thomas and Collings2010) and carbon isotopic records (Corfield et al. Reference Corfield, Siveter, Cartlidge and McKerrow1992; Marshall et al. Reference Marshall, Thomas, Boomer and Ray2012) from the Dudley area (West Midlands), a duplication of such works would superficially be of limited merit. However, a comparison of the carbon isotopic record of Corfield et al. (Reference Corfield, Siveter, Cartlidge and McKerrow1992) and Marshall et al. (Reference Marshall, Thomas, Boomer and Ray2012) reveals some differences in the shape of the resultant curves. Furthermore, while only the curve of Marshall et al. (Reference Marshall, Thomas, Boomer and Ray2012) has been linked to the available sequence-stratigraphic record, it has been shown by Blain et al. (Reference Blain, Ray and Wheeley2016, p. 729) that there may be a degree of uncertainty as to the exact position of the carbon isotopic data and the parasequences identified by Ray et al. (Reference Ray, Brett, Thomas and Collings2010). Finally, both curves are based upon sections which contain minor faulting, particularly at the lower and upper boundaries of the MWLF, and are also reliant on accurate correlation between sections. In the case of Corfield et al. (Reference Corfield, Siveter, Cartlidge and McKerrow1992) it is apparent that the use of the trench and quarry face on the eastern side of Wren’s Nest Hill (SO 9382 9220) would have likely resulted in c. 5 m of the uppermost Nodular Beds Member being unaccounted for in their curve (Ray et al. Reference Ray, Brett, Thomas and Collings2010, p. 139).
While the previously published carbon isotope curves demonstrate the broad nature of the Homerian CIE, it is unclear how accurately they relate to the parasequences established within the Dudley area, and therefore with the data collected from Hereford–Worcestershire. Thus, in order to confirm the isotopic trends within each parasequence we have resampled the succession. In particular, we have undertaken high-resolution sampling (typically 0.20 m or less) across the formation boundaries (Coalbrookdale, Much Wenlock Limestone and Lower Elton formations) and somewhat lower-resolution sampling (typically every 0.50 m) for the remainder of the succession. Such a sampling strategy is intended to improve upon the stratigraphic resolution of the onset and termination of the Homerian CIE (across the formation boundaries), as well as to determine the broad isotopic trend within the remainder of the succession.
Alongside isotopic sampling within the Dudley area, a limited number of thin-sections were created to improve upon previous descriptions (e.g. Oliver, Reference Oliver1981; Ratcliffe, Reference Ratcliffe1988; Ratcliffe & Thomas, Reference Ratcliffe and Thomas1999) and link more precisely to the sequence-stratigraphic units described by Ray et al. (Reference Ray, Richards, Brett, Morton and Brown2013). In particular, we have focused upon the Basement and Passage beds as these represent intervals of significant lithological and environmental change.
After collecting limestone samples from the Hereford–Worcestershire and West Midlands areas, stable carbon and oxygen stable isotope measurements were carried out in the stable isotope laboratory of the GeoZentrum Nordbayern, Erlangen, Germany. Unweathered samples of vein-free bulk rock were powdered using a hand drill. This method of analysing bulk rock for stable isotopes, which inevitably does contain some skeletal material, has been shown to provide reliable results in other Silurian studies (e.g. Cramer et al. Reference Cramer, Kleffner and Saltzman2006; Kaljo & Martma, Reference Kaljo and Martma2006; Hughes & Ray, Reference Hughes and Ray2016). The carbonate powders were reacted with 100% phosphoric acid at 70 °C using a Gasbench II connected to a Thermo Finnigan Five Plus mass spectrometer. All values are reported in per mille relative to V-PDB by assigning δ13C and δ18O values of +1.95 ‰ and −2.20 ‰ to international standard NBS19 and −46.6 ‰ and 26.7 ‰ to international standard LSVEC, respectively. Reproducibility and accuracy were monitored by replicate analysis of laboratory standards calibrated to NBS19 and LSVEC and were better than ±0.06 ‰ (1σ) and ±0.04 ‰ (1σ), respectively. In total, 459 of the analysed samples provided geochemical results, typically at sample spacing of 0.1 to 0.5 m (Supplementary Material available online at https://doi.org/10.1017/S0016756819001146).
3.a. Whitman’s Hill and Bruff Business Park carbon isotope stratigraphy
Carbon isotope values in the upper part of the Coalbrookdale Formation are rather variable and range between −1.3 ‰ and 1.8 ‰ δ13Ccarb (Fig. 2). Broadly there is a positive trend within the formation, but it is only within the uppermost 1.0 m that values start to exceed 1.0 ‰. Within the basal 0.9 m of the Lower Quarried Limestone Member (MWLF) (15.64–16.54 m), values increase from 0.9 ‰ to 4.6 ‰ and correspond to the onset of the Homerian CIE. This marked positive shift in values takes place within the basal parasequence (PS1) of the MWLF, and a peak value of 4.8 ‰ is achieved in the overlying parasequence (PS2). From this peak (lower peak of the Homerian CIE), values progressively fall throughout the remainder of the Lower Quarried Limestone Member (PS2 to PS5) and into the Nodular Beds Member, as exposed at Whitman’s Hill (PS6 to basal PS10), with values falling to c. 1.7 ‰ by the top of the section. Particularly notable features of this fall in values are its uniform nature and its occasional punctuation by more negative values, the most notable of which (occurs across multiple samples) is high within PS7.
At Bruff Business Park (Fig. 2) the overlapping part of the succession (PS8 to basal PS10) appears to show the continuation of the decline in values observed at Whitman’s Hill. Based upon a consideration of both sections, this trend ends around the PS9–PS10 boundary, above which values rise from 1.7 ‰ to 3.0 ‰ (Bruff Business Park 9.60–15.10 m) towards the top of PS10 and within the lower part of the Upper Quarried limestone Member. This peak corresponds to the upper peak of the Homerian CIE, above which values progressively fall throughout the remainder of the MWLF and into the basal Lower Elton Formation. Broadly the apparent rate of fall is greatest within the Passage Beds of the Upper Quarried Limestone Member (PS12), indicating that the Homerian CIE ends at the top of the MWLF. Within the Lower Elton Formation, values are still elevated when compared with the pre-excursion Coalbrookdale Formation and range from 1.0 ‰ to 1.9 ‰.
3.b. The Dudley area carbon isotope stratigraphy
The succession within the Dudley area (Castle Hill, Wren’s Nest Hill and Mons Hill) has been uplifted, folded and faulted during the Caledonian and the Variscan orogenies and outcrops in a series of discontinuous quarries. Consequently no one outcrop offers access to the entirety of the succession. Here we document both the carbon isotopic trends and the correlations necessary to stitch together this composite carbon isotope curve (Figs 1d, 3).
Stratigraphic overview of the Dudley area modified from Ray et al. (Reference Ray, Richards, Brett, Morton and Brown2013), showing the position of the measured sections, carbon isotopic values, the position of parasequences (PS), marker bentonite beds (WNH), lithostratigraphic units and transitional intervals (Basement and Passage beds) (see Fig. 2 for the key). Within the study area are the following systems tracts and their bounding surfaces: SB/TS – sequence boundary and combined transgressive surface; ETST – early transgressive systems tract; SMSS – surface of maximum sediment starvation; LTST – late transgressive systems tract; MFS – maximum flooding surface; HST – highstand systems tract; SFR – surface of forced regression; FSST – falling stage systems tract.

The stratigraphically lowest part of the succession has been investigated at the Castle Mill Basin (Castle Hill) and the Reef Knoll Stairwell (Wren’s Nest Hill). Here the sections contain the transitional interval between the Coalbrookdale Formation and Lower Quarried Limestone Member (MWLF). In addition, as neither section was sampled by Corfield et al. (Reference Corfield, Siveter, Cartlidge and McKerrow1992) or Marshall et al. (Reference Marshall, Thomas, Boomer and Ray2012), they provide additional documentation of the onset of the Homerian CIE within the Dudley area.
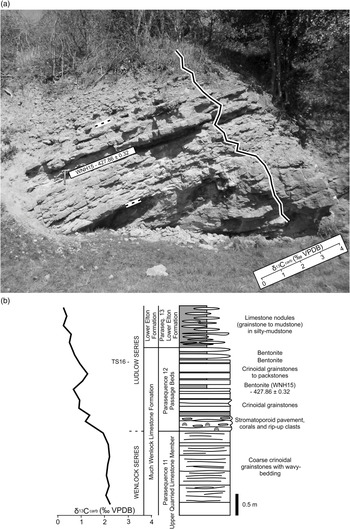
The Castle Mill Basin succession is the most stratigraphically extensive of the sections (Fig. 4a, b) and one the most complete in the area (location CH12 of Butler, Reference Butler1939). It begins within the uppermost Coalbrookdale Formation (2.60 m). The Coalbrookdale Formation isotopic values initially range from 0.8 ‰ to 1.7 ‰ δ13Ccarb, before rising markedly from 1.4 ‰ to 3.1 ‰ within the Basement Beds. Unfortunately, a 1.00 m interval of no-exposure within the section corresponds to the boundary between the Coalbrookdale Formation and Lower Quarried Limestone Member, but values continue to rise into the lowest MWLF to an initial peak of 3.9 ‰ (3.80 m), above which the rate of rise is reduced. Such an arrangement indicates that the onset of the Homerian CIE broadly corresponds to the Coalbrookdale – Much Wenlock Limestone formation boundary, but begins in the uppermost Coalbrookdale Formation (Basement Beds). Stratigraphically above, values briefly remain between 3.5 ‰ and 3.9 ‰, before dropping to −0.8 ‰ (5.00 m). This pronounced negative excursion occurs over a 0.8 m interval, above which values rebound and continue to rise to a maximum value of 4.2 ‰, albeit with significantly more variability (between 1.7 ‰ and 4.2 ‰); these isotopic variations are likely reflective of lithological variability in association with bioherms.
The carbon isotopic record across the Coalbrookdale – Much Wenlock Limestone Formation boundary at Dudley. (a) The Castle Mill Basin section (Wren’s Nest Tunnel Portal) and the carbon isotopic record. (b) Stratigraphic overview of Castle Mill Basin section.

The Reef Knoll Stairwell section contains only 0.68 m of the succession that approximates to the boundary between the Coalbrookdale Formation and the MWLF (Fig. 3). As with the Castle Mill Basin section, values show a marked increase in isotopic values, with the stratigraphically lowest and highest values typical of this trend (0.7 ‰ to 2.1 ‰). Based upon a comparison with the absolute isotopic values taken from the Castle Mill Basin section, this small outcrop likely corresponds to a prominent grainstone lens within the Basement Beds, rather than the base of the Lower Quarried Limestone Member.
Lower NCC Cutting at Wren’s Nest Hill occurs at the northern end of a trench, cut to extract the Lower Quarried Limestone Member. This section contains minor faulting at the base of the Lower Quarried Limestone Member and in the immediately overlying Nodular Beds Member. Correlation with the Castle Mill Basin section has been achieved by the correlation of a bentonite (WNH2; Ray et al. Reference Ray, Collings, Worton and Jones2011) between the sections. This bentonite and an immediately overlying bentonite are key markers within the Lower Quarried Limestone Member of the Dudley area and occur within PS2. In addition, measurements from the base of the Lower Quarried Limestone Member to the bentonite are consistent between the sections. This part of the isotopic curve begins immediately below the marker bentonite (WHN2) and shows a continued rise in δ13Ccarb values to 5.5 ‰ by the top of PS2. Above, values initially plateau within PS3 before progressively declining (minimum value of 2.5 ‰) through to the top of PS5, the end of the measured section and the top of the Lower Quarried Limestone Member.
The boundary between the Lower Quarried Limestone and Nodular Beds member is commonly faulted and appears particularly unpromising in the Lower NCC Cutting. Of the sections available, a pillar in limestone workings near the Seven Sisters Caverns (Seven Sisters Quarry North) offers the most complete and accessible example of PS6 and the base of the Nodular Beds Member, despite some minor quarrying-related slumping at its base. Within PS6 the decline in δ13Ccarb values continues to a low of 2.2 ‰ by the top of the parasequence.
Parasequences 7 to 9 can be accessed in their entirety within the Upper NCC Cutting (a continuation of the Lower NCC Cutting above the faulted interval). Here values continue to decline to a clear trough within the upper part of PS7 (minimum value of −0.6 ‰ at 4.00 m). Above, values rapidly rise through the remainder of PS7 and peak in PS8 at 2.6 ‰. Values then fall slightly within the lower part of PS9 to a secondary trough (minimum value of 1.7 ‰ at 9.00 m), above which values again rise towards the top of PS9, with values above 3.0 ‰.
The lower part of PS10 occurs in the Upper NCC Cutting and can be traced across the Dudley area by the presence of a prominent hardground and bentonite (WHN10; Ray et al. Reference Ray, Collings, Worton and Jones2011) at its base and an overlying succession containing multiple bentonite horizons. In order to access the entirety of PS10, two sections within the large Reef Knoll Quarry (Wren’s Nest Hill) have been used, with the highly distinctive Clematocrinus Bed (see Ray & Thomas, Reference Ray and Thomas2007) used to precisely tie the sections together. Within PS10, isotopic values continue to rise, with peak values (3.8 ‰) achieved within the lower 4.0 m of the parasequence. This peak corresponds to the upper peak of the Homerian CIE, above which values progressively fall throughout the remainder of the PS10 and the MWLF.
The transition from the Nodular Beds Member to the Upper Quarried Limestone Member takes place c. 0.5 m below the Ripple Beds (a highly distinctive mega-rippled grainstone bed). This distinctive bed marks the top of the measured section in the Reef Knoll Quarry and allows for correlation to Snake Pit Quarry (Mons Hill) where the entirety of PS11 can be accessed. Here PS11 broadly reflects a plateau in isotopic values, with most values slightly above 2.0 ‰.
The boundary between PS11 and PS12 and the transition between the Upper Quarried Limestone Member (MWLF) and the Lower Elton Formation is faulted in Snake Pit Quarry. Accordingly, the stratigraphically overlapping Lion’s Mouth Cavern section (Wren’s Nest Hill) has been used to document this transition, with the widely traceable stromatoporoid pavement at the base of PS12 used to correlate between sections. In addition, as the boundary between PS11 and PS12 is considered to approximate to the Wenlock–Ludlow Series boundary (Blain et al. Reference Blain, Ray and Wheeley2016), a 1.7 m overlap in stratigraphic position of isotope samples was made to demonstrate the correlation between the sections. Furthermore, the isotopic sampling of the entirety of the Lion’s Mouth Cavern section was considered important as it has not previously been analysed for carbon isotopes and contains a high-resolution radioisotopic date (Cramer et al. Reference Cramer, Condon, Söderlund, Marshall, Worton, Thomas, Calner, Ray, Perrier, Boomer, Patchett and Jeppsson2012) (Figs 3, 5). Within the Lion’s Mouth Cavern section, δ13Ccarb values in the Upper Quarried Limestone Member initially range from 2.2 ‰ to 1.9 ‰ (0.00 m to 1.68 m) and occur within the upper part of PS11. Above, values fall markedly to 0.6 ‰ (2.71 m) within the lower part of PS12 (Passage Beds) and are considered to correspond to the end of the Homerian CIE. Values then recover slightly to a minor peak of 1.2 ‰, before falling again into the basal Lower Elton Formation (PS13) to a minimum value of 0.2 ‰.
The carbon isotopic record across the Much Wenlock Limestone – Lower Elton Formation boundary at Dudley. (a) The Lion’s Mouth Cavern section and the carbon isotopic record. (b) Stratigraphic overview of the Lion’s Mouth Cavern section.

4. A comparison of composite carbon isotope curves from Hereford–Worcestershire and the West Midlands
In a broad sense, the Homerian CIEs as identified in both Hereford–Worcestershire (Storridge and Suckley) and the West Midlands (Dudley) show rather similar features (Fig. 6), in that they identify a dual-peaked positive excursion that is chiefly confined to the MWLF, with peak values achieved near the bottom and top of the formation. However, in detail there are a number of notable differences, which can be stratigraphically located by the correlation of parasequences (Ray et al. Reference Ray, Richards, Brett, Morton and Brown2013). For example, onset of the Homerian CIE in both sections takes place close to the Coalbrookdale – Much Wenlock Limestone formation boundary, but within the West Midlands a pronounced rise in values from 1 ‰ to 3 ‰, which may be taken at the onset of the CIE, occurs within the Basement Beds (PS0; uppermost Coalbrookdale Formation), while in Hereford–Worcestershire the same positive shift in values occurs within the basal Lower Quarried Limestone Member (PS1; basal MWLF). Above, both areas show a continued rise in carbon isotopic values within PS1 of the Lower Quarried Limestone Member, with peak values achieved within PS2. However, while the position of the lower peak of the Homerian CIE is consistent with respect to the parasequence assignment, the absolute maximum values of the lower peak are 0.7 ‰ higher in the West Midlands area. A gradual decline in values from the Lower Quarried Limestone Member into the Nodular Beds Member is observed in both areas, but with the broad trough (minimum) in values occurring in PS7 in the West Midlands and around the PS9–PS10 boundary in Hereford–Worcestershire. Notably, the trough in values in the West Midlands has an obvious equivalent within PS7 in Hereford–Worcestershire, the correlation of which is strongly supported by the immediately overlying bentonite correlation. Similarly, the main trough in values in Hereford–Worcestershire appears to be equivalent to a secondary trough in values within PS9 in the West Midlands, above which values increase to the upper peak of the Homerian CIE. The upper peak of the Homerian CIE occurs within PS10, but within the middle part of the parasequence in the West Midlands and near its top in Hereford–Worcestershire. In addition, the maximum isotope values associated with the upper peak are 0.8 ‰ higher in West Midlands. Finally, the decline in values towards the end of the CIE shows considerable similarities to the excursion ending within the Passage Beds (PS12).
A comparison between the composite carbon isotopic curves derived from the Hereford–Worcestershire (Storridge and Suckley) and the West Midlands (Dudley) areas (see Fig. 2 for the key).

As outlined above, the Homerian CIEs, as identified in both Hereford–Worcestershire and West Midlands, show notable differences superimposed upon a common trend. The origin of such apparent differences in carbon isotopic trends may be interpretative (e.g. identifying the start and finish of a CIE), the impact of palaeobathymetry upon the carbon isotopic values, or primary and diagenetic rock mineralogy. Using the high-resolution stratigraphic framework outlined above, we will investigate variation in palaeobathymetry across the study area and assess their impact upon carbon isotopic values. Mineralogy and diagenetic overprints are further qualitatively assessed in thin-sections.
5. Facies, depositional environments and relative sea-level change
Interpretations of facies, depositional environments and relative sea-level change have been previously published for the Storridge, Suckley (Hereford–Worcestershire) and Dudley (West Midlands) areas (e.g. Butler, Reference Butler1939; Phipps & Reeve, Reference Phipps and Reeve1967; Oliver, Reference Oliver1981; Ratcliffe, Reference Ratcliffe1988; Ratcliffe & Thomas, Reference Ratcliffe and Thomas1999; Ray & Thomas, Reference Ray and Thomas2007; Ray et al. Reference Ray, Brett, Thomas and Collings2010, Reference Ray, Richards, Brett, Morton and Brown2013; Päßler et al. Reference Päßler, Jarochowska, Ray, Munnecke and Worton2014; Jarochowska et al. Reference Jarochowska, Ray, Röstel, Worton and Munnecke2018). Therefore, here we provide an overview with a focus upon those parts of the succession that show considerable regional variability and may consequently impact upon the local carbon isotopic signature (Figs 2, 3, 6).
5.a. Coalbrookdale Formation
The Coalbrookdale Formation is more than 200 m thick within the platform interior (Cocks et al. Reference Cocks, Holland and Rickards1992), though poor exposure typically restricts access to all but a few metres below the base of the MWLF. Across the platform interior, the transition between the outer-shelfal silty mudstones of the Coalbrookdale Formation and the inner-shelfal carbonates of the MWLF represents a major relative sea-level fall and sequence boundary of probable eustatic origin (see Johnson, Reference Johnson2006). However, in detail, a limestone-rich uppermost few metres to the Coalbrookdale Formation is only well-developed within the Dudley area (the Basement Beds), suggesting a slightly shallower depositional setting in this area, when compared to Whitman’s Hill Quarry (Hereford–Worcestershire).
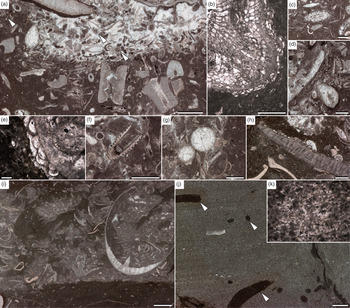
Thin-section analysis of this interval further supports this interpretation of the uppermost Coalbrookdale Formation. At Whitman’s Hill Quarry thin-sections (Figs 2, Fig. 7) reveal mudstones with an admixture of silt-sized quartz grains and with lenses of bioclastic packstone to floatstone bounded by erosional surfaces (Fig. 7i). Near the very top of the formation layers, nodules of laminated, very well-sorted, fine-grained peloidal grainstones with rare subplanar burrowing traces (Fig. 7j, k) are present. In addition, bioclasts are commonly encrusted by the problematicum Allonema (Fig. 7h).
Microfacies of the uppermost part of the Coalbrookdale Formation (see Figs 2, 4 for thin-section (TS) locations). (a) Transition from crinoidal wacke- to grainstone; arrows point to Rhabdoporella, thin-section 2 (TS2), Castle Mill Basin, scale bar 1 mm. (b) Bryozoan encrusted with Allonema, thin-section 1 (TS1), Castle Mill Basin, scale bar 500 µm. (c) Calcareous green alga Dimorphosiphon?, thin-section 1 (TS1), Castle Mill Basin, scale bar 750 μm. (d) Crinoidal packstone with recrystallized shells encrusted with Rothpletzella, thin-section 2 (TS2), Castle Mill Basin, scale bar 100 μm. (e) Close-up of Allonema in (b), scale bar 200 µm. (f) Tentaculite, thin-section 2 (TS2), Castle Mill Basin, scale bar 1 mm. (g) Spherical unidentified components with thin recrystallized walls, thin-section 3 (TS3), Castle Mill Basin, scale bar 1 mm. (h) Brachiopod shell encrusted with Allonema, thin-section 4 (TS4), Whitman’s Hill, scale bar 500 μm. (i) Bioclastic pack- to floatstone over an erosional boundary cutting into a poorly fossiliferous mudstone, thin-section 4 (TS4), Whitman’s Hill, scale bar 3 mm. (j) Laminated peloidal grainstone with sparse bioturbations (arrows), thin-section 5 (TS5), Whitman’s Hill, scale bar 3 mm. (k) Close-up of the peloidal grainstone in (j), scale bar 200 μm.

Based upon these thin-sections, the Coalbrookdale Formation at Whitman’s Hill Quarry is interpreted to have been deposited in an environment predominantly below the fair-weather wave base, but above the storm wave base, as indicated by episodes of erosion and reworking resulting in deposition of coquinas composed of poorly sorted, barely fragmented brachiopod shells. Intercalations of laminated peloidal grainstones with erosional bases in the uppermost part are here interpreted as produced by waning storm flows. Almost completely preserved lamination and sparse bioturbation indicate event deposition contrasting with the thorough bioturbation of the surrounding sediments.
By way of contrast, the silty mudstones of the Coalbrookdale Formation and overlying Basement Beds at Castle Mill Basin, West Midlands, (Figs 4, Fig. 7) contain crinoidal wacke- to packstones with grainstone nodules (Fig. 7a). Putative cyanobacteria Rothpletzella (Fig. 7d) and Girvanella, green algae Rhabdoporella (Fig. 7a) and Dimorphosiphon (Fig. 7c) are abundant. Common components include bryozoans (Fig. 7b), unidentified spherical fossils with very thin recrystallized shells (Fig. 7g), tentaculitids (Fig. 7f), trilobites, gastropods, phosphatic microfossils, and rare brachiopods. Finally, as with Whitman’s Hill Quarry, bioclasts are commonly encrusted by the problematicum Allonema (Fig. 7b, e).
Based upon these thin-sections, the Coalbrookdale Formation at Castle Mill Basin is interpreted to have been deposited in a soft-bottom protected environment within the euphotic zone, oscillating near the fair-weather wave base, and therefore within a somewhat shallower setting than that for Whitman’s Hill Quarry.
5.b. Lower Quarried Limestone Member of the Much Wenlock Limestone Formation
The Lower Quarried Limestone Member of the MWLF is regionally variable in thickness and ranges from as little as 4.3 m at Whitman’s Hill Quarry to 8.2 m at Bruff Business Park, and to between 9.8 m and 16.2 m in the West Midlands (Ray et al. Reference Ray, Brett, Thomas and Collings2010, Reference Ray, Richards, Brett, Morton and Brown2013). An important factor in determining the thickness of any one section is the presence of reefal masses, with greater thicknesses attributed to variations in compaction and lithification caused by their presence (Ratcliffe, Reference Ratcliffe1988). However, regional variations in the bedded lithology are present and indicate a thinning and eventual loss of these limestones at the transition with the exterior part of the platform (see Ratcliffe & Thomas, Reference Ratcliffe and Thomas1999; Ray et al. Reference Ray, Brett, Thomas and Collings2010; Fry et al. Reference Fry, Ray, Wheeley, Boomer, Jarochowska and Loydell2017). In detail the bedded parts of the succession can be divided into five parasequences (PS1 to 5), with the top of PS1 corresponding to a combined sequence boundary and transgressive surface (Ray et al. Reference Ray, Richards, Brett, Morton and Brown2013). Above, relative sea-level is interpreted to gradually increase at Whitman’s Hill Quarry, while within the West Midlands relative sea-level fell throughout much of the remainder of the member, reflecting differing local responses of carbonate production to sea-level rise within the early transgressive systems tract (Figs 2, 3, 6).
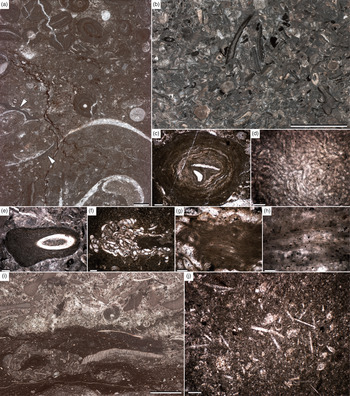
The boundary between the Coalbrookdale Formation and Lower Quarried Limestone Member at Whitman’s Hill Quarry represents a major relative sea-level fall (Fig. 2). PS1 differs from the overlying strata of the member: its base is formed by mudstone with an admixture of silt-sized quartz with rare, thoroughly fragmented and partly pyritized brachiopods, ostracods, bryozoans, and trilobites. Within this matrix, large in situ favositid corals can be traced to Penny Hill Quarry (~13 km north of Whitman’s Hill Quarry) (Ray et al. Reference Ray, Richards, Brett, Morton and Brown2013). The top of this parasequence is visible in the field as an iron oxide-stained, scoured surface marking erosion at a sequence boundary. It consists of a moderately sorted crinoidal grainstone layer with cortoids (Fig. 8b), reworked lithoclasts, and porostromate oncoids (Fig. 8d, e). Above, the parasequences of the early transgressive systems tract are formed of two facies types. The first is oncoidal floatstones with moderately diverse benthic fauna, including gastropods, rugose corals, crinoids, bryozoans and ostracods (Fig. 8a). Most bioclasts are encrusted with both spongio- and porostromate problematica (Fig. 8c), e.g. Girvanella. The matrix is clotted and peloidal, suggestive of microbially precipitated micrite. This interval also contains reefs, not examined here, but characterized previously by Penn (Reference Penn1971) and Päßler et al. (Reference Päßler, Jarochowska, Ray, Munnecke and Worton2014). The second and stratigraphically higher facies is mud- to wackestones with rare complete rugose corals in life positions. This interval is partly dolomitic, as indicated by the lack of reaction with acetic acid (Jarochowska et al. Reference Jarochowska, Ray, Röstel, Worton and Munnecke2017), but neither obvious dolomitization affecting rock texture nor microbial structures typical for primary dolomite have been observed in thin-sections or macroscopically. This allows the possibility that dolomite was present in the fine fraction, as reported from other carbon isotope excursion intervals (Kozłowski & Sobień, Reference Kozłowski and Sobień2012; Frýda & Frýdova, Reference Frýda and Frýdova2016). Oncoids are absent and putative cyanobacteria are less common, typically in association with the non-microbial problematicum Allonema (Fig. 8f, g), which also encrusts most available substrates. The matrix is bioturbated, giving the rock amalgamated appearance. Benthic fauna is fragmented and consists of gastropods, ostracods, trilobites and rare crinoids.
Microfacies of the Lower Quarried Limestone (a–g) and Nodular Beds (h–j) members (see Fig. 2). (a) Oncoid–gastropod floatstone; arrows show algal coating on recrystallized gastropod shell, thin-section 7 (TS7), Whitman’s Hill, scale bar 2 mm. (b) Crinoidal pack- to grainstone with cortoids, thin-section 6 (TS6), Whitman’s Hill, scale bar 4 mm. (c) Oncoid formed by probable Girvanella, thin-section 7 (TS7), Whitman’s Hill, scale bar 500 μm. (d) Close-up of a porostromate problematicum forming an oncoid, thin-section 6 (TS6), Whitman’s Hill, scale bar 200 μm. (e) Truncated oncoid formed by a porostromate problematicum, thin-section 6 (TS6), Whitman’s Hill, scale bar 500 μm. (f) Aggregation of Girvanella and Allonema floating in the matrix, thin-section 8 (TS8), Whitman’s Hill, scale bar 500 μm. (g) Close-up of Girvanella in (f), scale bar 200 μm. (h) Girvanella floating in a grainstone, thin-section 9 (TS9), Whitman’s Hill, scale bar 500 μm. (i) Contact between crinoidal bioturbated wacke- to packstone and crinoidal grainstone with peloids, thin-section 11 (TS11), Bruff Business Park, scale bar 4 mm. (j) Sponge spicules in a wackestone matrix, thin-section 10 (TS10), Bruff Business Park, scale bar 500 μm.

Based upon the microfacies descriptions, the base of PS1 was deposited between storm and fair-weather wave base. The scarcity of benthic fauna and lack of green algae indicate either restricted conditions or relatively deep environment. The high degree of fragmentation is suggestive of long transport, supporting the latter explanation. On the other hand, the very large size and high degree of colony integration in favositids are commonly taken as indicator of their photosymbiotic mode of growth (e.g. Stanley & Lipps, Reference Stanley, Lipps and Stanley2011), and large colonies might indicate position within the photic zone. The remainder of PS1 records a rapid lowering of the erosional base, with the scoured surface at the top of the parasequence indicating submarine winnowing. The iron oxide mineralization of this surface is likely derived from the overlying bentonite (WH4 of Ray et al. Reference Ray, Richards, Brett, Morton and Brown2013) that was preserved during the onset of relative sea-level rise associated with the proceeding parasequence.
The presence of green algae within much of the overlying Lower Quarried Limestone Member indicates deposition within the euphotic zone (Päßler et al. Reference Päßler, Jarochowska, Ray, Munnecke and Worton2014). All oncoids observed are small, smooth-surfaced, and spherical to subspherical (Type A oncoids of Ratcliffe, Reference Ratcliffe1988) and indicate deposition within fair-weather wave base. Only the topmost part of the member was deposited below the fair-weather wave base and the euphotic zone (Päßler et al. Reference Päßler, Jarochowska, Ray, Munnecke and Worton2014), with the amalgamation through burrowing organisms suggestive of low depositional rates at this time.
At Dudley the microfacies of the Lower Quarried Limestone Member have been documented in detail (Ratcliffe, Reference Ratcliffe1988; Ratcliffe & Thomas, Reference Ratcliffe and Thomas1999), with three microfacies attributed to the bedded part of the succession (peloidal packstones; skeletal packstones and wackestones; loosely packed skeletal wackestones) and three attributed to reefal masses and their immediate surroundings (coralline framestones (= graticulacean algae); crinoidal grainstones; algal micrites). More generally the common occurrence of oncoids and green algae indicates that deposition took place mostly within the euphotic zone. With respect to relative sea-level change and depositional energy, much insight has been gained from the analysis of oncoid morphology. Broadly, the oncoids range from large (<70 mm), highly irregular branched forms to small (5–10 mm) subspherical forms, with the degree of rolling during formation responsible for differences in morphology. Using a simple classification of oncoid morphology (types A, B and C), Ratcliffe (Reference Ratcliffe1988) demonstrated that across the West Midlands there is a vertical transition from irregular Type C oncoids to subspherical Type A forms. Such an arrangement indicates an overall increase in depositional energy from an environment close to storm wave base, being characterized by low energy with little turbulence (Type C oncoids), to an environment within fair-weather wave base, with Type A oncoids requiring constant but gentle rolling (Ratcliffe, Reference Ratcliffe1988).
Based upon a regional comparison of the environmental changes within the uppermost Coalbrookdale Formation and Lower Quarried Limestone Member, it is apparent that as sea-level fell across the platform interior, the position of the highest depositional energy shifted from the West Midlands (the Basement Beds) to Hereford–Worcestershire and Whitman’s Hill Quarry (basal Lower Quarried Limestone Member). This shift resulted in the dissipation of wave energy within formerly low-energy deeper water areas (i.e. Whitman’s Hill Quarry), and the establishment of a sheltered lagoon across the West Midlands. Above the sequence boundary, the onset of sea-level rise (early transgressive systems tract) resulted in an eventual return of high-energy deposition to the West Midlands (Type A oncoids of the higher part of the Lower Quarried Limestone Member), while at Whitman’s Hill, Quarry deposition returned to below fair-weather wave base and the euphotic zone. It is of note that high-energy deposition within the West Midlands during parasequences 4 and 5 most likely reflected the onset of relative sea-level rise, as inferred by features such as parasequence thickness and lithological variability (Ray et al. Reference Ray, Brett, Thomas and Collings2010).
5.c. Nodular Beds Member of the Much Wenlock Limestone Formation
The Nodular Beds Member of the MWLF increases in thickness from 23.0 m within Hereford–Worcestershire (Bruff Business Park) to 27.8–31.0 m within the West Midlands. The member consists of nodular and bedded limestones separated by silty mudstones of a similar thickness. In terms of relative sea-level change, the member begins with a marked sea-level rise (late transgressive systems tract) of probable eustatic origin (transgression 5a of Johnson, Reference Johnson2006); above this, sea-level falls, slowly at first and then more rapidly within the upper part of the member (highstand and falling stage systems tracts) (Ray et al. Reference Ray, Brett, Thomas and Collings2010, Reference Ray, Richards, Brett, Morton and Brown2013). Based upon the common occurrence of reefs and skeletal limestones, the succession in the West Midlands appears to be developed within a somewhat shallower setting than that within Hereford–Worcestershire. In particular, at Dudley, skeletal limestones and reefs return within PS7, above which PS8 is particularly notable as a massively bedded interval consisting of packstones and grainstones with reefal masses (i.e. a high-energy setting within the euphotic zone). The onset of this reefal facies is observable across the West Midlands (Ray & Thomas, Reference Ray and Thomas2007; Ray et al. Reference Ray, Brett, Thomas and Collings2010) and marks the beginning of pronounced shallowing, that culminates in the wave-rippled grainstone beds and the uppermost Nodular Beds and Upper Quarried Limestone member.
At Whitman’s Hill Quarry and Bruff Business Park, the beds of the Nodular Beds Member are partly amalgamated and obliterated by formation of nodules. The lower part of the member (PS6) is a partly dolomitized mudstone with crinoids, small, solitary rugose corals, and a high content of clay and siliciclastic mud. Stratigraphically higher in the member (PS8 and 9) the proportion of clay is lower and nodularity is more pronounced. Nodules are surrounded by silty mudstones with dissolution seams and formed by very fine-grained bioclastic wackestone with crinoids and abundant sponge spicules (Fig. 8j). The contact with the uppermost parasequence (PS10) (Fig. 8i) shows an abrupt shift to purer carbonates formed by wacke- to packstones with grainstone nodules containing Dimorphosiphon-like green algae.
Based upon the microfacies descriptions, the basal parasequence (PS6) of the Nodular Beds Member was deposited near the storm wave base at very low rates of carbonate production and is considered characteristic of the late transgressive systems tract. The top of PS9 is reflective of a general shallowing trend (highstand systems tract) with increasing abundance and diversity of benthic fauna. However, the absence of photic zone indicators and high abundance of sponges indicates relatively deep environment below storm wave base. Finally, the base of PS10 represents the surface of forced regression and marks an abrupt shallowing to the euphotic zone. In addition, the increasing proportion of grainstones in this unit indicates deposition initially near and subsequently above the fair-weather wave base (falling stage systems tract).
Based upon a regional comparison of the Nodular Beds Member it is clear that a high-energy setting within the euphotic zone was achieved much earlier within the West Midlands (PS7), while within Hereford–Worcestershire such a setting is only achieved by PS10. Thus, for a significant portion of the deposition of the Nodular Beds Member the West Midlands represented a potentially restricted patch-reef setting, while Hereford–Worcestershire reflected the relatively open waters of the margin of the platform interior.
5.d. Upper Quarried Limestone Member of the Much Wenlock Limestone Formation
The thickness of the Upper Quarried Limestone Member varies from 7.51 m (including the Passage Beds; PS12) at Bruff Business Park to between 8.6 m and 10.2 m across the West Midlands (Aldridge et al. Reference Aldridge, Siveter, Siveter, Lane, Palmer and Woodcock2000). Across the study area the member begins within thickly bedded to massive grainstones that develop towards the top of PS10. The top of PS10 is a combined sequence boundary and transgressive surface and represents the peak of a major relative sea-level fall of probable eustatic origin (see Johnson, Reference Johnson2006). Above, the succession is considerably more variable in lithology and thickness (PS11 and PS12). Such variations reflect the onset of regional sea-level rise (early transgressive systems tract), differences in palaeobathymetry and the localized development of grainstone shoals (Ray et al. Reference Ray, Brett, Thomas and Collings2010, Reference Ray, Richards, Brett, Morton and Brown2013; Blain et al. Reference Blain, Ray and Wheeley2016). Finally, the onset of rapid regional sea-level rise (late transgressive systems tract) replaces the inner-shelfal carbonates of the MWLF with the outer-shelfal silty mudstones of the Lower Elton Formation. We here confine our descriptions to the successions at Bruff Business Park (Suckley) and Lion’s Mouth Cavern (Dudley) (Figs 2, 5, 6).
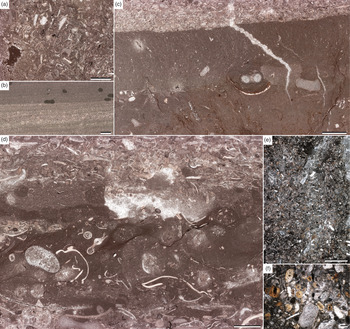
Microfacies analysis at the Bruff Business Park identifies the massive nodular limestones that develop towards the top of PS10 as consisting of a poorly sorted crinoidal grainstone with diverse ostracods, bryozoans, brachiopods and echinoderms (Fig. 9a). Above, PS11 consists of evenly bedded silty mudstones intercalating with limestone nodules and thin limestone beds. The mudstones are moderately bioturbated and have a diverse ostracod and bryozoan fauna. Grainstone beds formed by well-sorted crinoids and ostracods have been found cutting erosionally into the mudstones (Fig. 9c). Limestone beds show planar lamination formed by very well-sorted, very fine sand fraction peloidal grainstones with abundant organic-walled fossils – scolecodonts and chitinozoans, and Planolites-like burrows (Fig. 9b). The Passage Beds equivalent occurs in parasequence 12 and may be distinguished by a slightly more nodular appearance than the overlying Lower Elton Formation (included in the Lower Elton Formation of Ray et al. Reference Ray, Richards, Brett, Morton and Brown2013), but otherwise is broadly similar. This unit is distinguished by a shift to fine-grained sedimentation and the formation of silty nodular mudstones with sparse bioturbation. Lenses of bioclastic float- to rudstones with diverse bryozoans, crinoids, brachiopods, trilobites, ostracods and halysitid corals (Fig. 9d) appear partially reworked by bioturbation.
Microfacies of the Upper Quarried Limestone Member (a–c, e–f) and Lower Elton Formation (d) (see Figs 2, 5). (a) Partly dolomitized crinoidal packstone, sample 12 (TS12), Bruff Business Park, scale bar 3 mm. (b) Laminated peloidal grainstone with Planolites-like bioturbations, sample 14 (TS14), Bruff Business Park, scale bar 3 mm. (c) Erosional contact between bioturbated bioclastic wackestone and crinoidal grainstone, sample 13 (TS13), Bruff Business Park, scale bar 3 mm. (d) Erosional contact between bioturbated bioclastic float- to rudstone and crinoidal pack- to grainstone, sample 15 (TS15), Bruff Business Park, scale bar 3.5 mm. (e) Bioturbated crinoidal packstone with phosphatized crinoids, sample 16 (TS16), Lion’s Mouth Cavern, scale bar 2.5 mm. (f) Close-up of (e), scale bar 500 μm.

In contrast to the Bruff Business Park section, at Lion’s Mouth Cavern (Dudley, West Midlands) PS11 is developed as coarse thick-bedded crinoidal grainstones. Above, the Passage Beds (PS12) begin with a very coarse grainstone with shale and limestone rip-up clasts, stromatoporoids and corals both rolled and in situ, and very coarse crinoid ossicles. This unit is followed by thin-bedded, amalgamated crinoidal rudstones grading into grainstones and fine-grained, well-sorted packstones with quartz grains in the fine sand size fraction. In the upper part numerous crinoid ossicles are phosphatized (Fig. 9e, f).
Based upon the microfacies descriptions, the variability in depositional environment and relative sea-level within the Upper Quarried Limestone Member and immediately overlying Lower Elton Formation may be assessed. At Bruff Business Park the initial grainstone succession at the top of PS10 is interpreted as deposition in a shoal environment, i.e. above the fair-weather wave base. Above, PS11 is representative of relative sea-level rise and the onset of the early transgressive systems tract. Here deposition occurred in a soft-bottom environment. Low faunal abundance and the lack of photic zone indicators point to a relatively deep environment. Distal tempestites formed as laminated grainstones, identical to those in the upper part of the Coalbrookdale Formation, point to deposition above the storm wave base. Within the overlying Passage Beds and basal Lower Elton Formation, relative seal-level continued to rise. A low diversity of benthic fauna indicates deposition in a relatively deep environment, but above the storm wave base, as indicated by storm beds bringing shallow-water material. In addition, limited bioturbation might suggest comparatively high depositional rates or limited oxygen availability.
By contrast, PS11 at Lion’s Mouth Cavern is reflective of deposition in a high-energy shoal environment and indicates continued relative sea-level fall within the Dudley area. It is not until the overlying Passage Beds (PS 12) that relative sea-level notably rises. Here the Passage Beds reflect oscillation near the fair-weather wave base, and the phosphatization of bioclasts is interpreted to represent sediment starvation as sea-level increased.
Based upon a regional comparison of the Upper Quarried Limestone Member, it is apparent that with the onset of the early transgressive systems tract the relatively deeper-water carbonates of Hereford–Worcestershire failed to keep pace with sea-level rise, while those in the West Midlands initially outpaced sea-level rise. This resulted in markedly different depositional environments across PS11 and PS12, above which the increased rate of sea-level rise (late transgressive systems tract) regionally replaced the inner-shelfal carbonates of the MWLF with the outer-shelfal silty mudstones of the Lower Elton Formation.
6. The impact of depositional environment upon the Homerian Carbon Isotope Excursion
The subdivision and correlation of the Much Wenlock Limestone Formation and the immediately under- and overlying formations by parasequences allows for the investigation of age-synchronous but depositionally divergent environments (Figs 2, 3, 6). Based upon the analysis of microfacies herein, these differences have been qualitatively assessed in terms of their position with respect to storm and fair-weather base and the euphotic zone, thereby allowing for a better understanding of the environmental differences between sections. These depositional differences can now be compared with differences in the carbon isotopic record.
At the broadest scale it is apparent that for any given time interval the shallowest depositional setting is consistently developed within the West Midlands. This observation is most apparent during episodes of rapid (eustatic) sea-level change where higher-energy (and shallower) microfacies occur earlier during sea-level fall and persist later during sea-level rise. In terms of the effect upon carbon isotopic values it has been well documented that lighter δ13Ccarb values are recorded from more distal settings and heavier values from shallower settings, and this relationship has been demonstrated in near-age equivalent successions on Avalonia (Blain et al. Reference Blain, Ray and Wheeley2016), Baltica (Jarochowska & Munnecke, Reference Jarochowska and Munnecke2015) and Perunica (Frýda & Frýdova, Reference Frýda and Frýdova2016). Based upon the maximum δ13Ccarb values for the lower and upper peaks of the Homerian CIE, this also holds true for the MWLF, with values in the West Midlands 0.7 ‰ and 0.8 ‰ higher than in Hereford–Worcestershire. The likely range of isotopic values within the carbonates of the Midland Platform may be established for the lower peak of the Homerian CIE, with values ranging from as low as 2.8 ‰ (Fry et al. Reference Fry, Ray, Wheeley, Boomer, Jarochowska and Loydell2017) for the most distal extreme of the carbonate deposition (Farley Member of the Coalbrookdale Formation at Eaton Track near Much Wenlock) to 5.5 ‰ for the most proximal setting at Dudley (i.e. a difference of 2.7 ‰).
At the scale of members and parasequences, the effect of depositional environment and palaeobathymetry upon carbon isotopic values can also be observed. These differences are most conspicuous within the Nodular Beds Member, where there is a regional difference in the position of the broad trough in values which separates the dual peaks of the Homerian CIE. In particular, within the West Midlands the broad minimum in values and turnaround to rising values occurs in PS7, while within Hereford–Worcestershire this occurs around the PS9–PS10 boundary (Fig. 6). From the perspective of palaeobathymetry change, within the West Midlands the upper part of PS7 corresponds to the onset of reef development and the beginning of a pronounced shallowing, while within Hereford–Worcestershire a relatively deep environment below storm wave base and the euphotic zone persists until the base of PS10, after which pronounced shallowing begins. Thus, the broad minimum in isotopic values and the turnaround to rising values appears to mirror the onset of pronounced shallowing within both areas. One possible interpretation of the stratigraphic offset between troughs could be a mis-correlation of parasequences, which seems unlikely given the additional bentonite correlation within this critical interval. Moreover, superimposed upon the broad carbon isotopic trends of both areas are lesser troughs in values which appear to represent age-equivalent isotopic events or local petrographic variations (Fig. 6). However, no support for the effect of diagenetic alterations or admixture of detrital minerals that might have shifted the isotopic values (see e.g. Kozłowski & Sobień, Reference Kozłowski and Sobień2012) has been observed in thin-sections. A strong diagenetic overprint on the isotopic values can be excluded based on the lack of relationship between δ18Ocarb and δ13Ccarb values (Supplementary Material available online at https://doi.org/10.1017/S0016756819001146). Accordingly, regional differences in the rate of palaeobathymetric change and nature of the associated carbonates appear to control and offset the broad trend in isotopic values, while shorter-term events are observable across the study areas.
Within the upper MWLF, there is approximate synchronicity between the areas with respect to the position of the upper peak of the Homerian CIE. However, while the upper peak occurs in both areas within PS10, its position within the parasequence does differ. In particular, peak values occur in the lower half of PS10 in the West Midlands and the upper half of PS10 in Hereford–Worcestershire. As previously this offset may also be the result of differing palaeobathymetries upon isotopic values, but given the general upward shallowing nature of each parasequence and the similarly rapid fall in sea-level observed across the region, this explanation seems less apparent. Thus, an alternative explanation might be that the intra-parasequence offset of the peak values may reflect variable sedimentation rates and/or minor regional diachronism. This view is additionally supported by the correlation of a bentonite within PS10 between Dudley and Wenlock Edge (Ray et al. Reference Ray, Collings, Worton and Jones2011). As with the position of the isotopic peak, the bentonite horizon occurs lower in the parasequence at Dudley and at a relatively higher position towards the platform margin at Wenlock Edge. Irrespective of the cause, such minor differences do highlight the limit of the regional stratigraphic resolution and question the significance of minor offsets in the start and finish of the Homerian CIE highlighted herein.
Lastly, our ability to clearly identify the end of the Homerian CIE is of particular significance owing to its close proximity to the Wenlock–Ludlow boundary. Based upon the correlation of parasequences with the Gorstian GSSP (base Ludlow Series) at Ludlow (Shropshire) (Fig. 1b) (Melchin et al. Reference Melchin, Sadler, Cramer, Gradstein, Ogg, Schmitz and Ogg2012; Blain et al. Reference Blain, Ray and Wheeley2016; Fry et al. Reference Fry, Ray, Wheeley, Boomer, Jarochowska and Loydell2017), this boundary corresponds to the PS11–PS12 boundary (the Much Wenlock Limestone – Lower Elton Formation boundary at Ludlow). Accordingly, the carbon isotopic records within the West Midlands and Hereford–Worcestershire would argue for the end of the Homerian CIE within the very earliest Ludlow (intra-PS12). However, the end of the Homerian CIE is far from clear within the Ludlow area (Fry et al. Reference Fry, Ray, Wheeley, Boomer, Jarochowska and Loydell2017) and this lack of clarity has been linked to platform margin depositional setting of the Ludlow area (Blain et al. Reference Blain, Ray and Wheeley2016). In particular, within deeper-water settings the environmental difference between the latest Wenlock limestones of the MWLF (PS11) and the shales and limestones of the lowest Lower Elton Formation (PS12) becomes less marked and this is reflected by less variability within the carbon isotopic record, thereby making the accurate establishment of the end of the CIE difficult. Conversely, within the platform interior the end of the Homerian CIE coincides with a marked sea-level rise and equally marked environmental change, which may have the effect of reducing carbon isotopic values and bringing to an end the Homerian CIE. Thus, the end of the Homerian CIE upon the Midland Platform may be partly reflective of local environmental changes, rather than global change within the carbon cycle. Furthermore, it is clear from this study that the variability of platform carbonates in response to sea-level has a significant impact upon the carbon isotopic record and this impact can only be understood by a careful analysis of depositional environment and palaeobathymetry.
7. Conclusions
New δ13Ccarb and microfacies data from Hereford–Worcestershire (Storridge and Suckley) and the West Midlands (Castle Hill, Mons Hill and Wren’s Nest Hill) allow for a detailed examination of variations in the Homerian CIE and depositional environment within the Much Wenlock Limestone Formation of the interior of the Midland Platform. The main conclusions are summarized below:
1 The entirety of the dual-peaked Homerian CIE is recognized for the first time with the Much Wenlock Limestone Formation of Hereford–Worcestershire and allows for a detailed comparison of new carbon isotope data from the West Midlands area using the sequence-stratigraphic and bentonite correlation framework of Ray et al. (Reference Ray, Richards, Brett, Morton and Brown2013).
2 Thin-section descriptions and microfacies analysis confirm the regional differences in relative sea-level change identified by Ray et al. (Reference Ray, Richards, Brett, Morton and Brown2013). In particular, the Much Wenlock Limestone Formation of West Midlands is developed within a somewhat shallower platform interior setting than that seen in Hereford–Worcestershire. This is most apparent during episodes of rapid (eustatic) sea-level change where higher-energy (and shallower) microfacies occur earlier during sea-level fall and persist later during sea-level rise.
3 Based upon the maximum δ13Ccarb values for the lower and upper peaks of the Homerian CIE, the shallower depositional setting of the West Midlands is associated with values that are 0.7 ‰ and 0.8 ‰ higher than in Hereford–Worcestershire. Thus, lighter δ13Ccarb values are recorded from more distal settings, and heavier values from shallower settings.
4 At the scale of members and parasequences, the effect of depositional environment upon carbon isotopic values has been observed. In particular, there is a clear offset in the position of the trough in isotopic values between the peaks of the Homerian CIE. This offset can be attributed to notably shallower parts of the succession within the West Midlands area. It appears to reflect differences in relative sea-level change and carbonate production rates. Furthermore, it may be influenced by rock mineralogy and the corresponding δ13C fractionation, with higher values in shallower settings due to higher proportions of dolomite or aragonite.
5 Local differences in carbon isotopic values complicate their use as a means of high-resolution correlation. However, from this study it is clear that a careful analysis of the depositional environment and palaeobathymetry can account for these differences and thereby improve our utilization of this stratigraphic tool.
Supplementary material
To view supplementary material for this article, please visit https://doi.org/10.1017/S0016756819001146.
Acknowledgements
The authors thank Herefordshire and Worcestershire Earth Heritage Trust for access to Whitman’s Hill Quarry, and John Roberts-Powell for access to Bruff Business Park. We would also like to thank Dudley Canal and Tunnel Trust for providing access to the Castle Mill Basin sections, and Dudley MBC for access to the sections within Wren’s Nest National Nature Reserve. We thank B. Leipner-Mata for help in producing thin-sections. The paper benefited from reviews by Jiri Frýda and two anonymous referees that significantly improved the manuscript. E.J. and A.M. were supported by Deutsche Forschungsgemeinschaft (grant no. Mu 2352/3 to A. Munnecke).
Conflict of Interest
None.