Introduction
Major depression (MD) is one of the most common psychiatric disorders worldwide. It has been ranked as the largest contributor to global disability according to a recent WHO report (2017), and is a major cause underlying suicidal deaths (2017). Nevertheless, the etiology of depression remains largely unclear.
There have been a lot of efforts to search for biological markers associated with and/or causal to depression/suicide, among which serum lipid is one possible etiological factor that is quite widely studied (Persons & Fiedorowicz, Reference Persons and Fiedorowicz2016; Shin, Suls, & Martin, Reference Shin, Suls and Martin2008; Wu et al., Reference Wu, Ding, Wu, Xie, Hou and Mao2016). Since dyslipidemia is common and a large number of people are on lipid-lowering therapies (Mercado et al., Reference Mercado, DeSimone, Odom, Gillespie, Ayala and Loustalot2015 ), the topic is also of high clinical relevance. We shall highlight some epidemiological studies in this area. In an early study, Muldoon et al. (Muldoon, Manuck, & Matthews, Reference Muldoon, Manuck and Matthews1990) examined the effects on lowering cholesterol concentration on mortality, and revealed a significant rise in deaths due to accidental causes and suicide. Engelberg (Reference Engelberg1992) proposed that reduced peripheral cholesterol levels may contribute to a decrease in brain serotonin, and that low membrane cholesterol may reduce the number of serotonin receptors, leading to elevated suicidal risks. Subsequently, more clinical studies have been performed; however the results were mixed, with studies showing positive, inverse or non-significant associations (Parekh, Smeeth, Milner, & Thure, Reference Parekh, Smeeth, Milner and Thure2017; Persons & Fiedorowicz, Reference Persons and Fiedorowicz2016; Shin et al., Reference Shin, Suls and Martin2008; Wu et al., Reference Wu, Ding, Wu, Xie, Hou and Mao2016). A few meta-analyses have been performed in this area. Shin et al. (Reference Shin, Suls and Martin2008) reported that total cholesterol (TC) was inversely associated with levels of depression, especially among drug-naïve patients. They also observed an inverse relationship of low density lipoprotein cholesterol (LDL-c) with depression, but it did not reach statistical significance. Interestingly, they reported a positive association of high density lipoprotein cholesterol (HDL-c) with depression in women. A more recent meta-analysis also reported that lower LDL-c is associated with higher risk of depression (Persons & Fiedorowicz, Reference Persons and Fiedorowicz2016). On the other hand, depression may be associated with raised coronary heart disease (CHD) risks (Dhar & Barton, Reference Dhar and Barton2016) and high LDL-c is a major risk factor for CHD (Wadhera, Steen, Khan, Giugliano, & Foody, Reference Wadhera, Steen, Khan, Giugliano and Foody2016). As for suicidal risks, in a meta-analysis, Wu et al., reported lower serum lipids are generally associated with heightened suicidality (Wu et al., Reference Wu, Ding, Wu, Xie, Hou and Mao2016). Overall speaking, the findings are mixed and inconsistent, and heterogeneity between studies is large (Persons & Fiedorowicz, Reference Persons and Fiedorowicz2016; Shin et al., Reference Shin, Suls and Martin2008; Wu et al., Reference Wu, Ding, Wu, Xie, Hou and Mao2016).
There are several important limitations in previous studies. One key limitation is that cause-effect relationships cannot be reliably determined from previous studies. Many studies are case-control or cross-sectional in nature and the temporal relationship between depression onset and lipid changes cannot be ascertained. In addition, confounding variables may not be completely controlled for in every study, which hinders causal inference. For example, medications, including some antidepressants, may affect the lipid profiles of patients (McIntyre, Soczynska, Konarski, & Kennedy, Reference McIntyre, Soczynska, Konarski and Kennedy2006). It is difficult to control for drug effects unless the study only involves drug-naïve cases. In addition, publication bias might be present, and previous meta-analyses did reveal statistical evidence of such bias (Persons & Fiedorowicz, Reference Persons and Fiedorowicz2016; Wu et al., Reference Wu, Ding, Wu, Xie, Hou and Mao2016). Although the effects of cholesterol levels on depression were investigated in a number of works, the effects of triglyceride (TG), another major lipid, were less well-studied. Moreover, relatively few studies [except e.g. (Lehto et al., Reference Lehto, Niskanen, Tolmunen, Hintikka, Viinamaki, Heiskanen and Koivumaa-Honkanen2010; Virtanen et al., Reference Virtanen, Ferrie, Akbaraly, Tabak, Jokela, Ebmeier and Kivimaki2017)] focused on other depression phenotypes such as duration of depressive episode or symptoms.
In this study, we aim to analyse causal relationships between lipid levels and depression-related phenotypes. We will employ Mendelian randomisation (MR) for causal inference. MR makes use of genetic variants as ‘instruments’ to represent the exposure of interest, and infers causal relationship between the exposure and the outcome (Smith & Ebrahim, Reference Smith and Ebrahim2003). MR is much less susceptible to confounding bias and reverse causality when compared to observational studies. The principle of MR may be considered similar to a randomised controlled trial (RCT): for example, a group of subjects who have inherited lipid-lowering alleles at a locus (or a set of such alleles at multiple loci) will have lower lipid levels on average, which is analogous to receiving lipid-lowering medication(s) in an RCT (Bennett & Holmes, Reference Bennett and Holmes2017). The random allocation of alleles at conception is analogous to random assignment of treatment in an RCT. Another advantage is that MR can be conducted with summary statistics from genome-wide association studies (GWAS), which are commonly of large sample sizes. Here we studied five depression-related phenotypes, including MD, depressive symptoms (DS), longest duration of depressed mood, number of episodes having depressed mood, and history of suicide or deliberate self-harm (DSH). The aim of studying multiple phenotypes is to gain a comprehensive understanding of the effects of lipids on depression traits and to triangulate the results from different aspects.
Methods
For a more detailed description of samples/methods, please also refer to supplementary Text.
GWAS study samples
The study samples were primarily of European ancestry. Four lipid traits are studied, including LDL-c, HDL-c, TG and TC. GWAS was performed by the Global Lipids Genetics Consortium (N = 188 577). We downloaded summary statistics of joint GWAS analysis from http://csg.sph.umich.edu/willer/public/lipids2013/. For details please refer to ref (Willer et al., Reference Willer, Schmidt, Sengupta, Peloso, Gustafsson and Kanoni2013).
We included five depression-related phenotypes as follows:
(1) MD: We employed the latest PGC GWAS meta-analysis from Wray et al. (Reference Wray, Ripke, Mattheisen, Trzaskowski, Byrne and Abdellaoui2018). Full summary statistics are available for a subset of subjects excluding 23andMe participants (59 851 cases/113 154 controls). This set of summary statistics was used for MR analysis with lipids as exposure. The UK BioBank (UKBB) sub-sample (14 260 of 59 851 cases) included some cases from self-reporting, while others were defined by clinical assessment/records.
We also performed MR with MD as exposure, for which we used the ‘top 10k SNPs’ from the entire sample (135 458 cases/344 901 controls). Cases from 23 and Me were based on self-reporting.
(1) DS: GWAS results were taken from Okbay et al. (Reference Okbay, Baselmans, De Neve, Turley, Nivard, Fontana and Cesarini2016), a meta-analysis from SSGAC that included the MDD-PGC study (N = 18 759), a case-control sample from the GERA Cohort (N = 56 368), and a UKBB general population sample (N = 105 739, 58% of total sample). DS were measured by a self-reported questionnaire in UKBB.
GWAS of phenotypes (3) to (5) were based on UKBB. We downloaded GWAS summary statistics from the Neale Lab (https://sites.google.com/broadinstitute.org/ukbbgwasresults/). The analytic approach is given in https://github.com/Nealelab/UK_Biobank_GWAS/tree/master/imputed-v2-gwas and http://www.nealelab.is/blog/2017/9/11/details-and-considerations-of-the-uk-biobank-gwas. For binary outcome (phenotype 5), we converted the regression coefficients and their s.e. under the linear model to those under a logistic model (Lloyd-Jones, Robinson, Yang, & Visscher, Reference Lloyd-Jones, Robinson, Yang and Visscher2018). Phenotypes 3 and 4 were recorded for those who indicated feeling depressed or down for >1 week only.
(1) Longest period of depressed/low mood: This item was based on self-reporting (N = 104 190). Inverse-rank normal transformation was used.
(2) Number of episodes with depressed/low mood: It was based on response to the question ‘How many periods have you had when you were feeling depressed or down for at least a whole week?’(N = 104 190).
(3) History of DSH or suicide: This item was based on self-reporting. There were 224 positive responses among 381 462 participants (https://biobank.ctsu.ox.ac.uk/crystal/field.cgi?id=20002). The low number of positive cases may be due to under-reporting. The controls are likely mixed with positive cases, and may be considered weakly ‘screened’ or almost ‘unscreened’. This does not render the analysis invalid, and the use of unscreened subjects is common in GWAS (Moskvina, Holmans, Schmidt, & Craddock, Reference Moskvina, Holmans, Schmidt and Craddock2005). However the power of the study will be improved if reporting bias can be eliminated.
There is no overlap between the GWAS samples for lipids and depression phenotypes, also supported by the non-significant intercepts from genetic correlation analysis (online Supplementary Table S3).
Mendelian randomisation (MR) analysis
Here we performed two-sample MR in which the instrument-exposure and instrument-outcome associations were estimated in different samples. We first performed MR with lipids as exposure and depression phenotypes as outcome, then conducted MR in the reverse direction (for 3 out of 5 phenotypes, as there are insufficient SNPs for the other phenotypes).
We conducted MR with several different methods, including the ‘inverse-variance weighted’ (MR-IVW) (Burgess, Butterworth, & Thompson, Reference Burgess, Butterworth and Thompson2013), Egger regression (MR-Egger) (Bowden, Davey Smith, & Burgess, Reference Bowden, Davey Smith and Burgess2015) and Generalised Summary-data-based Mendelian Randomisation (GSMR) (Zhu et al., Reference Zhu, Zheng, Zhang, Wu, Trzaskowski, Maier and Yang2018) approaches. One of the concerns of MR is horizontal pleiotropy, in which the genetic instruments have effects on the outcome other than through effects on the exposure. MR-Egger and GSMR are able to give valid estimates of causal effects in the presence of imbalanced horizontal pleiotropy.
MR-IVW and MR-Egger accounting for SNP correlations
The IVW framework is widely used in MR. Here we used an IVW approach that is able to account for SNP correlations, described in Burgess et al. (Burgess, Dudbridge, & Thompson, Reference Burgess, Dudbridge and Thompson2016). A similar approach may be used for MR-Egger, which allows an intercept term in the weighted regression. Please refer to (Bowden et al., Reference Bowden, Davey Smith and Burgess2015; Schmidt & Dudbridge, Reference Schmidt and Dudbridge2018) and Supplementary Text for details. The presence of imbalanced horizontal pleiotropy could be assessed by whether the intercept term is significantly different from zero.
Inclusion of a larger panel of SNPs in partial LD may enable higher variance to be explained, thus improving the power of MR (Burgess et al., Reference Burgess, Dudbridge and Thompson2016). Including ‘redundant’ SNPs in addition to the causal variant(s) do not improve power but will not invalidate the results (Burgess et al., Reference Burgess, Dudbridge and Thompson2016). However, including too many variants with high correlations may result in unstable causal estimates (Burgess, Zuber, Valdes-Marquez, Sun, & Hopewell, Reference Burgess, Zuber, Valdes-Marquez, Sun and Hopewell2017).
Here we performed LD-clumping of genetic instruments at multiple r 2 thresholds while accounting for their correlations. Burgess et al. (Burgess et al. Reference Burgess, Dudbridge and Thompson2016) showed in extensive simulations that if SNP correlations are properly accounted for by the above method, type I error is properly controlled. The effect size estimate is also close to the true causal effect. Similarly, for another MR method (GSMR; see below) also employed, simulations have shown good control of type I error in the presence of correlated instruments (Zhu et al., Reference Zhu, Zheng, Zhang, Wu, Trzaskowski, Maier and Yang2018).
Conventionally, MR is performed on (approximately) independent SNPs, and hence many studies and the web-program MR-base employed a LD-clumping threshold of 0.01/0.001 by default. However, MR-base does not have a built-in function to account for LD between SNPs (yet), therefore the program requires input SNPs to be independent. If LD is not adjusted for, it may result in ‘over-precise’ estimates (erroneously low s.e.) (Burgess et al., Reference Burgess, Dudbridge and Thompson2016). However, with proper ways to deal with LD, relaxation of the r 2 threshold is legitimate and valid as discussed above.
Only SNPs passing genome-wide significance (p < 5 × 10⁻⁸) were included as instruments. Analysis was performed with the R packages ‘MendelianRandomization’ (ver 0.4.1) (Yavorska & Burgess, Reference Yavorska and Burgess2017) and ‘TwoSampleMR’ (ver 4.25) (Hemani et al., Reference Hemani, Zheng, Elsworth, Wade, Haberland, Baird and Haycock2018b). If a SNP was not available in the outcome GWAS, we allow using a ‘proxy SNP’ provided r 2 ≥ 0.8 with the original SNP. LD was extracted from the 1000 Genomes European samples.
GSMR approach
Another analytic framework, GSMR (http://cnsgenomics.com/software/gsmr/), also accounts for horizontal pleiotropy but operates based on excluding ‘outlier’ or heterogeneous genetic instruments that are likely pleiotropic (‘HEIDI-outlier’ method) (Zhu et al., Reference Zhu, Zheng, Zhang, Wu, Trzaskowski, Maier and Yang2018). GSMR also employed a slightly different formula from MR-IVW by modelling variance of both $\hat{\beta }_{XG}$ and $\hat{\beta }_{YG}$
 . Correlated variants can be accommodated and validity is proven in extensive simulations (Zhu et al., Reference Zhu, Zheng, Zhang, Wu, Trzaskowski, Maier and Yang2018).
For analysis with <3 genetic instruments, we employed MR-IVW since MR-Egger and GSMR cannot be reliably performed. For single genetic instrument, the Wald ratio approach was used. We also performed the Steiger's test of directionality (Hemani, Tilling, & Davey Smith, Reference Hemani, Tilling and Davey Smith2017) to further ascertain the direction of causal associations.
Multivariable MR
In addition to the standard MR which assesses the causal relationship between an outcome and one exposure variable, we also performed multivariable MR (MVMR) to examine the ‘independent’ causal association of each type of lipid (LDL-c/HDL-c/TG) to depression phenotypes, controlling for other lipids. Multivariable MR was performed according to Burgess, Dudbridge, & Thompson, (Reference Burgess, Dudbridge and Thompson2015); Burgess & Thompson (Reference Burgess and Thompson2015). We also performed multivariable MR-Egger [code from (Rees, Wood, & Burgess, Reference Rees, Wood and Burgess2017)] which accounts for imbalanced pleiotropy (Rees et al., Reference Rees, Wood and Burgess2017). The interpretation of univariable and multivariable MR estimates is different. Univariable MR gives the total causal effect of an exposure on the outcome, while MVMR gives the ‘independent’ effect of a risk factor adjusting for other modelled exposures. It has been argued the total causal effect is more clinically relevant as this is the effect expected from an intervention (e.g. a drug) on the exposure (Holmes & Davey Smith, Reference Holmes and Davey Smith2018). Another point to note is that methods to adjust for instrument correlations have not been developed for MVMR, therefore the results (especially s.e.s) at higher correlations should be viewed with caution. For these reasons MVMR is regarded as a secondary analysis here; the main aim is to give a more comprehensive picture on how each exposure exert an independent effect on the outcome not mediating through other modelled exposures.
LD score regression
We also performed LD score regression (LDSR) (Bulik-Sullivan et al., Reference Bulik-Sullivan, Finucane, Anttila, Gusev, Day, Loh and Neale2015) to compute genetic correlations between lipid and depression-related traits. LDSR evaluates the genetic overlap between traits and provides additional support to association between the disorders, although this approach was not designed for assessing causality.
Multiple testing control by FDR
Multiple testing was controlled by the Benjamini–Hochberg (Benjamini & Hochberg, Reference Benjamini and Hochberg1995) false discovery rate (FDR) approach, which controls the expected proportion of false positives among the rejected hypotheses. In this study we set a FDR threshold of 0.05 to declare significance, while results with FDR <0.1 are regarded as suggestive associations. FDR control is also valid under positive (regression) dependency of hypothesis tests (Benjamini & Yekutieli, Reference Benjamini and Yekutieli2001).
‘Negative control’ analysis
To further ensure the validity of our approach, we performed MR analyses on a ‘negative control’ exposure, assumed to be not causally linked to depression. We chose mean platelet volume (Gieger et al., Reference Gieger, Radhakrishnan, Cvejic, Tang, Porcu, Pistis and Soranzo2011) as the exposure and the entire analysis was repeated.
General criteria for assessing the reliability of results
We have performed a comprehensive analysis using multiple MR methods and r 2 thresholds. For consistency, we consider an empirical set of criteria to assess the reliability of findings. We consider a finding as having strong evidence or relatively robust if (1) the association is significant/suggestive after multiple testing corrections (FDR < 0.1), by at least 2 out of the 3 methods (IVW, Egger, GSMR); (2) the direction of association is consistent across the MR methods that yield significant results; and (3) the result is significant/suggestive after FDR correction (FDR<0.1) across ≥2 clumping thresholds. For associations that fulfil (1) and (3) but supported by only one MR method, we generally consider them findings of moderate evidence. Other findings that are nominally significant (p < 0.05) at ≥2 clumping thresholds are considered as having weak evidence in general. We also evaluate each result case by case. We understand that the above criteria is inevitably somehow arbitrary, as there is currently no consensus on what constitutes a reliable or robust MR finding, given the large number of available MR methodologies and tuning parameters. The main underlying principle is that different methods may have their own limitations, and results supported by multiple approaches may be more reliable. For example, GSMR and MR-Egger belong to two different methodologies to account for pleiotropy (‘outlier-removal’ v. regression-based) and have their own limitations (Hemani, Bowden, & Davey Smith, Reference Hemani, Bowden and Davey Smith2018a). We also present the full results of our primary MR analysis as a spreadsheet (online Supplementary Table S1) for easy searching and for more informed judgement of the reliability of results.
We highlight a few points here before proceeding to the full results. As we will observe later, a number of associations were observed at higher r 2 thresholds but weaker/absent at more stringent thresholds (e.g. 0.01/0.001). Relaxing the clumping threshold results in inclusion of more genetic instruments, which usually leads to increase in precision (reduction in s.e.) of the causal estimates (Burgess et al., Reference Burgess, Dudbridge and Thompson2016). For example, one may see from online Supplementary Table S1 that for the same MR methodology and exposure-outcome pairs, s.e. usually decreases as r 2 threshold is relaxed. At lower thresholds, the absence of associations could sometimes be due to less precise effect estimates (leading to lower power for the same effect), and such lack of association per se does not preclude the existence of genuine causal relationships. Nevertheless, the actual significance level at different clumping thresholds is dependent on both the effect estimate and its s.e. (hence p values may not always be lower with lower thresholds). Secondly, some methods may have better power than others in a given scenario. For example, GSMR was reported to achieve better power than MR-IVW or Egger when the number of instruments is large (Zhu et al., Reference Zhu, Zheng, Zhang, Wu, Trzaskowski, Maier and Yang2018). If we compare MR-IVW and MR-Egger, the s.e. of causal estimates is usually higher with MR-Egger (Burgess & Thompson, Reference Burgess and Thompson2017). Therefore, even if a finding is genuine, it may not be detected by all MR methods. Different MR approaches have their own strengths and limitations, and require different assumptions, which is why we employed multiple approaches here. Please refer to other reviews (e.g. Burgess et al., Reference Burgess, Smith, Davies, Dudbridge, Gill, Glymour and Relton2019; Hemani et al., Reference Hemani, Bowden and Davey Smith2018a) for detailed discussions. Of course, a finding is considered more robust if corroborated by numerous methods.
Results
Lipids as exposure and depression-related phenotypes as outcome (univariable MR)
LDL-c as exposure
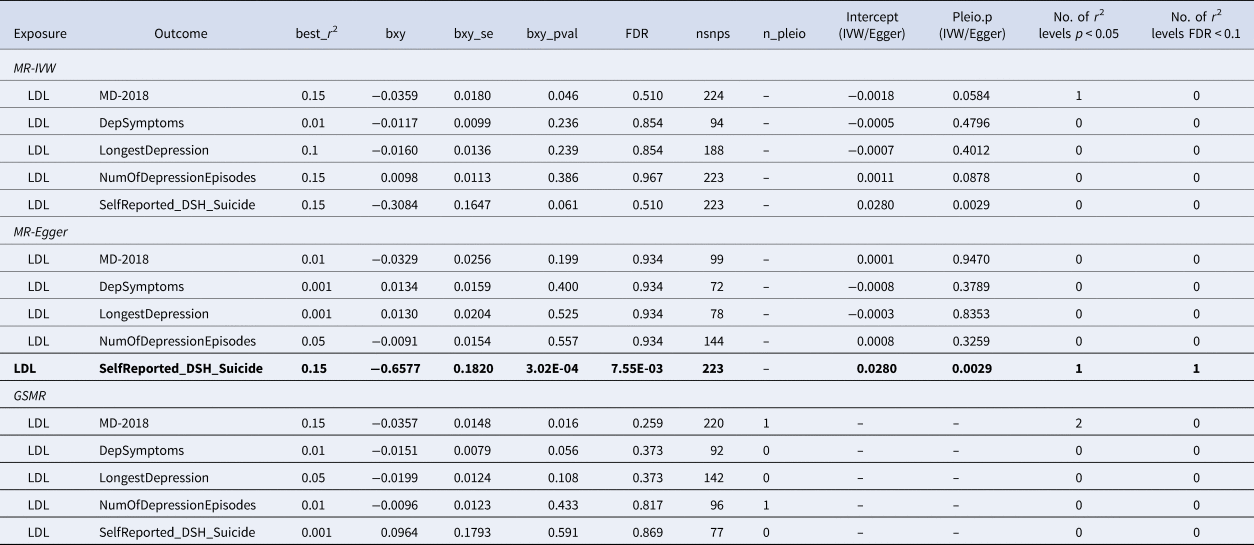
Overall we did not observe highly robust causal associations between LDL-c and depression outcomes (Table 1, online Supplementary Table S1). The only significant finding that passed FDR correction (FDR < 0.05) was LDL-c with DSH/suicide using MR-Egger (r 2 = 0.15; OR for one-s.d. decrease in LDL-c = 1.930, 95% CI 1.234–2.758, p = 3.02 × 10⁻⁴, FDR = 7.55 × 10⁻³). The Egger intercept was significant (intercept = 0.0280, p = 0.003), hence MR-IVW may be biased. As the finding was not supported by GSMR and at other clumping thresholds, we consider the level of reliability as weak to moderate. Besides, nominally significant (p < 0.05) inverse associations of LDL-c with MD were observed with GSMR at two r 2 levels (lowest FDR = 0.259) and MR-IVW at one r 2 level. However, since the result did not pass FDR correction, we consider this association of at most weak evidence requiring further replications.
MR result with LDL-c as exposure and depression traits as outcome

IVW, inverse variance weighted approach; Egger, Egger regression approach; GSMR, Generalised Summary-data-based Mendelian Randomisation.
MD-2018: Major depression (GWAS data from Wray et al., Reference Wray, Ripke, Mattheisen, Trzaskowski, Byrne and Abdellaoui2018); DepSymptoms: depressive symptoms; LongestDepression, longest duration of depressed or low mood (UK Biobank data); NumOfDepressionEpisodes, number of episodes with depressed or low mood for at least one week (UK BioBank data); SelfReported_DSH_Suicide, history of deliberate self-harm or suicide (UK BioBank data).
Best_r 2: LD-clumping r 2 threshold for which the most significant association was observed [a total of 5 thresholds (i.e. 0.001, 0.01, 0.05, 0.1, 0.15) were tested]; bxy: regression coefficient from MR; bxy_se: standard error of bxy; bxy_pval: p value of bxy; FDR, false discovery rate (i.e. q-value) corresponding to the observed p value; nsnps: total number of SNPs used as genetic instruments; n_pleio: number of SNPs that are likely pleiotropic and excluded based on HEIDI-outlier test in GSMR; Pleio_p, pleiotropy p value based on testing whether the intercept from Egger regression is significantly different from zero. The last two columns indicate the number of r 2 clumping levels at which a nominally significant (p < 0.05) or suggestive association after FDR correction (FR < 0.1) is achieved.
Results with FDR < 0.05 (i.e. significant FDR control for multiple testing) are in bold. Those with FDR<0.1 are in italics.
HDL-c as exposure
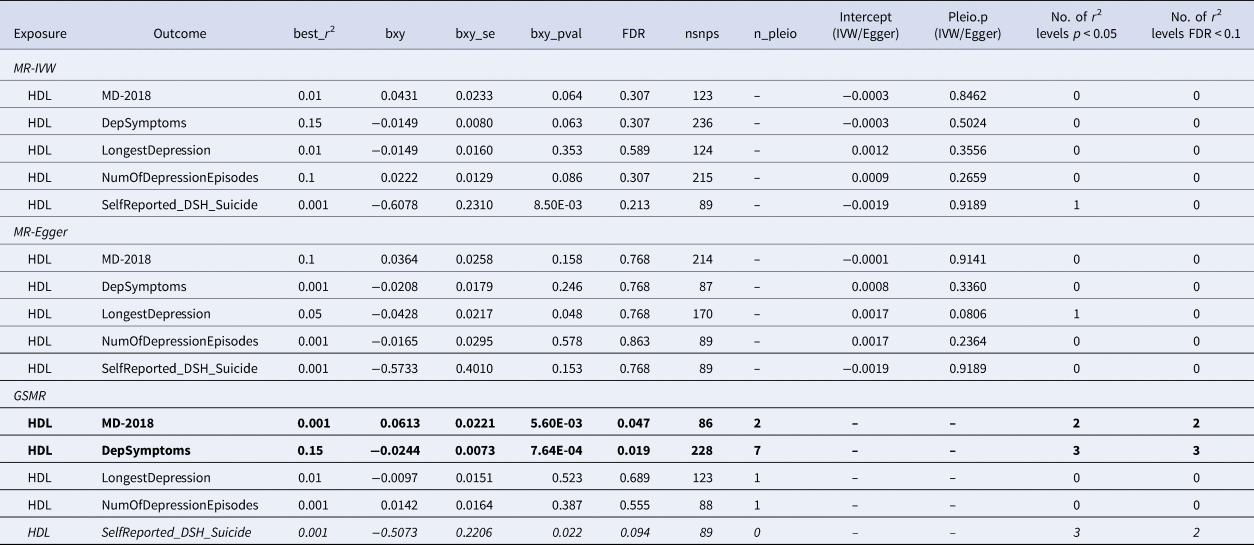
We observed inverse causal associations between HDL-c and DS with GSMR that passed multiple testing correction (best r 2 = 0.15; β = 0.0244 for one-s.d. decrease in HDL-c, CI 0.0102–0.0387; p = 7.64 × 10⁻⁴; FDR = 0.0192) (Table 2, online Supplementary Table S1). Similar results were observed when the r 2 threshold was changed to 0.05 or 0.1, with FDR<0.1 (online Supplementary Table S1). On the other hand, using GSMR, we observed a positive association of HDL-c with MD (best r 2 = 0.001; OR = 1.063 for one-s.d. increase in HDL-c, CI 1.018–1.110; p = 5.6 × 10⁻³; FDR = 0.0467); similar result was observed at r 2 = 0.01. Both of the above associations were supported by an MR method at ≥2 thresholds, hence we consider these findings of moderate evidence. Nevertheless, it is slightly surprising that the effect directions are opposite for MD and DS, which is discussed later.
MR result with HDL-c as exposure and depression traits as outcome

Please refer to Table 1 for legends.
In addition, we observed weak to moderate evidence of an inverse association of HDL-c with DSH/suicide by GSMR across two clumping thresholds (with FDR < 0.1).
TC as exposure
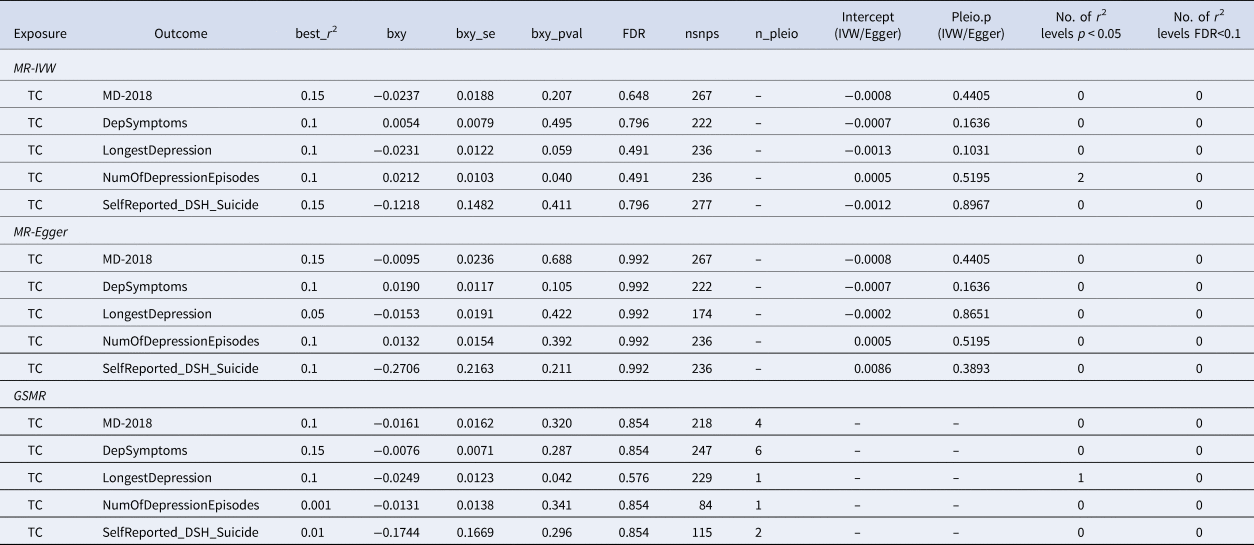
Overall no robust causal associations were observed, and no findings passed FDR correction (Table 3, online Supplementary Table S1). There were nominally significant associations of TC with the number of depressive episodes at two r 2 thresholds (MR-IVW), and one nominally significant finding with longest period of depression (GSMR). However, also in view of the absence of associations with other depression phenotypes, we consider the above findings of at most weak evidence.
MR result with TC as exposure and depression traits as outcome

Please refer to Table 1 for legends.
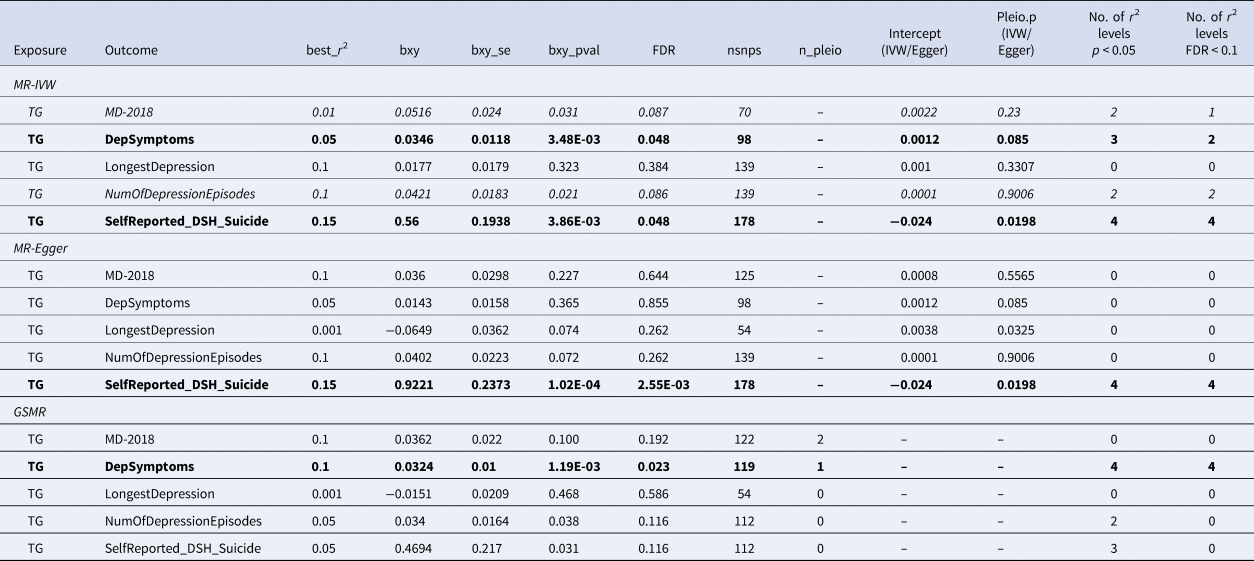
TG as exposure
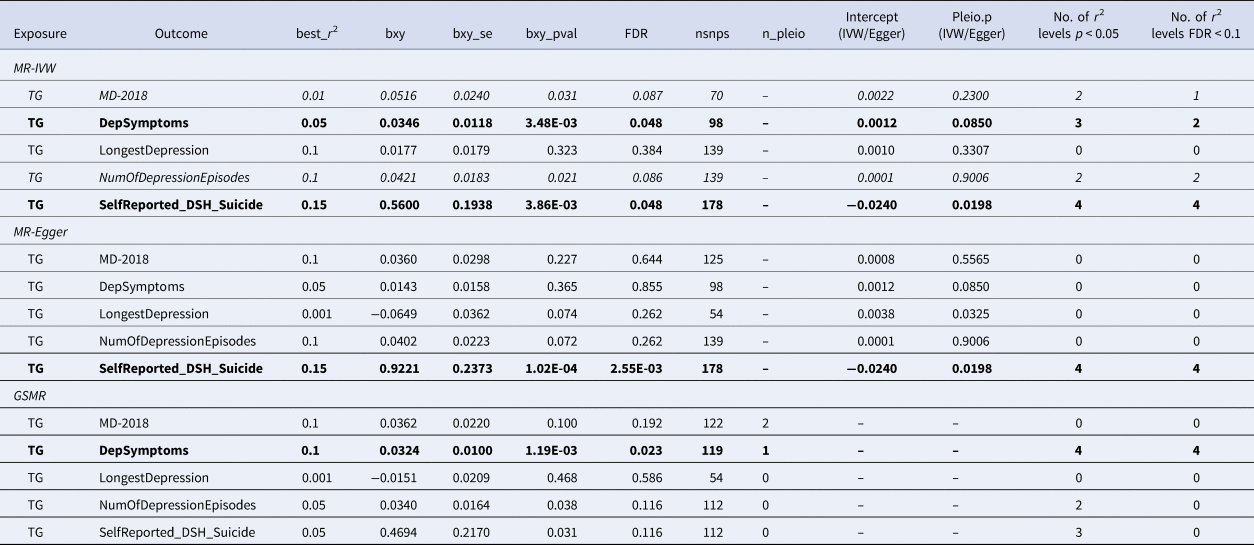
We observed a relatively robust causal association between TG and DS (best r 2 = 0.05 for MR-IVW; β for one-s.d. increase in TG = 0.0346, CI 0.0114–0.0578; p = 3.48 × 10⁻³, FDR = 0.0483) (Table 4, online Supplementary Table S1). The finding was supported by GSMR, with similar effect estimates (best r 2 = 0.1, β = 0.0324, CI 0.0127–0.0519; p = 1.19 × 10⁻³, FDR = 0.0231). Of note, the association was supported by findings having FDR < 0.1 at multiple r 2 thresholds. Besides, LDSR showed significant genetic correlation between TC and DS (rg = 0.138, p = 0.004; FDR = 0.04). Taken together, there is strong evidence that TG is causally related to higher DS.
MR result with TG as exposure and depression traits as outcome

Please refer to Table 1 for legends.
We found another relatively consistent causal association between TG and DSH/suicide (best r 2 = 0.15; MR-Egger: OR for one-s.d. increase in TG = 2.514, CI 1.579–4.003; p = 1.02 × 10⁻⁴; FDR = 2.55 × 10⁻³). The finding was supported by both MR-Egger and MR-IVW at four r 2 thresholds (r 2 = 0.01/0.05/0.1/0.15), with FDR < 0.1. We note that at r 2 = 0.1 and 0.15, the pleiotropy p values were significant, indicating imbalanced pleiotropy and MR-IVW could be biased. However, MR-Egger supported significant causal associations at these thresholds. In addition, GSMR detected nominally significant associations at three r 2 thresholds, with a relatively low FDR (0.116).
As for other phenotypes, nominally significant associations between TG and MD were observed at two thresholds by MR-IVW, with FDR less than or close to 0.1 (FDR = 0.0868 and 0.102 at r 2 = 0.01 and 0.1 respectively). Interestingly, LDSR revealed a highly significant genetic correlation between TG and MD (rg = 0.129, p = 0.0002, FDR = 0.004). The TG->MD association was supported by one MR approach, and coupled with a significant genetic correlation, we consider the evidence as moderate. For number of depressive episodes, we observed associations at r 2 = 0.1 and 0.15 with MR-IVW, achieving FDR < 0.1. It was partially supported by GSMR at two clumping thresholds with FDR close to 0.1. We also consider this finding of moderate evidence.
Multivariable MR
MVMR is considered a secondary analysis here. Since there are no rigorous methods to account for SNP correlations in MVMR, we mainly discuss the results at a relatively stringent r 2 threshold (0.01), but results at higher thresholds are also presented for reference (online Supplementary Table S2). The results may not be directly comparable to univariable MR where we employed more relaxed thresholds with higher precision in effect estimates (hence potentially better power). At r 2 = 0.01, several results were suggestive at FDR < 0.1, including TG->DS, and LDL-c->DS and LDL-c->MD (all directionally consistent with univariable MR; Egger intercept non-significant). The former (TG->DS) provides support that TG may have a direct causal effect on DS, not entirely mediated via other lipids. The latter associations provide some additional evidence for a causal link between LDL-c and depression, which was weakly supported by univariable MR. Other negative results could be due to lower power with fewer instruments at a lower r 2 threshold, and are harder to interpret. However, we note that the associations with DSH/suicide were largely non-significant in MVMR even at higher r 2, suggesting that the total causal effect by each lipid type (TG/HDL-c/LDL-c) on DSH/suicide is partially mediated via other lipids.
LD score regression
LDSR revealed significant genetic correlations for TG with MD and DS (online Supplementary Table S3), both of which passed multiple testing correction. Nominally significant genetic correlation was observed for HDL-c and DS. The above findings were all directionally consistent with univariable MR.
Steiger test of directionality
Online Supplementary Table S4 shows the variance explained in the exposure and outcome by the instrument SNPs. The variance explained in the exposure is clearly larger, and the test returns p values of zero, indicating the causal direction is from lipid traits to depression phenotypes.
Results from negative control experiment
As expected, we do not observe MPV being causally associated with depression phenotypes (online Supplementary Table S5). No results passed multiple testing corrections.
Depression phenotypes as exposure and lipid traits as outcome
To assess whether depression or related phenotypes cause changes in lipid levels, we performed MR analysis in the reversed direction. For depression phenotypes 3 and 4 (longest duration and number of episodes of low/depressed mood), there are no genome-wide significant SNPs which also matched to the set of SNPs included in the lipid GWAS; we therefore excluded them from this analysis.
Major depression as exposure
No results reached significance at FDR<0.05 (Table 5, online Supplementary Table S6). MD was positively associated with raised TG and reduced LDL-c at nominal significance at several r 2 thresholds, however these associations did not survive FDR correction.
MR result with depression traits as exposure and lipids as outcome

Please refer to Table 1 for legends. GSMR and MR-Egger are not applicable for DepSymptoms or DSH/suicide as there are too few SNPs.
Results are the same at different r 2 thresholds for DepSymptoms and DSH/suicide, so no best r 2 is presented.
Depressive symptoms and DSH/suicide as exposure
We did not find any results reaching significance (Table 5). We only have 2 and 1 SNP(s) respectively as instruments for MR analysis of DS and DSH/suicide, hence tests for pleiotropy cannot be carried out.
Discussions
In this study, we employed MR to reveal causal relationships between lipid levels and depression-related phenotypes. For TG, we observed strong evidence for a causal link with increased DS and relatively consistent associations with higher risks of DSH/suicide. There was moderate evidence for positive associations of TG with MD and number of episodes of low mood.
As for previous studies on TG and depression, a previous meta-analysis (Wu et al., Reference Wu, Ding, Wu, Xie, Hou and Mao2016) showed that suicidal psychiatric patients had lower TG than non-suicidal patients, but such difference was not significant when comparing suicidal patients with healthy controls. However, there was significant heterogeneity and evidence of publication bias; also as many studies are cross-sectional or case-control in nature, causality cannot be accurately determined. Our analysis is not focused on suicidal risks within patients, so is not contradictory with findings from (Wu et al., Reference Wu, Ding, Wu, Xie, Hou and Mao2016). Some studies reported raised TG in depression (e.g. Elovainio et al., Reference Elovainio, Pulkki-Raback, Kivimaki, Jokela, Viikari, Raitakari and Keltikangas-Jarvinen2010; Enko et al., Reference Enko, Brandmayr, Halwachs-Baumann, Schnedl, Meinitzer and Kriegshauser2018; Nunes et al., Reference Nunes, Piccoli de Melo, Pizzo de Castro, Barbosa, Vargas, Berk and Maes2015; Oh & Kim, Reference Oh and Kim2017), but meta-analysis on the topic is lacking. Of note, a prospective study in Finnish young adults showed that steeply rising TG levels throughout childhood and adulthood was associated with increased DS in adulthood (Elovainio et al., Reference Elovainio, Pulkki-Raback, Kivimaki, Jokela, Viikari, Raitakari and Keltikangas-Jarvinen2010), consistent with the present finding of a causal role of TG in the development of DS. In another longitudinal study (Persons, Robinson, Coryell, Payne, & Fiedorowicz, Reference Persons, Robinson, Coryell, Payne and Fiedorowicz2016), women belonging to the category of lowest TG had significantly lower risks of depression in unadjusted analyses, although the association was insignificant when covariates were included. In a very recent meta-analysis of first-episode patients with MD (Wei et al., Reference Wei, Cai, Liu, Liu, Wang, Tang and Wang2020), the authors found that elevated TG was associated with first-episode MD. We also observed significant genetic correlation between TG and MD or DS. This finding provided evidence to a shared genetic component between the two types of traits, which was also supported by studies using other methodologies such as polygenic scores (Milaneschi et al., Reference Milaneschi, Lamers, Peyrot, Abdellaoui, Willemsen, Hottenga and Penninx2016; Wong et al., Reference Wong, Chau, Ao, Mo, Wong, Wong and So2019). However, genetic correlation does not account for horizontal pleiotropy (e.g. genetic variants may affect DS/risk of depression via pathways independent of TG) and is not a proof of causation.
For HDL-c, the findings appeared more complex. We observed moderate evidence that raised HDL-c is causally associated with lower DS by GSMR. Interestingly, GSMR also revealed a tentative positive association with MD. Both findings were significant at FDR<0.05. This apparent discordance in causal direction is interesting, and we hypothesise some possible explanations here. Firstly, it is possible that HDL-c may affect subjects at different ‘positions’ of the depression spectrum differently. To recap, the DS GWAS is largely driven by a general population sample (~58% of entire sample), while patients in the MD sample were mainly clinically ascertained. A risk factor may affect people with severe DS or clinical MD differently from those at the lower/middle range of DS (who are not clinically depressed). As a related example, Chang et al., showed that the effect of polygenic scores were significantly different at different quantiles of depressive symptom scores (Chang et al., Reference Chang, Glymour, Walter, Liang, Koenen, Tchetgen and Kubzansky2014). Another possibility for the discrepant direction may be heterogeneity in study samples (detailed later).
A number of epidemiological studies have investigated the link between cholesterol levels and depression. As already mentioned, a meta-analysis (Shin et al., Reference Shin, Suls and Martin2008) reported higher HDL-c was associated with higher MD risks. Another recent meta-analysis on the other hand reported lower HDL-c in first-episode depression patients (Wei et al., Reference Wei, Cai, Liu, Liu, Wang, Tang and Wang2020). However, high heterogeneity was observed for both meta-analyses. So far, epidemiological evidence for the association between HDL-c and DS or MD was largely inconsistent. With regard to other types of lipids, meta-analyses have reported inverse associations of LDL-c (Persons & Fiedorowicz, Reference Persons and Fiedorowicz2016) and TC (Shin et al., Reference Shin, Suls and Martin2008) with depression, for which we did not observe robust evidence for causal relationships here. For LDL-c and HDL-c, we observed weak-to-moderate evidence for a causal link with reduced DSH/suicide risk. The finding requires further replications especially due to the small number of cases, but is concordant with meta-analysis (Wu et al., Reference Wu, Ding, Wu, Xie, Hou and Mao2016) that both types of cholesterol are lower in suicidal patients compared to healthy controls.
We also studied causal relationship in the reversed direction, but did not find evidence that depression and related traits cause changes to lipid levels. The number of instrument SNPs included is small especially for DS and DSH/suicide, which may lead to low power in detecting causal relationships. Further analysis in larger samples is warranted.
Limitations
There are several limitations to the current study. Firstly, there is likely heterogeneity within each study sample. For example, within the sample of MD patients, they might be substantial differences with respect to disease etiology, symptoms, course of illness etc. Here we have not studied how the causal relationship with lipids may differ with different depression subtypes or symptoms. In a similar vein, we have not studied how the relationship may be affected by patients' clinical background. For instance, age, sex, baseline metabolic profile, family history, past medical and drug history etc. may all affect the relationship between lipid levels and depression. Future studies may include in-depth analysis on stratified samples (e.g. male/female-only; young/elderly subjects only). Another related limitation is that different covariates may be included in different GWAS studies. However, most have adjusted for population stratification, which is the major confounder in genetic studies.
Yet another limitation is that for studies that included the UKBB, depression traits are self-reported instead of being assessed by health-care professionals by clinical criteria. There may be heterogeneity in the definition of ‘feeling depression/down’ for different people. Of note, phenotypes 3–5 are fully based on self-reporting from participants, while DS and MD samples are partially based on self-reports. Under-reporting may also be present (especially for DSH/suicide), which limits the effective sample size. Particularly findings concerning DSH/suicide are based on relatively small number of cases, and require further replications to confirm. Despite the above limitations, detailed clinical assessment is very costly and some subjectivity is still inevitable; the current approach allows larger samples to be studied.
In addition, due to the high proportion of subjects on lipid-lowering therapy, genetically predicted lipid levels (especially those at the higher end) may be less correlated with the measured levels than expected. Another potential limitation is collider or selection bias for the UKBB sample. The sample appears to be enriched for people who are healthier and better educated (Munafo, Tilling, Taylor, Evans, & Smith, Reference Munafo, Tilling, Taylor, Evans and Smith2018); this selection may be associated with both better lipid profiles and lower DS. Such selection bias can lead to bias in MR; but the bias is usually small if the selection effects are weak or moderate (Gkatzionis & Burgess, Reference Gkatzionis and Burgess2019). Besides, censoring may be present, in that some people could develop MD later in life after recruitment.
With regard to the MR approach used in this study, it is also not without limitations. As we employed genetic instruments to model the risk factor, the analysis reflects effects of a chronic exposure of (genetically) lowered lipid levels to the outcomes. The effects of shorter-term exposures, such as taking a LDL-lowering drug for 1 year, cannot be inferred with full confidence from MR alone. Also, non-linear relationships between the exposure and outcome are not captured with the present method.
As detailed above, findings from epidemiological studies were mixed and did not completely agree with our findings. Heterogeneity in samples and study design may partially explain this; also, some shared (but non-causal) genetic or environmental risk factors may be present for both depression and dyslipidemia.
Clinical implications
We highlight some areas of potential clinical relevance here, but we caution that due to various limitations, one should not over-interpret the current findings.
Some may consider that cholesterol or TG levels may serve as predictive biomarkers for depression/suicide. However, MR reflects the effects of long-term exposure and the time-dependent implications are unclear. The effect sizes reported in this study are also relatively modest. If the current findings are replicated, however, blood lipids may be integrated with other biomarkers and clinical factors to construct better prediction models for depression/suicide.
Another potential clinical implication is on whether lipid-lowering therapies may or may not alter depression/suicidal risks. This is a controversial topic and no consistent conclusions have been reached despite numerous studies (McTaggart & Jones, Reference McTaggart and Jones2008; Salagre, Fernandes, Dodd, Brownstein, & Berk, Reference Salagre, Fernandes, Dodd, Brownstein and Berk2016; Yatham, Yatham, Ravindran, & Sullivan, Reference Yatham, Yatham, Ravindran and Sullivan2019; You, Lu, Zhao, Hu, & Zhang, Reference You, Lu, Zhao, Hu and Zhang2013). Based on this study, we are unable to conclude whether lipid-lowering therapies result in altered risks of depression/suicide, owing to several limitations. Firstly, MR models the effects of long-term exposure; effects of shorter exposure at later stages of life may not be reliably determined. In addition, different lipid-lowering drugs act in different pathways, and the effects on depression could differ. Also, many lipid-lowering drugs have effects on more than one lipid type, for example statins lower LDL-c but also reduce TG (Vrablik & Ceska, Reference Vrablik and Ceska2015) and raise HDL-c (McTaggart & Jones, Reference McTaggart and Jones2008). The combined effect is difficult to judge. Finally, the effects and side-effects of lipid-lowering drugs may differ from patient to patient, and careful judgement of cardiovascular benefit v. other side-effects is important.
From a therapeutic point of view, it will be interesting to study whether TG-lowering therapies may ameliorate DS in patients with comorbid hypertriglyceridemia and depression; however this study cannot provide confirmatory evidence. Of note, a small-scale clinical trial reported that treatment of severe hypertriglyceridemia resulted in improvement of DS (Glueck et al., Reference Glueck, Tieger, Kunkel, Tracy, Speirs, Streicher and Illig1993).
In conclusion, through an MR analysis with large sample sizes, we found that high TG may be a causal risk factor for depression and related traits. The results for cholesterols were more complex and mixed, but there is moderate evidence to suggest that HDL-c may be causally associated with depression traits. The findings may help shed light on the mechanisms underlying depression, and may have clinical implications. However, further clinical studies are required to replicate the findings and to investigate the effects/side-effects of lipid-lowering therapies. Further experimental works are also warranted to elucidate the mechanism involved.
Supplementary material
The supplementary material for this article can be found at https://doi.org/10.1017/S0033291720000951.
Acknowledgements
We would like to thank Prof. Stephen Tsui and the Hong Kong Bioinformatics Center for computing support. This study was partially supported by the Lo Kwee Seong Biomedical Research Fund, the Health and Medical Research Fund (06170506) and a Chinese University of Hong Kong Direct Grant.
Author contributions
Conceived and designed the study: HCS. Study supervision: HCS. Main data analysis: HCS, CKLC, with advice from PCS. Data interpretation: HCS, YYC, PCS. Drafted the manuscript: HCS, YYC.
Conflicts of interest
The author declares no conflict of interest.