Introduction
First time in 2004, Yeh et al. [Reference Yeh, Chen, Lin, Gan, Chin, Shun, Tsau and Chang1] coined the term “high-entropy alloys” (HEAs) for the solid-solution phase stabilized owing to high-configurational entropy along with higher enthalpy of mixing [Reference Pradeep, Wanderka, Choi, Banhart and Raabe2, Reference Senkov, Miller, Miracle and Woodward3, Reference Zaddach, Niu, Koch and Lrving4]. HEAs are constituted by using at least five principal elements as precursors with atomic concentration varying from 5 to 35% [Reference Miracle and Senkov5]. Recently, HEAs have attracted considerable attention due to their unique properties, such as excellent oxidation and corrosion resistance, high strength and reasonable ductility, good hardness, excellent high temperature strength, and wear resistance [Reference Zhang, Mao, Wang, Gludovatz, Zhang, Mao, George, Yu and Ritchie6, Reference Li, Tian, Schönecker, Zhao and Vitos7, Reference Li, Pradeep, Deng, Raabe and Tasan8, Reference Zou, Ma and Spolenak9, Reference Tang, Yuan, Tsai, Yeh, Lundin and Liaw10, Reference Deng, Tasan, Pradeep, Springer, Kostka and Raabe11, Reference Fu, Chen, Wen, Chen and Lavesrnia12]. There are four “core effects” among which the sluggish diffusion effect, which prevents the formation of second phase or restricts nanoscale precipitation. In addition, configurational entropy effect stabilizes the solid-solution phase. The lattice distortion effect interrupts the motion of dislocations and/or twin boundaries giving rise to high strength. Another interesting effect, known as cocktail effect, is attributed to the complex interactions among the multiconstituent elements to explain the unique behavior of HEAs [Reference Laurent, Akhatova, Perrière, Chebini, Sauvage, Leroy and Champion13, Reference Zhang, Zuo, Tang, Gao, Dahmen, Liaw and Lu14].
Generally, many of the HEAs crystallize into body-centered cubic (BCC) and/or face-centered cubic (FCC) structures because of the high entropy of mixing [Reference He, Liu, Wang, Wu, Liu, Nieh and Lu15, Reference He, Wang, Huang, Xu, Chen, Wu, Liu, Nieh, An and Lu16, Reference Ji, Fu, Wang, Wang, Zhang, Wang and Zhang17]. Usually, single-phase FCC HEAs show the high ductilities and low strengths while reverse properties, that is, low ductility and high strength, are exhibited by the BCC HEAs [Reference Pradeep, Wanderka, Choi, Banhart and Raabe2, Reference Schuh, Mendez-Martin, Völker, George, Clemens, Pippan and Hohenwarter18, Reference Senkov, Senkova and Woodward19]. It is obvious that the crystal structure plays an important role to control over mechanical performance of HEAs [Reference Sriharitha, Murty and Kottada20]. More recently, the HEAs with hexagonal close-packed (HCP) structure also have been studied [Reference King, Middleburgh, Mcgregor and Cortie21, Reference Maiti and Steurer22, Reference Yadav, Mukhopadhyay, Mishra, Mukhopadhyay and Srivastava23]. It has been reported that to stabilize the multicomponent solid solutions in HEAs, valance electron concentration (e/a), the atomic size differences (δ), entropy of mixing (ΔS mix), and enthalpy of mixing (ΔH mix) together play a crucial role [Reference Zhang, Zuo, Tang, Gao, Dahmen, Liaw and Lu14, Reference Zhang, Zhou, Lin, Chen and Liaw24, Reference Guo, Ng, Lu and Liu25].
It is observed that the metals and alloys that crystallize into a BCC phase can demonstrate high hydrogen storage capacity [Reference Sakintuna, Lamari-Darkrim and Hirscher26, Reference Akiba and Iba27, Reference Akiba and Nakamura28, Reference Xin, Johansson, Wolff and Hjörvarsson29]. The lattice strain at the interface or at lattice may be favorable for hydride formation [Reference Xin, Johansson, Wolff and Hjörvarsson29]. Hence, it is interesting to design the new multicomponent HEAs utilizing the hydride-forming elements and understanding towards the microstructures and evolution of different phases. A typical feature of HEAs is the lattice distortion arising from the difference in the atomic radii of the constituents. The HEAs constituted by strong hydride-forming elements (Ti, Zr, Hf, Nb, and V) have been shown to crystallize into BCC-type structure [Reference Sahlberg, Karlsson, Zlotea and Jansson30]. This alloy has significant lattice distortion because of the large difference in atomic radii of the constituents (δ = 6.82%), which may make it potential for use as an efficient hydrogen-storage material. It has been reported that the Laves phase coexists with the other crystalline phases [Reference Murty, Yeh and Ranganathan31]. In our previous work, we have demonstrated a successful formation of a single Laves phase in an equiatomic TiZrVCrNi HEA [Reference Zhang, Zhou, Lin, Chen and Liaw24]. High strength and thermodynamic stability have been exhibited by multicomponent HEAs in the single-phase substitutional solid-solution state [Reference Cantor32, Reference Ranganathan33, Reference Senkov, Scott, Senkova and Miracle34, Reference Firstov, Gorban, Krapivka and Pechkovskii35, Reference Singh and Kumar36]. The stability of the solid solution is determined by its free energy [Reference Yang and Zhang37, Reference Firstov, Gorban, Danilenko, Karpec, Andreev and Makarenko38]. At the expense of crystal structure and lattice distortion, the higher strength parameters are achieved [Reference Firstov, Gorban, Andreev and Krapivka39]. Therefore, a number of factors including e/a ratio should be taken into account in order to make HEAs based on a single-phase substitutional solid solution [Reference Trefilov, Mil’man and Firstov40, Reference Pettifor41]. Hence, for a HEA of single-phase, Laves-type structure must have an appropriate e/a ratio within the range of 6–7 electrons per atom [Reference Gorban, Krapivka and Firstov42].
The present investigations have aimed at analyzing the formation and stability of Laves phase or any other competing phases in the as-cast and annealed Ti–Zr–V–Cr–Ni–Fe alloys. We have investigated the structure of the Laves phase with varying amount of Fe in hydride-forming elements and also the stability of the phase from thermodynamics and other factors.
Analysis
In liquid or completely random solid solution state, the configurational entropy of HEAs has been found to be much higher in comparison with the conventional solid-state crystalline alloys [Reference Guo and Liu43]. In liquid or completely random solid solution state, the configurational entropy is calculated by the Boltzmann equation [Reference Swalin44];
 $$\Delta {S_{{\rm{mix}}}} = - R\sum\limits_{i = 1}^n {{x_i}\ln {x_i}} \quad ,$$
where R is the gas constant, x i is the molar fraction of ith element, and n is the number of alloying elements. Another important parameter considered for the phase selection in the multicomponent alloys is the geometry effect or the atomic size mismatch, more specifically atomic size difference (δ) [Reference Cahn and Hassen45]. The requirement of δ on the phase selection is in line with the well-established Hume–Rothery rule for a binary substitutional solid-solution phase [Reference Fang, Xiao, Lei, Li and Dong46]. According to the Hume–Rothery rule, two more parameters required to determine the solid solubility are electronegativity (Δχ) and valance electron concentration (e/a) [Reference Fang, Xiao, Lei, Li and Dong46]. All the above-mentioned parameters including enthalpy of mixing are defined by Eq. (2)–(5), respectively [Reference Zhang, Zhou, Lin, Chen and Liaw24].
 $$\Delta {H_{{\rm{mix}}}} = \sum\limits_{i = 1,i \ne j}^n {4\Delta H_{{\rm{AB}}}^{{\rm{mix}}}{x_i}{x_j}} \quad ,$$
where  $\Delta H_{{\rm{AB}}}^{{\rm{mix}}}$ is the enthalpy of mixing for the binary equiatomic AB alloys; the atomic size mismatch, δ is given by
 $$\delta = \sqrt {\sum\limits_{i = 1}^n {{x_i}{{\left( {1 - {{{r_i}} \over {\bar{r}}}} \right)}^2}} } ,\quad \bar{r} = \sum\limits_{i = 1}^n {{x_i}{r_i}} \quad ,$$
x i and r i are the at.% and atomic radius of the ith element, respectively. The electronegativity difference, ΔχAllen is given by
 $$\Delta {\chi _{{\rm{Allen}}}} = \sqrt {\sum\limits_{i = 1}^n {{x_i}{{\left( {{\chi _i} - \bar{\chi }} \right)}^2}} ,\;\bar{\chi }} = \sum\limits_{i = 1}^n {{x_i}{\chi _i}} \quad ,$$
where χi is the Pauling electronegativity for the ith element. The valence electron concentration, e/a, is given by [Reference Senkov, Wilks, Scott and Miracle47].
 $${e / a} = \sum\limits_{i = 1}^n {{x_i}{{\left( {{\rm{VEC}}} \right)}_i}} \quad ,$$
where (VEC)i is the valence electron number for the ith element (the number of total electrons including the d-electrons accommodated in the valence band).
For the HEAs, there is another empirical parameter, Λ, for the formation of disordered single-phase solid solutions (DSS) [Reference Singh and Kumar36], defined as
 $$\Lambda = {{\Delta {S_{{\rm{mix}}}}} \over {{\delta ^2}}}\quad ,$$
Yang and Zhang [Reference Wang, Huang, Yang, Wang and Liu48] have suggested a new parameter Ω to replace ΔH mix in the previous ΔH mix − δ scheme and is defined as
 $$\Omega = {{{T_{\rm{m}}}\Delta {S_{{\rm{mix}}}}} \over {\left| {\Delta {H_{{\rm{mix}}}}} \right|}},\quad {T_{\rm{m}}} = \sum\limits_{i = 1}^n {{x_i}{{\left( {{t_{\rm{m}}}} \right)}_i}} \quad ,$$
where (t m)i is the melting point of ith alloying element.
Very recently, Wang et al. have proposed a new geometric parameter γ, which shows a better performance in distinguishing the solid solutions from intermetallic compounds and is defined as [Reference Wang, Huang, Yang, Wang and Liu48];
 $$\gamma = {{1 - \sqrt {{{{{\left( {{r_{\rm{S}}} + \bar{r}} \right)}^2} - {{\bar{r}}^2}} \over {{{\left( {{r_{\rm{S}}} + \bar{r}} \right)}^2}}}} } \over {1 - \sqrt {{{{{\left( {{r_{\rm{L}}} + \bar{r}} \right)}^2} - {{\bar{r}}^2}} \over {{{\left( {{r_{\rm{L}}} + \bar{r}} \right)}^2}}}} }},\quad \bar{r} = \sum\limits_{i = 1}^n {{x_i}{r_i}} \quad ,$$
where r S and r L are the atomic radii for the smallest and the largest atom.
Results and discussion
X-ray measurement
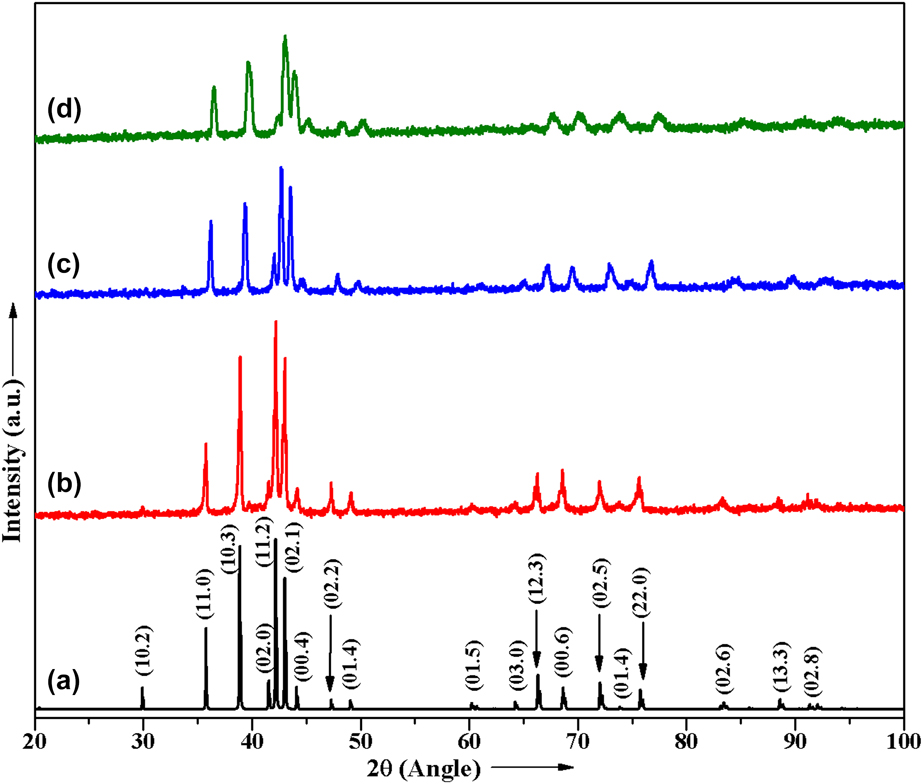
The crystal structures of the as-cast HEAs have been studied by XRD, which is shown in Fig. 1. Figure 1(a) shows the simulated XRD patterns of ordered C14 Laves phase (a = 5.01 Å, c = 8.20 Å, space group P63/mmc). It is evident from Fig. 1 that the diffraction peaks of simulated pattern resemble with the experimentally observed pattern very well. The Fe0.5 alloy exhibits the MgZn2-type C14 Laves phase [Fig. 1(b)]. Figure 1(c) reveals that as we increase the Fe concentration, peaks become broader due to an atomic-size mismatch. Further increasing the Fe at.%, the diffraction peak intensity remarkably got reduced and led to a higher noise-to-signal ratio. The diffraction peaks of Fe1.5 alloy was found to be broader along with the significant reduction in the peak intensity [Fig. 1(d)]. The crystallite size and the lattice strain of the as-cast HEAs have been estimated employing the integral width of the physical broadening of XRD peak profile. In a single-line analysis, the lattice strain and apparent crystallite size are related to Gaussian and Cauchy widths of the XRD peak of the Bragg angle (θ). The estimated lattice strain and crystallite size (defect-free correlation length) was 0.1%, 0.2%, and 0.3%, and 151 nm, 129 nm, and 110 nm for the Fe0.5, Fe1.0, and Fe1.5 alloys, respectively. The lattice strain estimated to appear reasonable but the crystallite size data obtained should be understood from different viewpoints. This crystallite size is basically indicative of correlation length (defect-free) or mean-free path inside the single grain. Smaller size means that grain contains lots of defects in terms of dislocations, stacking faults, twin boundaries, sub-angle grain boundaries, etc.
XRD patterns of Ti–Zr–V–Cr–Ni–Fe HEA: (a) simulated pattern: as-cast; (b) Fe0.5; (c) Fe1.0; and (d) Fe1.5.

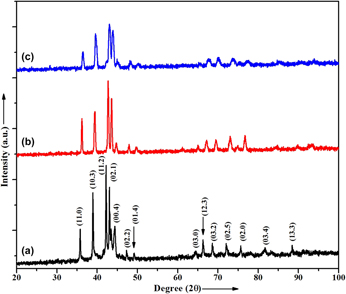
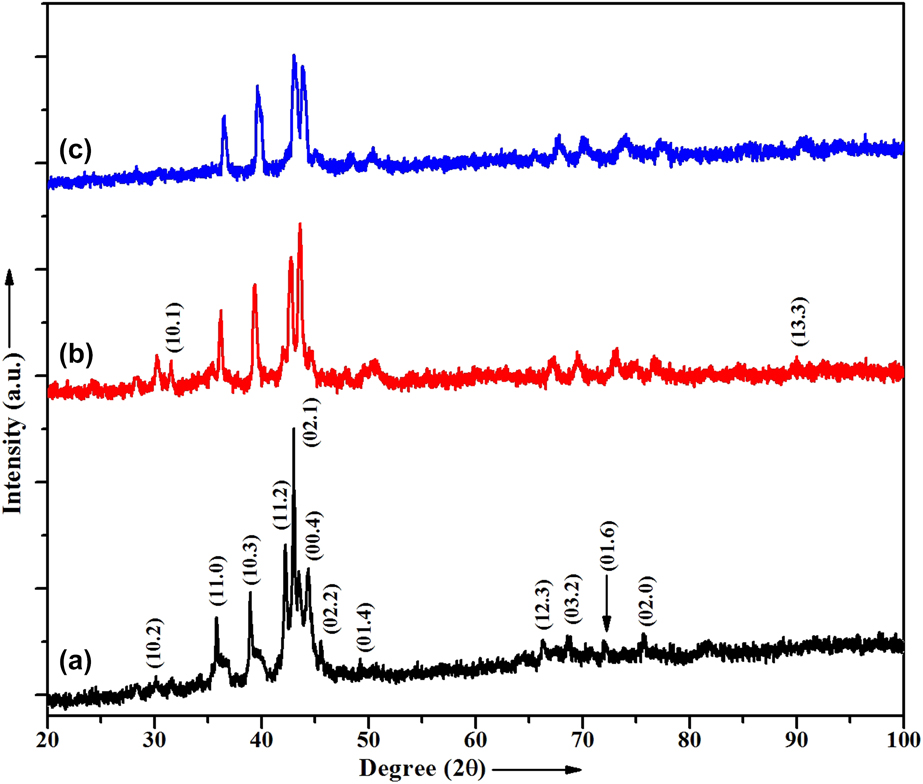
The XRD patterns of the samples annealed at 800 °C and then slow-cooled (SC) are presented in Fig. (2). The XRD peaks of SC Fe0.5 alloy presented in Fig. 2(a) are broader and less intense in comparison with the as-cast alloy shown in Fig. 1(a). Some peaks such as (10.2) (01.5) and (02.6) were found to be absent in SC Fe0.5 alloy. As stoichiometry of Fe increases from 0.5 to 1.0 and 1.5, the peaks become broader with the expense of peak intensity (Figs. 2(b) and 2(c)). This indicates the evolution of lattice strain with increase in Fe content suggesting disordering in the occupation of constituents at their proper lattice sites. Moreover, the XRD patterns of the alloys after annealing do not show any extra peak of other phase, which indicates that in the present stoichoimetric composition, a stable Laves phase was formed. Figure 3 shows the XRD patterns of the samples annealed at 800 °C and then rapidly quenched. From the figure, it is confirmed that in the rapidly quenched samples, some peaks of the hexagonal C14 Laves phase are absent in comparison with the as-cast alloys and having a high signal-to-noise ratio. No diffraction peaks other than Laves phase were observed in the present XRD observation limit. However, the peak intensity gets reduced and peaks become broader in comparison with the as-cast and slow-cooled alloys. This broadening in the diffraction peaks are attributed due to an increase in the residual lattice strain.
XRD patterns of annealed samples followed by slow cooled alloys: (a) SC Fe0.5, (b) SC Fe1.0, and (c) SC Fe1.5.

XRD patterns of annealed samples followed by rapidly quenched alloys: (a) RQ Fe0.5, (b) RQ Fe1.0, and (c) RQ Fe1.5.

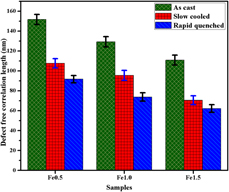
The le-Bail profile fitting of the as-cast and annealed Ti–Zr–V–Cr–Ni–Fe alloys have been done via Jana-2006 software, which is shown in Fig. (S1: Supplementary material). A good agreement between the observed (green) and calculated (red) position of XRD diffraction profiles with the high acceptability and reliability factors was found. The le-Bail profile fitting of XRD data and the difference between the calculated and observed data have been shown by magenta color [Figs. S1(a)–S1(c)]. This demonstrates that all the specimens under investigation were of single C14 Laves phase (i.e., no secondary phase was present). The structure of all the alloys was same (Laves phase) with a very small difference in the lattice parameters. The lattice parameter for all the as-cast and annealed alloys obtained from the refinement data is given in table (ST1: Supplementary material). It is interesting to note that the lattice parameters of the as-cast and slow-cooled alloys are approximately same while the rapidly quenched alloys exhibit the lower values of the lattice parameter. This small variation in the lattice parameter is due to fast cooling rate. It is well known that Fe always tries to destabilize the structure. But in the present stoichiometry, it could not destabilize the structure, which may be due to its smaller atomic radius. The lattice parameter difference in rapidly quenched in comparison with other alloys with the same composition arises because of quenching rate used to be very fast. Hence, constituent atoms do not have sufficient time to occupy the proper lattice site. This introduces the strain and disorder in the lattice. This lattice variation introduces the residual strain and decrease in the defect-free correlation length leading to peak broadening. These defect-free correlation length of all alloys have been estimated by Scherrer formula (D = kλ/β cos θ) and presented in Fig. (4). The defect-free correlation length was found to decrease with Fe content for the as-cast and annealed alloys. The rapidly quenched alloys have smallest size of defect free zones (∼91–62 nm for RQ Fe0.5 and RQ Fe1.5 alloys, respectively) in comparison with the as-cast and slow cooled alloys. Thus, we can say that the quenching introduces the lattice distortion and other smaller defects, which increases as the Fe at.% enhances. All the XRD peaks have been well indexed corresponding to the Laves phase structure. The le-Bail profile fitting of the XRD data (Supplementary material) also confirms the Laves phase nature of the samples.
Variation in defect correlation length of different Ti–Zr–V–Cr–Ni–Fe HEAs.

SEM measurement
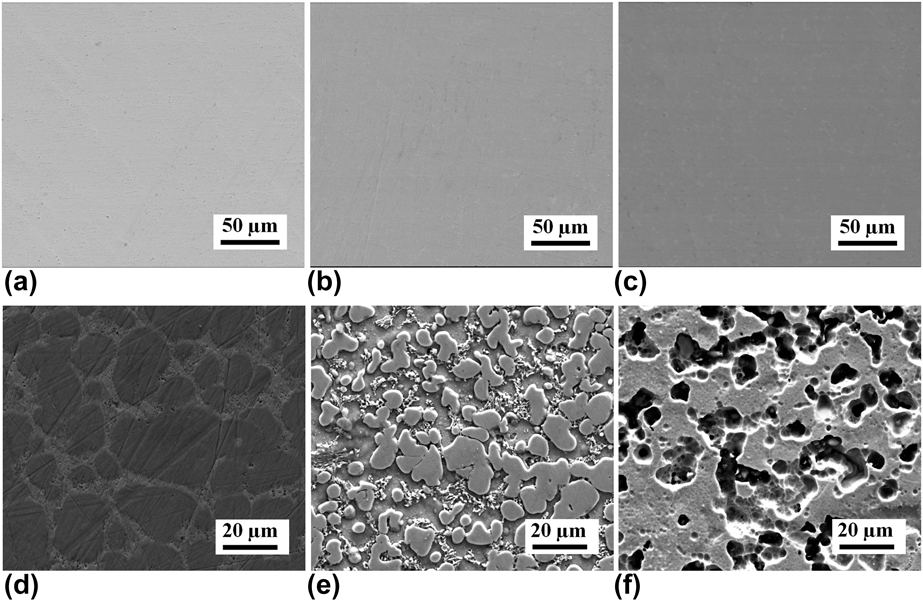
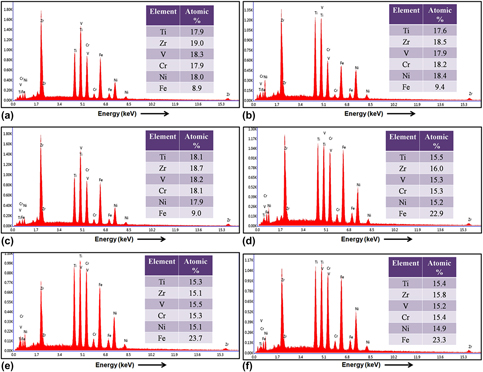
The backscattered electrons (BSE) SEM images of the polished cross section of the as-cast and annealed (Fe0.5) alloys were carried out. The typical features of BSE images have been shown for Fe0.5 sample in Figs. 5(a)–5(c). All the alloys reveal the complete absence of any precipitation, second phase, or contrast difference signifying the formation of a single phase in the present observation condition. These results are consistent with our XRD outcomes, which confirm the formation of single Laves phase in all compositions of investigated alloys. We also have examined the etched surface of all these alloys under secondary electron mode. Figures 5(d)–5(f) shows that the SEM micrographs of Fe0.5 alloys reveal the contrast variation, which has been due to the removal of misoriented grain, defects, or grain boundaries by etching. In order to check the purity and composition, SEM-EDX measurement of the above-mentioned alloys has been performed and is shown in Figs. 6(a)–6(f). The EDX spectra exhibits the peaks associated with none other than constituents confirm the purity of the samples. The EDX has been taken from the five different regions for each sample. The average constituent of the individual alloy has been given in the each spectrum, and the composition of all the alloys was found to be close to stoichiometry.
The BSE SEM images of (a) Fe0.5, (b) SC Fe0.5, and (c) RQ Fe0.5; secondary electron SEM images of etched (d) Fe0.5, (e) SC Fe0.5, and (f) RQ Fe0.5 alloys, respectively.

SEM-EDX spectra of as-cast and annealed Fe0.5 and Fe1.5 etched alloys: Fe0.5 (a); SC Fe0.5 (b); RQ Fe0.5 (c); Fe1.5 (d); SC Fe1.5 (e); RQ Fe1.5 (f), respectively.

TEM measurement
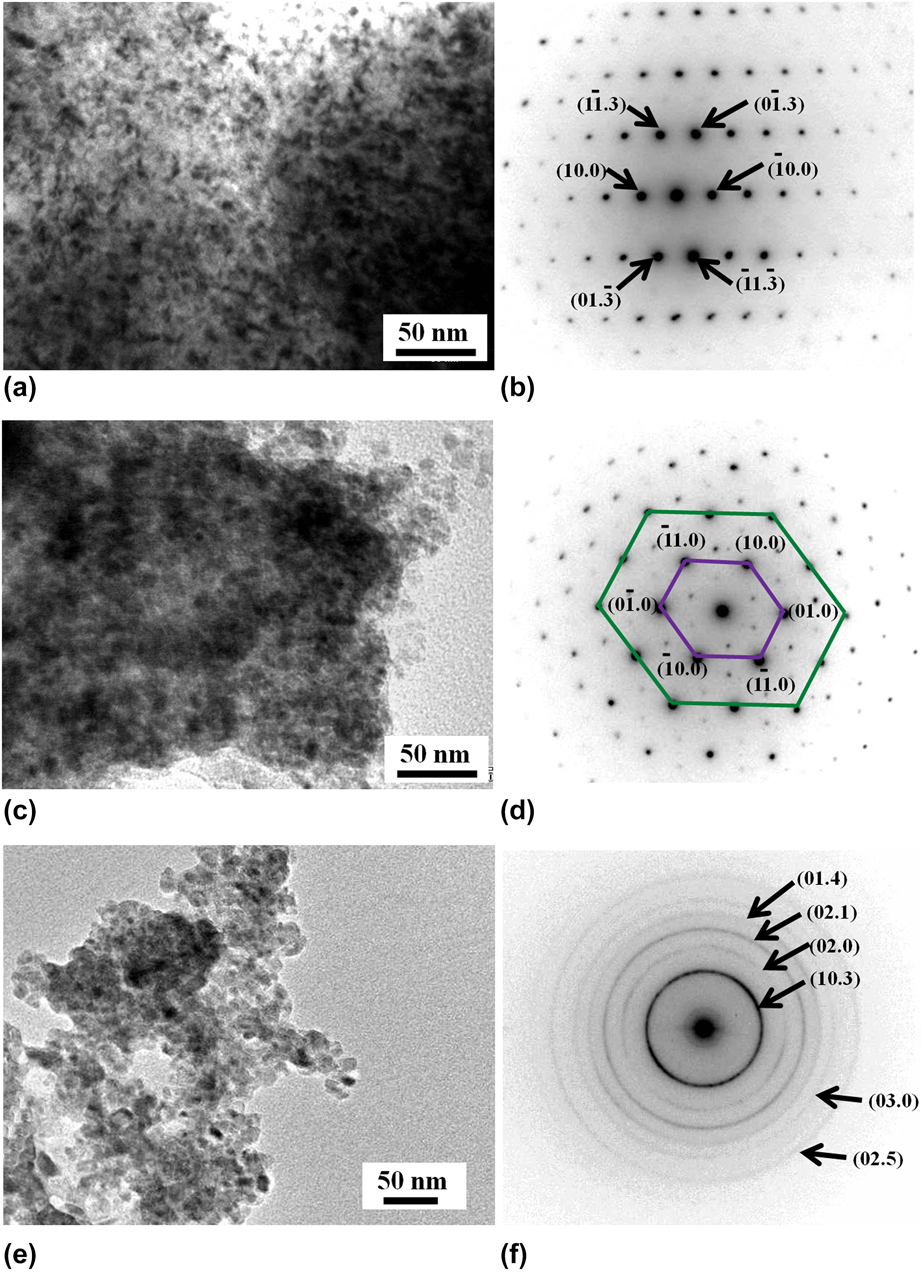
Furthermore, in order to explore the more details of the microstructure and phases present in the alloys, TEM investigation has been conducted. The TEM bright field (BF) images and the corresponding selected area electron diffraction (SAD) patterns obtained from the bulk HEA have been shown in Fig. 7. The nano-sized grains are clearly visible in the BF TEM image of the as-cast Fe0.5 alloy, Fig. 7(a). The SAD pattern obtained from Fig. 8(a), corresponding to the zone axis  $\left[ {\bar{1}21} \right]$, is presented in Fig. 7(b). This SAD pattern has been indexed as hexagonal phase (HCP), which agrees with the result obtained from XRD patterns. Figures 7(c) and 7(d) presents the TEM microstructure and the corresponding SAD pattern of the as-cast Fe1.0 HEA. The SAD pattern along the
 $\left[ {00\bar{1}} \right]$ zone axis has been successfully indexed as HCP structure, [Fig. 7(d)]. By joining the SAD spots, an irregular hexagon was formed, and also, some extra spots with very less intensity were found [Fig. 7(d)]; these features confirm the distortion of HCP phase in the as-cast Fe1.0 alloy. Therefore, we can say that an increase in the Fe content produces the distortion in the perfect crystal structure. The lattice parameters of the as-cast alloys calculated based upon the measurements of the spot spacing in such SAD patterns were found to be consistent with XRD results. The TEM BF image of the as-cast Fe1.5 alloy clearly shows the presence of smaller nano-sized defects [Fig. 7(e)]. The SAD pattern corresponding to Fig. 7(e) gives rise to the ring pattern, which is a signature of polycrystalline structure, and it arises when the grains are of fine size. These Deby-rings were successfully indexed by estimating the d-values of the individual rings and confirming the HCP structure of the Fe1.5 alloy, Fig. 7(f).
The BF images and corresponding selected area diffraction pattern of as-cast (a, b) Fe0.5; (c, d) Fe1.0; and (e, f) Fe1.5 HEAs alloys, respectively.

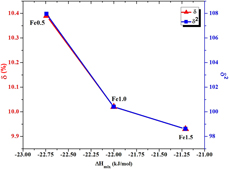
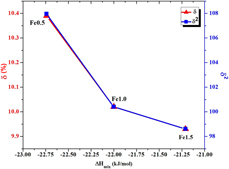
A ΔH mix − δ/δ2 plot for Ti–Zr–V–Cr–Ni–Fe HEAs.

Thermodynamical investigation
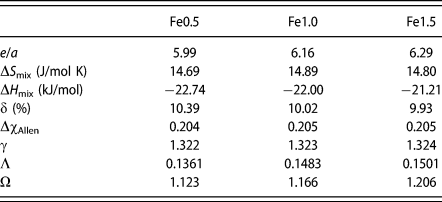
The enthalpy of mixing (ΔH mix), atomic size difference (δ), electronegativity difference (Δχ), and some other thermodynamic parameters of Ti–Zr–V–Cr–Ni–Fe HEAs have been estimated and are given in Table II. The thermodynamic and physicochemical parameters of the alloying elements required for the calculation are taken from literature and given in tables (ST2 and ST3: Supplementary material) [Reference Takeuchi and Inoue49, Reference Senkov and Miracle50, 51]. Quite often, it has been observed that in case of multiprincipal element alloys, instead of formation of intermetallic compound, the evolution of two or more disordered solid-solution phase can take place [Reference Guo, Hu, Ng and Liu52, Reference Tong, Chen, Chen, Yeh, Shun, Tsau, Lin and Chang53, Reference Guo and Liu54]. Moreover, in some cases, due to the high-configurational entropy, amorphous phase can also be formed [Reference Guo, Hu, Ng and Liu52, Reference Wang55, Reference Ding and Yao56, Reference Cunliffe, Plummer, Figueroa and Todd57, Reference Ren, Li and Fu58]. Therefore, there exists an uncertainty in classifying the HEAs on the basis of threshold configurational entropy. Miracle et al. [Reference Miracle, Miller, Senkov, Woodward, Uchic and Tiley59] have proposed that the configurational entropy (calculated using the Boltzmann equation) has to be larger than 1.5R for HEAs. While considering the formation of multicomponent alloys, the phase stability depends on both entropy (ΔS mix) and enthalpy (ΔH mix), which are related to Gibb’s free energy of mixing as ΔG mix = ΔH mix − TΔS mix, where T is the temperature at which different elements are mixed. Thus, a comparison between ΔH mix and TΔS mix gives thermodynamics consideration for phase-selection rules. The configurational entropy (ΔS mix) of the multiprincipal element alloys was estimated to be 14.69, 14.89, and 14.80 J/mol K (Table I) for Fe0.5, Fe1.0, and Fe1.5 specimen, respectively. These results agree with Miracle’s suggestion for HEAs [Reference Yang and Zhang37]. Figure 8 presents the ΔH mix versus δ/δ2 plot for the alloys under investigation. In order to distinguish the solid solutions, intermetallic compounds or the amorphous phase in HEAs, the ΔH mix − δ rule has been widely accepted [Reference Murty, Yeh and Ranganathan31], though sometimes different research groups suggested different threshold values for ΔH mix and δ. This difference arises because of the different database they used to estimate the empirical parameters. Ren et al. have reported the threshold values of ΔH mix and δ for the formation of the solid solution are ΔH mix ≥ −8.8 kJ/mol and δ ≤ 0.028 [Reference Takeuchi, Amiya, Wada, Yubuta, Zhang and Makino60]. Zhang et al. have claimed the same δ value (≤0.066) but slightly different range of ΔH mix, that is, −15 ≤ ΔH mix ≥ 5 kJ/mol [51, Reference Tong, Chen, Chen, Yeh, Shun, Tsau, Lin and Chang53]. The large negative value of ΔH mix (−22 aprox.) suggests the solid solution formation in the present experimental condition while δ value (∼0.1) suggests the formation of metallic glasses. But we could not find any signature of glassy phase in the as-cast and annealed alloys. The detailed investigation of XRD along with le-Bail profile fitting could not give any signature of glassy phase. Takeuchi et al. have utilized ΔH mix − δ2 plot in order to describe the phase selection in bulk metallic glasses and HEAs and found that solid solution was formed at more negative ΔH mix and larger δ value (>0.046) [Reference Takeuchi, Amiya, Wada, Yubuta, Zhang and Makino60]. It has been found that ΔH mix − δ and ΔH mix − δ2 plots provide very similar information [Reference Guo61]. Figure 8 clearly shows that both ΔH mix − δ and ΔH mix − δ2 plots have same nature and they support the previous findings [Reference Dong, Lu, Jiang, Wang and Li62, Reference Tsai63]. There is another empirical parameter Λ [Eq. (5)] that describes the formation of disordered solid solution in HEAs. The value of Λ at which the disordered solid solution can be formed was found to be greater than 0.96 [Reference Guo, Hu, Ng and Liu52]. In the present investigation, the value of Λ was found to be smaller than that required for the formation of disordered solid solution. Hence, it may be concluded that no disordered solid solution can be expected to be formed in the present experimental condition. The value of dimensionless parameter Ω [Eq. (7)] for the solid solution formation should be greater than 1.1 [Reference Tong, Chen, Chen, Yeh, Shun, Tsau, Lin and Chang53]. The larger value of Ω (Table II) in present alloys may indicate the signature for the formation of the solution formation.
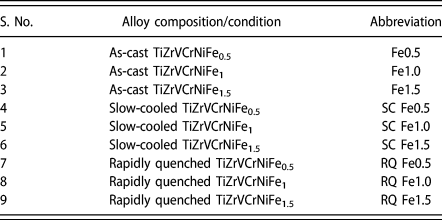
Abbreviations of TiZrVCrNiFex (where x = 0.5, 1.0, 1.5) HEA.

Thermodynamic parameters calculated for the present high-entropy intermetallic phase in Ti–Zr–V–Cr–Ni–Fe HEAs.

The parameter γ [Eq. (8)] suggests that the solubility of constituents in multiprincipal component alloys is mostly determined by the largest and the smallest size atoms. Definitely, the atoms with smallest and largest size play an important role in determining the stability of the lattice. The solid solution occurs at γ < 1.175 and metallic glasses with intermetallics lie in the range γ > 1.175 [Reference Guo and Liu54]. In the present case, the value of γ (Table II) suggests that the formation of metallic glasses or intermetallics would be more favorable than the solid-solution phase. The range of “γ” parameter is one of the necessary but not sufficient conditions to decide the solubility of multiprincipal component alloys. Hence, in order to confirm the solubility, the electron concentration, electronigativity, and enthalpy of mixing should also be considered. Recently, it has been reported that the electronegativity differences (ΔχAllen) and the atomic size mismatch (δ) play a very crucial role in the formation of topologically closed packed phases in HEAs [Reference Miracle and Senkov5, Reference Dong, Lu, Jiang, Wang and Li62]. They claimed that the intermetallic Laves phases form when δ > 5% and ΔχAllen > 7%. These criteria of Laves phase formation was found to be reasonably fulfilled in our study (ΔχAllen ≥ 20% and δ ≥ 10%). These results are also supportive of the structural outcomes (Figs. 1–3). The stoichiometric formula of Laves phase compound in general is AB2 of three different crystal structures, namely, C14, C15, and C36. These compounds comprise with the double layers of hexagonal arrays of A elements surrounded by tetrahedral of the B atoms. C14 structure consists of MgZn2-type hexagonal structure with packing ABABAB while C15 structure comprises with MgCu2-type cubic phase with packing ABCABCABC. The C36 structure is considered as a transitional phase between the C14 and C15 structures having MgNi2-type hexagonal phase with packing ABACABAC. It has been found that the Ti–Zr–V–Cr–Ni–Fe alloy in the present stoichiometry crystallizes into C14-type Laves phase, which is a pseudo-binary AB2-type alloy. The Ti and Zr atoms occupy the A site, and rest constituent elements (V, Cr, Ni, and Fe) go to B site in the lattice. Moreover, the present stoichiometry leads to the deficiency/excess of atoms (Fe) at B sites, which introduce the defects in the lattice by the exchange of atoms. In case of component alloys, Tsai has suggested the concept of high-entropy intermetallics that appear to be pseudo-binary/ternary intermetallics having crystal structures similar to that of binary intermetallic phases [Reference Mizutani64]. It has been observed that in multicomponent alloy systems, the number of sublattices is less than the number of constituents [Reference Miracle and Senkov5].
The effect of average valance electron concentration is also useful in determining the phase and solubility in case of HEAs [Reference Wang, Huang, Yang, Wang and Liu48]. Generally, there are two definitions of electron concentration: (i) total number of electrons including the d-electrons in the valence band (VEC) and (ii) average itinerant electrons per atom (e/a) [Reference Mizutani64, Reference Massalski65]. For the multicomponent alloy, VEC or e/a is defined as the weighted average from VEC or e/a of the constituents elements [Eq. (8)]. The electron concentration per atom has been estimated utilizing the outer shell electron of each element in the Ti–Zr–V–Cr–Ni–Fe HEAs. The total number of outer shell electrons for Ti 4(3d 24s 2), Zr 4(4d 25s 2), V 5(3d 34s 2), Cr 6(3d 54s 1), Ni 10(3d 84s 2), and Fe 8(3d 64s 2), respectively. e/a definition works with Hume–Rothery rule so obviously as its effect on the crystal structure is remarkable for the so-called electron compounds [Reference Senkov and Miracle50]. Recently, it has been reported that the C14 Laves phase formed in the HEAs for which e/a value lies in the range 6–7 [Reference Gorban, Krapivka and Firstov42]. This criteria for the C14 phase formation was found to be reasonably satisfactory in our present study (e/a = 5.99, 6.16, and 6.29 for Fe0.5, Fe1.0, and Fe1.5 alloys, respectively). For the stability in transition metal alloys, filling of d-band plays a very crucial role. The transition metals were chosen to form Laves phase in the present investigation. This C14 Laves phase in the as-cast and annealed state is found to have quite good thermal stability and hence can be regarded as the stable phase. Therefore, this investigation provides evidence to the general applicability of the e/a rule for such extended series of several other alloy systems. As discussed above, in the present investigation, C14 Laves phase was formed alone in the as-cast, annealed, and quenched alloys. It is reasonably assumed that the unit-cell of the Laves phase would shrink with addition of smaller Fe atoms and this point is also supported by the calculated lattice parameters listed in table (ST1: Supplementary material). Actually, the lattice contraction is confirmed from the fact that the XRD diffraction peaks from C14 Laves phase shift toward high angles with increase in Fe content (Fig. S2: Supplementary material). Therefore, the atomic size of the constituent affects the lattice parameter of the C14 Laves phase in present study.
Conclusions
We have successfully synthesized hexenary Ti–Zr–V–Cr–Ni–Fe HEAs having hexagonal C14 Laves phase. All the alloys exhibited stability up to 800 °C and lattice contraction with increase in Fe content. Besides the equiatomic Ti Zr V Cr Ni Fe alloy, the other two alloys (Fe0.5 and Fe1.5) exhibit a deviation from the stoichiometry of ideal AB2-type Laves phases. These two nonequiatomic alloys can lead to the deficiency and excess of atoms of B-type atoms, which can give rise to the vacancy and antisite defects, respectively. This kind of vacancy and antisite occupation of B atoms in A site may play an important role for stabilization of the high-entropy intermetallic phase. The phase stability in Ti–Zr–V–Cr–Ni–Fe HEAs and its relationship to the physicochemical and thermodynamic properties of major constituent hydride-forming alloying elements have been systematically established through appropriate processing. The nanoscale microstructure, indicating the nanoscale defects in the range of 110–151 nm, has been observed in the Laves phase alloy processed through various processing routes, and may be beneficial for the hydrogen storage properties.
Experimental details
Alloy synthesis
All the constituents (Ti, Zr, V, Cr, Ni, and Fe) of high purity (∼99.99%) were used as raw material. These ingots of TiZrVCrNiFex (where x = 0.5, 1.0, 1.5) HEAs have been synthesized by means of induction melting under the dynamic argon atmosphere. The pellets, in the form of circular button with diameter of 1.5 cm, were prepared by a hydraulic press. In order to melt (5 g by weight), it was placed in a quartz tube surrounded by a pyrex glass jacket through which a continuous flow of cold water was arranged. To insure the homogeneity, the ingots were remelted four times and annealed at 800 °C for 25 h. They were further processed in two different conditions: (i) to be left inside the furnace to cool down slowly and (ii) to be quenched form the higher temperature into the liquid nitrogen. For the sake of convenience, the abbreviations of the alloys are given in Table I.
Structural characterization
The X-ray diffractometer (XRD; PANalytical Empyren diffractometer, Malvern PANalytical B.V., Almelo, Netherlands) with Cu Kα radiation (1.5406 Å) was utilized to analyze the crystal structures of the cast, and annealed and quenched alloys. The XRD measurements of all alloys have been performed in the Bragg–Brentano para focusing geometry in continuous scan mode at 45 kV and 30 mA in the 2θ range from 20 to 100°. The le-Bail profile fitting of the as-cast and annealed alloys has been performed via Jana-2006 software (Institute of Physics Department of Structure Analysis, Praha, Czech Republic). The surface morphology and chemical composition of the alloys have been investigated by scanning electron microscopy (SEM; FEI Quanta 200 F, FEI, Hillsboro, Oregon) equipped with the secondary electron detector, back-scattered electron detector, and energy dispersive X-ray spectrometer. Before the morphological study, the samples have been polished with alumina (Al2O3) powder of 1 µm size. The polished samples have been washed in ultrasonic bath with double distilled water (DW) and methanol. The etching of alloys has been carried out with the solution of DW, nitric acid, and hydrofluoric acid (volume ratio 17:1:2).
Supplementary material
To view supplementary material for this article, please visit https://doi.org/10.1557/jmr.2018.502.
Acknowledgment
The authors would like to thank Prof. R.S. Tiwari (BHU) and Dr. M.A. Shaz (BHU) for a useful discussion. S.S. Mishra thanks the University Grants Commission (UGC), India, for providing BSR fellowship, during which period the work was completed.