I. INTRODUCTION
Al–Li alloys have received extensive attentions recently for military, aerospace, and commercial applications because they offer low densities, improved specific strengths, and high stiffness to weight ratio compared to conventional Al alloys. Reference Tolga and Soutis1–Reference Gomiero, Brechet and Louchet3 It has been reported that each 1 wt% Li added to Al reduces density by 3% and increases elastic modulus by about 6%. Reference Zhang, Zeng, Yang, Shi and Wang4,Reference Shen, Deng and Wang5 At present, most researches are focused on wrought Al–Li alloys, which is mostly because that wrought alloys possess relatively higher strengths. In contrary, there is still lack of researches on cast Al–Li alloys. Casting is not only a low-cost way to manufacture products with complex shapes, but also an effective method to mitigate the anisotropy of mechanical property. Reference Tsivoulas and Prangnell6–Reference Drits, Kadaner, Turkina and Fedotov9 Obviously, it is of great importance to develop the cast Al–Li alloys to broaden their applications. Up to date, the limited researches on cast Al–Li alloys have revealed that a high Li content brings poor ductility which limits its wide application. Reference Drits, Kadaner, Turkina and Fedotov9–Reference Nikitin, Osintsev and Betsofen11 Therefore, to improve the strengths, especially the ductility of cast Al–Li alloys is a very significant task.
To achieve improved mechanical properties, Al–Li alloys are often subject to heat treatments. Reference Mrówka-Nowotnik and Sieniawski12–Reference Kim, Seong, Jun, Shin and Kim16 Generally, in the heat treatment processes, solution treatment (ST) is the first step, and is also the key process toward the desired microstructure and mechanical properties. Reference Min, Zheng and Gong17–Reference Han, Zhang, Liu, He and Zhang19 This is because ST can dissolve the secondary phases and provide super-saturated solid solution for the following aging process. Reference Yu, Yin, Zheng and Yu20 However, the conventional ST for wrought Al–Li alloys is reported to be about 500–520 °C for 0.5–2 h, Reference Li, Kang and Lu7,Reference Zhang, Yang and Xiao8,Reference Li, Tang, Zeng, Zheng and Zheng21 which is not suitable for higher-Li-bearing cast Al alloys due to the differences in composition and microstructure. Wang et al. Reference Wang, Min, Lu and Lu10 reported that the ultimate tensile strength (UTS) and elongation of cast Al–Li–Cu–Zr alloy was significantly improved to 400 MPa and 2.5% after optimum aging treatment. Nikitin et al. Reference Nikitin, Osintsev and Betsofen11 found that the poor ductility of cast Al–Li–Cu–Mn alloy could be improved by heat treatment and the addition of some alloy elements (such as Cd and Be). However, there is no systematic study on the ST of cast Al–Li–Cu–Zr alloy. Consequently, developing a reasonable ST for cast Al–Li–Cu–Zr alloy becomes particularly important.
In brief, the aim of the present work is to investigate the effect of ST on the microstructure and mechanical properties of cast Al–3Li–1.5Cu–0.2Zr alloy. This work not only provides experimental data and theoretical reference, but also assists in the development and wide application of cast Al–Li alloys.
II. EXPERIMENTAL PROCEDURES
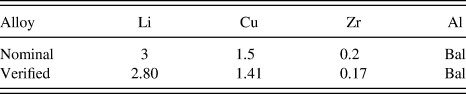
The experimental material Al–3Li–1.5Cu–0.2Zr (wt%) were prepared with 99.7% pure Al, 99.9% pure Li, and master alloys of Al–10Zr, Al–50Cu (wt%). The alloys were melted in graphite crucible in a resistance furnace under the protection of LiCl–LiF flux mixture. After the alloy was completely melted, 0.3% C2Cl6 was used for degassing at 740 °C. The melt was isothermally held at 720 °C for 10 min and stirred well to ensure complete homogenization. Then the melt was poured into a metallic mold preheated to 200 °C. The chemical composition of the studied alloy, measured by inductively coupled plasma-atomic emission spectroscopy, is listed in Table I.
Chemical composition (wt%) of the investigated alloy.

Bal. = Balance
To determine the ST temperatures for Al–3Li–1.5Cu–0.2Zr alloy, differential scanning calorimetry (DSC) analysis was carried out on STA 449F3 differential scanning calorimeter (NETZSCH Group, Selb, Germany). To investigate the effect of ST parameters (solution temperature and time) on microstructure and mechanical properties of cast Al–3Li–1.5Cu–0.2Zr alloy, the as-cast alloy was solution treated (T4) at 540, 550, 560, and 570 °C for different periods of time buried in sands in a resistance furnace, then immediately quenched into cold water. After ST, based on the experimental results in Ref. Reference Il'in, Nikitin, Osintsev and Borisov22, specimens were aged at 175 °C for 8 h in an oil bath. Before and after aging, tensile test was performed on Zwick/Roell Z100 tensile test machine (Zwick Roell Group, Ulm, Germany) at a cross-head speed of 1 mm/min. Following the tensile test, fractography was carried out using scanning electron microscopy (SEM) to study the effect of heat treatment on the fracture morphology.
Microstructure of specimens was observed by optical microscopy (OM; MEF4M, Leica Microsystems, Wetzlar, Germany) and scanning electron microscopy (SEM; JEOL-6460, JEOL Ltd., Tokyo, Japan). The samples for metallographic observation were prepared through a conventional mechanical polishing and followed by etching with Keller's reagent (2 mL HF, 3 mL HCl, 5 mL HNO3, and 190 mL water). To identify the phases components occurring in the alloy, energy dispersive x-ray spectroscopic (EDS) and x-ray diffraction (XRD) were performed. Thin foils for the transmission electron microscopy (TEM) examinations were prepared by the twin-jet electropolishing method using a 4 vol% perchloric acid and 96 vol% ethanol solution cooled down to approximately −30 °C. TEM observation was carried out by JEM2100 microscopy (JEOL Ltd.) operating at 200 kV. Finally, the grain size and volume fraction of residual particles were quantified using the Image-Pro-Plus image analysis software. Ten random views of each specimen were examined to make sure that the results are convincing.
III. RESULTS AND DISCUSSION
A. Microstructure of as-cast alloy
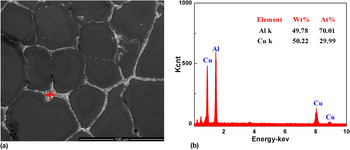
Figure 1(a) presents the SEM image of as-cast Al–3Li–1.5Cu–0.2Zr alloy. Masses of coarse secondary phases along the grain boundary are observed in the as-cast alloy, which is consistent with the reported poor ductility of high Li content Al–Li alloys. Reference Drits, Kadaner, Turkina and Fedotov9–Reference Nikitin, Osintsev and Betsofen11 The reason is that these brittle phases along grain boundaries can not only offer potential sites for stress concentration but also provide possible path for crack propagation. The average grain size of as-cast alloy is approximately 60 μm. Figure 1(b) shows the EDS point analysis of secondary phase marked in Fig. 1(a). It can be seen that the atom ratio of Al to Cu is about 2.
(a) SEM image of as-cast alloy and (b) EDS analysis of intermetallic phase in (a).

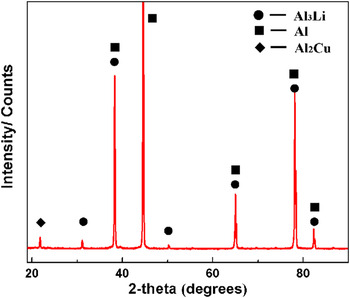
As shown in Fig. 2, the XRD pattern of as-cast alloy confirms the existence of the Al2Cu, Al3Li, and α-Al in the as-cast alloy. Previous researches reported that Al2CuLi was also observed in Al–Li–Cu alloys. Reference Il'in, Nikitin, Osintsev and Borisov22,Reference Liu, Chen and Cui23 According to the EDS and XRD results, the phases analyzed in Fig. 1(a) could be Al2Cu or Al2CuLi.
XRD analysis of as-cast alloy.

B. Effect of ST on microstructure
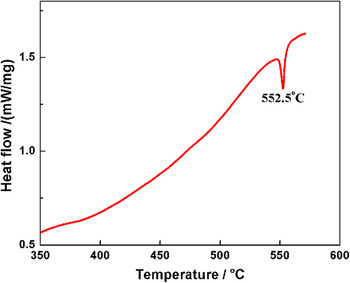
Figure 3 shows the DSC curve of as-cast Al–3Li–1.5Cu–0.2Zr alloy. The endothermic peak sites at 552.5 °C. According to the DSC result, several solution temperatures (540, 550, 560, and 570 °C) are studied in this work.
DSC curve of as-cast alloy.

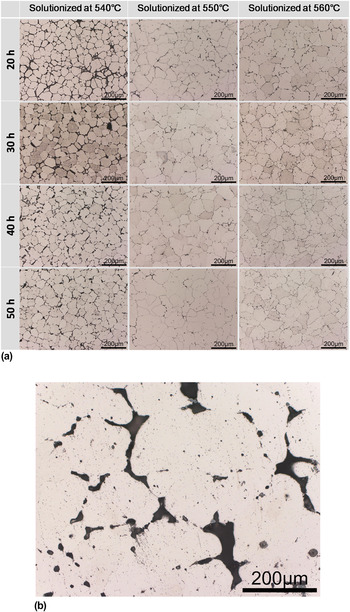
The microstructures of Al–3Li–1.5Cu–0.2Zr alloy solution treated at different conditions are given in Fig. 4. The amount of continuous secondary phases decreases obviously with increasing solution temperature. It seems that there is no obvious reduction in the amount of residual phases as solution time prolongs at 560 °C [Fig. 4(a)]. However, the coarse and continuous residual particles become fragmented and spheroidized with the increase of solution time. And longer solution time can reduce the segregation of solute atoms, which will be beneficial to the following aging treatment. In addition, when temperature increases to 570 °C, melting compounds along grain boundaries and triple conjunctions are observed [dark area in Fig. 4(b)], which means that the specimen is overburnt.
Microstructure of alloy solution treated at (a) 540, 550, and 560 °C for different times and (b) 570 °C for 20 h.

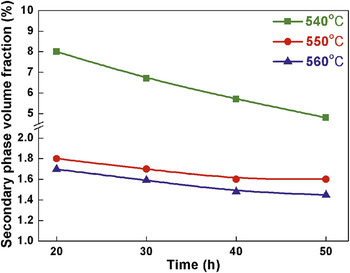
The effectiveness of secondary phase dissolution after different STs is quantified through image analysis, and the results are presented in Fig. 5. The volume fraction of secondary phase decreases from 8 to 4.8% as solution time prolongs from 20 to 50 h at 540 °C. It is also seen that ST at 560 °C is more effective in dissolving secondary phases compared to the lower temperatures. As time prolongs at 550 and 560 °C, the volume fraction of secondary phases decreases gradually and reaches the minimum value of 1.4% (560 °C for 50 h). Meanwhile, the grain size increases slightly with the increase of solution temperature and time due to the inhibition effect of the residual phases.
Secondary phase volume fraction of Al–3Li–1.5Cu–0.2Zr alloy solution treated at different conditions.

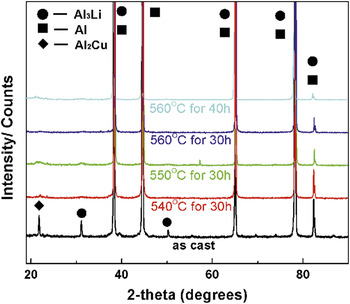
Figure 6 reveals the XRD results of samples solution treated at different conditions. The peak of Al2Cu at 21.8° almost disappears after ST at all studied temperatures, which indicates that the quantity of Al2Cu decreases sharply after ST. In contrast, the peak intensity of Al3Li at 82.6° decreases slowly with the increase of solution temperature and time, which suggests that Al3Li particles dissolve in the matrix gradually as the solution temperature and time increase. Moreover the observed peak of Al3Li at 82.6° shows that the residual phases are mainly Al3Li.
XRD results of Al–3Li–1.5Cu–0.2Zr alloy solution treated at different conditions.

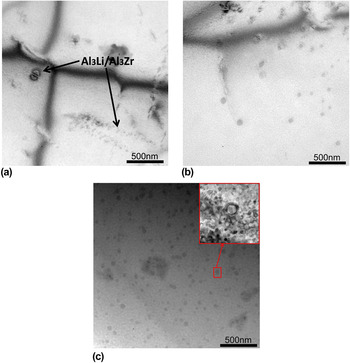
The TEM micrographs of Al–3Li–1.5Cu–0.2Zr alloy after aging at 175 °C for 8 h are shown in Fig. 7. A number of fine Al3Li/Al3Zr particles precipitate in the matrix after aging. The distribution of Al3Li/Al3Zr particles becomes denser and more homogeneous [Figs. 7(a)–7(c)] with increasing solution temperature and time. The high magnification morphology of Al3Li/Al3Zr particles is also presented in Fig. 7(c). It is observed that Al3Zr acts as a core of the precipitation particles and the outer shell consists of Al3Li, which is in good agreement with the reported results. Reference Radmilovic, Tolley, Marquis, Rossell and Lee24 Lin et al. Reference Lin, Zheng and Li25 reported that the nucleation and distribution of precipitation particles have great relationship with the super-saturation degree of alloy elements and the degree of segregation. And the above results also indicate that a proper ST can promote to form homogeneous super-saturated solid solution which makes precipitates fine and uniform.
TEM micrographs of aged alloy solution treated at (a) 540 °C for 30 h, (b) 550 °C for 30 h, and (c) 560 °C for 40 h.

C. Effects of ST on mechanical properties
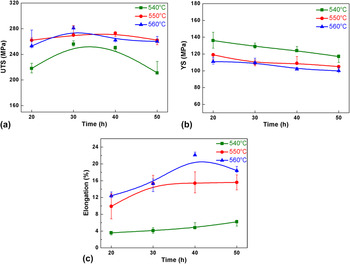
The mechanical properties of Al–3Li–1.5Cu–0.2Zr alloy solution treated at different conditions are presented in Fig. 8 [UTS in Fig. 8(a), yield strength (YS) in Fig. 8(b) and elongation in Fig. 8(c)]. It can be seen that with the increase of solution time, the UTS [Fig. 8(a)] first increases and then decreases due to the combined effects of secondary phases strengthening and solution strengthening. Moreover, ST at 550 and 560 °C results in a significant increase in UTS compared to 540 °C. This could be attributed to the microstructure modifications as shown in Fig. 4(a), where the amount of continuous secondary phases decreases obviously at higher temperatures.
Tensile properties of Al–3Li–1.5Cu–0.2Zr alloy solution treated at different temperatures: (a) UTS, (b) YS, and (c) elongation.

Figure 8(b) demonstrates the evolution of YS with solution temperature and time. It is seen that the YS decreases slightly with the increase of solution time at all temperatures. It is known that ST decomposes the network of secondary phases, and atoms dissolve partially into matrix. Reference Lin, Zheng and Li25,Reference Sjölander and Seifeddine26 The slight decrease of YS could be attributed to both the dissolution of secondary phases and the increase of grain size [Fig. 4(a)]. In addition, the YS values of samples solution treated at 540 °C are about 20 MPa higher than those at higher temperatures, which might be closely related to the finer grain size and higher amount of residual phase (as seen in Figs. 4 and 5).
The results in Fig. 8(c) suggest that the elongation increases gradually with increasing solution temperature. As ST changes from 540 °C for 20 h to 560 °C for 40 h, the elongation increases from 3.6% to the highest value of 22.1% due to the considerable dissolution of secondary phases. However, there is no further improvement in elongation when solution time prolongs from 40 to 50 h at 560 °C. After ST at 560 °C for 40 h, the UTS and elongation of Al–3Li–1.5Cu–0.2Zr alloy reach 262 MPa and 22.1%, respectively.
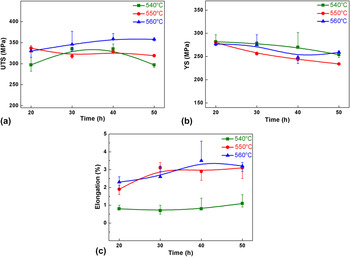
Figure 9 shows the tensile properties [UTS in Fig. 9(a), YS in Fig. 9(b) and elongation in Fig. 9(c)] of the alloy after ST at various temperatures followed by aging at 175 °C for 8 h. It is observed that the UTS increases first and then decreases with the prolongation of solution time at 540 and 560 °C [Fig. 9(a)]. Lombardi et al. Reference Lombardi, Ravindran and MacKay18 observed similar trend during the optimization of the solution heat treatment process of 319 Al alloy, which was related to the dissolution of Al2Cu. For this alloy, the increase of UTS could be attributed to the dissolution of secondary phase, and higher amount of age hardening precipitates formed during aging. For higher solution times, the effect of precipitation strengthening is not enough to offset the decrease of residual phase strengthening, leading to the decrease in UTS. The UTS of the aged alloy increases from 297 MPa to the highest value of 359 MPa, as the ST changes from 540 °C for 20 h to 560 °C for 40 h. Furthermore, ST at 560 °C for more than 40 h can no longer improve the UTS. This may be attributed to the small variation of secondary phase volume fraction (Fig. 5).
Tensile properties of Al–3Li–1.5Cu–0.2Zr alloy after ST at different temperatures followed by aging at 175 °C for 8 h: (a) UTS, (b) YS, and (c) elongation.

The results in Fig. 9(b) suggest that the YS of Al–3Li–1.5Cu–0.2Zr alloy is greatly improved after aging, which is mainly caused by Al3Li/Al3Zr precipitates (Fig. 7). The evolution of size and density of those precipitates is observed to have a significant effect on the mechanical properties of Al–3Li–1.5Cu–0.2Zr alloy. In addition, the YS of samples solution treated at 540 °C is also better than those at higher temperatures due to higher amount of residual phases (Fig. 5). However, the YS of sample solution treated at 560 °C is better than that at 550 °C, which is possibly due to the increase in amount of Al3Li/Al3Zr particles in the matrix (Fig. 7).
Figure 9(c) indicates that the elongation increases first and then decreases with the prolongation of solution time, and reaches the peak value of 3.5% after ST at 560 °C for 40 h followed by aging. This could be attributed to the balance of secondary phase dissolution and grain growth with increasing solution time. Similar to the UTS, ST at 560 °C for 50 h does not result in further increase in elongation.
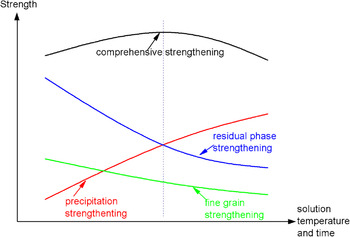
As above discussion, it is found that strengthening mechanisms for aged Al–3Li–1.5Cu–0.2Zr alloy are mainly precipitation strengthening and residual phase strengthening. In addition, the small increase of average grain size would cause a decrease of YS according to Hall–Petch relationship. The increase of solution temperature and time results in the dissolution of secondary phase and the increase of grain size [as shown in Fig. 4(a)], leading to the lower residual phase strengthening and fine grain strengthening. Meanwhile, the dissolution of secondary phases provides more solution atoms and makes precipitates fine and uniform (Fig. 7) after aging, which is beneficial to precipitation strengthening. Reference Min, Zheng and Gong17–Reference Yu, Yin, Zheng and Yu20 As a result, the strengthening of Al–3Li–1.5Cu–0.2Zr alloy is a balance of the precipitation strengthening, residual phase strengthening and fine grain strengthening, which can be described by Fig. 10. The residual phase strengthening and fine grain strengthening decrease with increasing the solution temperature and time, while precipitation strengthening increases. The comprehensive strength of Al–3Li–1.5Cu–0.2Zr alloy reaches the peak at the ST of 560 °C for 40 h, which means that the best combination of precipitation strengthening, residual phase strengthening and fine grain strengthening is achieved at this condition.
Schematic diagram of the strengthening mechanism.

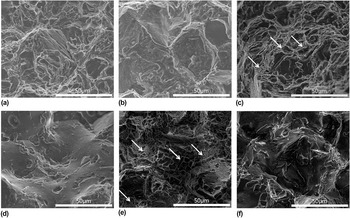
Figure 11 shows the fracture surfaces of the alloy heat-treated at different conditions. When only ST is applied, the fracture surface of the sample solution treated at 540 °C [Fig. 11(a)] consists of cleavage planes and tear ridges. However, a large amount of dimples (marked by arrows) are observed in the surfaces of samples solution treated at higher temperatures, as seen in Figs. 11(c) and 11(e). It can be seen that the dimples become denser and deeper with the increase of solution temperature, which usually lead to the improvement in ductility. As mentioned, the residual phases could offer potential sites for stress concentration and provide possible path for crack propagation. Therefore, the increase of ductile characteristics could be attributed to the dissolution of secondary phases during ST [as shown in Figs. 4(a) and 5]. In addition, the fracture surfaces of samples after aging (T6) become more uneven with the increasing of solution temperature and more ductile characteristics are observed, which is in accordance with the improvement of ductility.
Fracture surfaces of Al–3Li–1.5Cu–0.2Zr alloy heat-treated at (a) 540 °C for 40 h, (b) 540 °C for 40 h followed by 175 °C for 8 h, (c) 550 °C for 40 h, (d) 550 °C for 40 h followed by 175 °C for 8 h, (e) 560 °C for 40 h, and (f) 560 °C for 40 h followed by 175 °C for 8 h.

Theoretically, based on the DSC result shown in Fig. 3, the temperature for solution should be lower than 552.5 °C. However, the micrographs [Fig. 4(a)] of this alloy treated at 560 °C show no signs of overheat, such as molten particles at the grain boundaries and triple conjunctions. Reference Li, Su, Yin and Huang27 Furthermore, the mechanical properties of specimens treated at 560 °C are better than those of specimens solution treated at lower temperatures. Meanwhile, ST at 570 °C has been found to result in the overburnt of Al–3Li–1.5Cu–0.2Zr, which usually causes dramatic decrease of mechanical properties. All the above evidences indicate that the optimum ST of Al–3Li–1.5Cu–0.2Zr alloy should be 560 °C for 40 h.
IV. CONCLUSIONS
-
(1) For cast Al–3Li–1.5Cu–0.2Zr alloy, ST at 560 °C is more effective in the dissolution of secondary phases compared to lower temperatures. The overburnt temperature is around 570 °C.
-
(2) After ST, the elongation of Al–3Li–1.5Cu–0.2Zr alloy increases with the increase of solution temperature, and reaches the highest value of 22.1% at 560 °C for 40 h.
-
(3) After aging at 175 °C for 8 h, the distribution of Al3Li/Al3Zr particles becomes denser and more homogeneous with the increase of solution temperature and time.
-
(4) The tensile properties are up to the highest values, UTS of 359 MPa and elongation of 3.5%, after optimal ST at 560 °C for 40 h followed by aging treatment.
ACKNOWLEDGMENTS
This project is supported in part by National Natural Science Foundation of China (No. 51404153) and Shanghai Yang-fan Program (No. 14YF1402000). The authors would like to thank the TEM labs of school of materials science and engineering at Shanghai Jiao Tong University for their assistance.