





Introduction
Mathematical models of infectious disease transmission grew in frequency of use and in complexity during the COVID-19 pandemic as they proved to be valuable tools for scenario modelling to evaluate potential public health interventions and inform decision-making [Reference Sweileh1]. However, the design choices and implementation of some mathematical models have been criticized for failing to correctly embed epidemiological principles related to the distribution and determinants of disease spread [Reference Abuelezam2–Reference Zelner6] and for failing to discuss the validity of model findings [Reference James7].
In general, the burden of any infectious disease is not distributed evenly across population groups. Globally, historically marginalized ethnic and racial groups experience a greater infectious respiratory disease burden than other population groups. In Aotearoa New Zealand (NZ), Māori and Pacific peoples experience higher rates of hospitalization for severe acute respiratory infection [Reference Satherley and Sporle8–Reference Whitehead10] and African American/Black, Latin American, and Indigenous populations in North America experience higher COVID-19, influenza, and RSV burden [Reference Bambra11–Reference Mackey14].
These unfair and avoidable differential health outcomes, or ‘health inequities’, can be challenging to study because they are the result of many overlapping factors including housing and working conditions, environmental factors, health care access barriers, and social, political, and geographical factors, which interact, compound, and feedback on each other [Reference Braveman and Gottlieb15–Reference Cevik17]. Mathematical transmission models provide a powerful tool to investigate the effect of different factors on infectious disease dynamics and to estimate the impact of different interventions or policies on the infectious disease burden in a population [Reference Keeling and Rohani18]. By building transmission models that include the key drivers of ethnic differences in the burden of disease and stratify model results by ethnicity, it is possible to develop more equitable public health strategies to manage respiratory infectious disease [Reference Zelner6].
Considering ethnicity in acute respiratory illness mathematical models is difficult and must be done carefully and with a nuanced understanding of real-world context. For example, some ethnic groups have experienced historical and ongoing marginalization that has led to increased barriers to accessing health services and other social determinants necessary for good health. These structural factors likely explain many of the differential infectious disease rates and – if not explicitly represented by mechanisms or processes within a model – should at least be considered and discussed as part of mathematical modelling studies [Reference Abuelezam2]. Furthermore, even appropriately quantifying ethnicity within a population can be a challenge for mathematical modelling, and there is often a lack of suitable data to build and calibrate ethnicity-specific mathematical models: case data that are available may not have reliable ethnicity information or may suffer from systemic biases in reporting that correlate with ethnicity; individuals can have multiple ethnicities; information needed to quantify the factors that contribute to the observed inequities in infection rates such as differences in contact patterns may not be available; and even when data related to ethnic differences in respiratory infectious disease are available, the interaction of different factors that might drive differences in infection rates can be difficult to resolve into leading order and secondary effects [Reference John-Baptiste3, Reference Richard and Lipsitch5].
To date, we are not aware of any systematic reviews on representations of ethnicity in mathematical infectious disease transmission models. Therefore, the aim of this systematic review is to identify and compare mathematical transmission modelling studies which report results by ethnicity. We restrict this review to mechanistic mathematical models of respiratory disease transmission that can be used for scenario modelling, such as investigating the impact of different policies or interventions, or unknowns such as novel diseases. We exclude statistical and forecasting models, which are focused on forecasting short-term trajectories, nowcasting, or estimating risk factors.
In the studies identified in this systematic review, we investigate how the models represent ethnicity, what additional factors are incorporated, the data sources used, and the potential sources of bias. We identify key gaps and provide recommendations for better practice to inform equity-focused infectious respiratory disease modelling.
Methods
This study followed the Preferred Reporting Items for Systematic Reviews and Meta-Analyses (PRISMA). The review protocol, including the search method, is published on PROSPERO (number CRD420251063754). No ethical approval was required for this research.
Scopus, ProQuest, EBSCOhost, Wiley, and Cochrane databases were searched on 2 June 2025 (see Supplementary File 1 for the full keyword search for each database). No date filters were applied. Studies modelling HIV and other sexually transmitted and blood-borne pathogens were excluded. Results were imported into EndNote and deduplicated. One author screened titles to identify potentially relevant studies, and then screened abstracts and full texts to determine whether studies were to be excluded or included. A second author used full text to spot-check 10% of the excluded studies and to check all included studies and the data extraction results tables. Coauthors discussed any conflicts regarding included and excluded studies.
We included studies that used a mathematical model to simulate infectious disease dynamics for respiratory pathogens that are primarily transmitted from person to person and that reported model results by ethnic group. We excluded studies that compare populations in different countries or geographic areas without discussion of ethnicity, were not published in English (three studies), or had no full text (seven studies) available.
In this review, we differentiate between three common model frameworks – compartmental, metapopulation, and individual-based models:
-
Compartmental models are the most well-known model type. These models partition the population into groups, or compartments, according to infection status and other variables such as age, location, vaccination status, or ethnicity. Each group within the model can be treated as a homogeneous compartment with its own set of parameters that govern the rates of transition to other compartments and its influence, for example, the spread of disease, on other compartments.
-
Metapopulation models are an extension of compartmental models that allow for multiple populations, each with their own compartmental model, to be linked through contact rates or interaction patterns. A specific type of metapopulation model, commonly used in COVID-19 pandemic modelling, uses populations which are grouped by geographic location (like a state, suburb, or region) that each have their own compartmental model but with additional parameters that govern transmission between each population. The multi-scale structure of metapopulation models enables them to incorporate more detailed population information, for example, spatial heterogeneities, which often includes differences in ethnic proportions.
-
Individual-based models (IBMs) model disease transmission and progression at the level of individuals in the population. This means that IBMs can incorporate population heterogeneities more flexibly by setting individual-level characteristics and interaction patterns. IBMs can also include detailed processes for disease transmission and progression that can depend on the attributes of individuals, their neighbours, and their environment. Limitations of IBMs include that they are computationally demanding to design and run and are difficult to calibrate and validate. They require detailed data to appropriately capture population heterogeneities and the implications for the spread of disease [Reference Keeling and Rohani18–Reference Gallagher20].
Although ethnicity is a self-determined variable to describe cultural affiliation in most governmental data in New Zealand [21], in the USA, both race and ethnicity are used, with ethnicity used only to differentiate between ‘Hispanic or Latino’ and ‘not Hispanic or Latino’ [22]. For consistency, the US definition of race/ethnicity is referred to only as ‘ethnicity’ in this work.
Information was extracted from the eligible papers related to model design, model purpose, level of demographic granularity, parameters that varied by ethnicity, representation of contact/interaction patterns, data sources, and bias, and recorded in Microsoft Excel.
Results
Figure 1 shows the flow diagram for this systematic review. There were 28 papers that met the inclusion criteria. Seventeen were identified from databases and registers in the initial search, and 11 more were identified from snowball sampling of reference lists and ‘cited-by’ tools on Google Scholar.
PRISMA flow diagram for systematic reviews.

Figure 1. Long description
The flowchart is organized into three vertical phases: Identification, Screening, and Included.
1. Identification Phase:
- Top-left box: Records identified from Wiley (n = 511), Cochrane (n = 20), E B S C O (n = 541), P R O Q U E S T (n = 751), and Scopus (n = 1545). Total N = 3368.
- Top-right box (exclusion): Records removed before screening due to duplicate records removed by Endnote (n = 1123) and manually (n = 130). Total: 1253.
2. Screening Phase:
- Second box down (left): Records screened (n = 2115).
- Second box down (right): Records excluded (n = 1818).
- Third box down (left): Reports sought for retrieval (n = 297).
- Third box down (right): Reports not retrieved (n = 11).
- Fourth box down (left): Reports assessed for eligibility (n = 286).
- Fourth box down (right): Reports excluded for specific reasons: No results by ethnic group (n = 172), Compares geographically separated populations (n = 34), Does not model respiratory infectious disease dynamics (n = 33), Restricted to vulnerable population only (n = 17), Review article (n = 9), and Animal model only (n = 1).
3. Included Phase:
- Bottom-left box: Final studies included in review from Databases (n = 17) and Citation search (n = 11). Total = 28.
Table 1 summarizes the key features of the 28 included studies. Twenty-four studies were peer-reviewed journal articles, two were theses (one Master’s, one PhD) [Reference Arigbede23, Reference Barnes24], and two were preprints (not peer-reviewed) [Reference Fleurantin31, Reference Zhang, Orsi and Chen51]. Most studies modelled USA populations (22 studies), with other papers modelling New Zealand (2), Canada (1), Australia (1), United Kingdom (1), and hypothetical (1) populations. Eleven papers used a compartmental model, 12 used an IBM, and 5 used a metapopulation model. We found that all 12 IBMs and 4 out of 5 metapopulations used stochastic transmission processes. In contrast, only 2 out of 11 compartmental models simulated stochastic transmission processes, with the majority being deterministic models.
Data extraction summary for studies included in this systematic review

Table 1. Long description
The table contains seven columns: Author, Geographical setting, Model type, Disease and immunity states, Deterministic vs. stochastic, Pathogen, and Model purpose.
Key entries include:
* Arigbede: USA, I B M, 6 states, Stochastic, Influenza and COVID-19, predicting health service utilization.
* Barnes: USA, C M, 3 states, Deterministic, COVID-19, examining social determinants of health.
* Bilal et al.: Hillsborough, Florida, USA, I B M, 14 states, Stochastic, COVID-19, city-scale simulation.
* Chang et al. and Chen et al.: USA metropolitan areas, M M, 4 states, Stochastic, COVID-19, focusing on mobility and equity.
* Datta et al.: N Z, C M, 14 states, Deterministic, COVID-19, vaccination counterfactuals.
* Elderd et al.: Multiple international locations, C M, 4 states, Deterministic, Smallpox, R 0 differences.
* Engebretsen et al.: Hypothetical, C M, 3 states, Stochastic, Agnostic/COVID-19, community-level risk.
* Fleurantin et al.: USA, C M, 12 states, Deterministic, COVID-19, pandemic response evaluation.
* Kadelka et al.: USA, C M, 20 states, Deterministic, COVID-19, ethnic and occupation-based homophily.
* Klotz et al.: Quebec, Canada, C M, 5 states, Deterministic, Tuberculosis, long-term incidence forecasting.
* Quera-Bofarull et al.: London, U K, I B M, 9 states, Stochastic, COVID-19, city-scale simulation.
* Stafford et al.: Oregon, USA, C M, 18 states, Deterministic, COVID-19, minimizing deaths vs. years of life lost.
* Thakur et al.: Virginia, USA, I B M, 5 states, Stochastic, Measles, vaccination disparities.
* Zhang et al.: N Z, I B M, 3 states, Stochastic, Measles, machine learning calibration.
Abbreviations defined below the table: C M stands for compartmental model, I B M stands for individual-based model, and M M stands for metapopulation model.
CM, compartmental model; IBM, individual-based model; MM, metapopulation model.
The number of disease states varied widely across models depending on the purpose of the study and the disease being studied. The compartmental models used 3–20 states, the metapopulation models used 3–4 states, and the IBMs used 3–14 disease states. Models included more disease states when more detail was needed on disease progression, such as hospitalizations and deaths, or on different vaccination states.
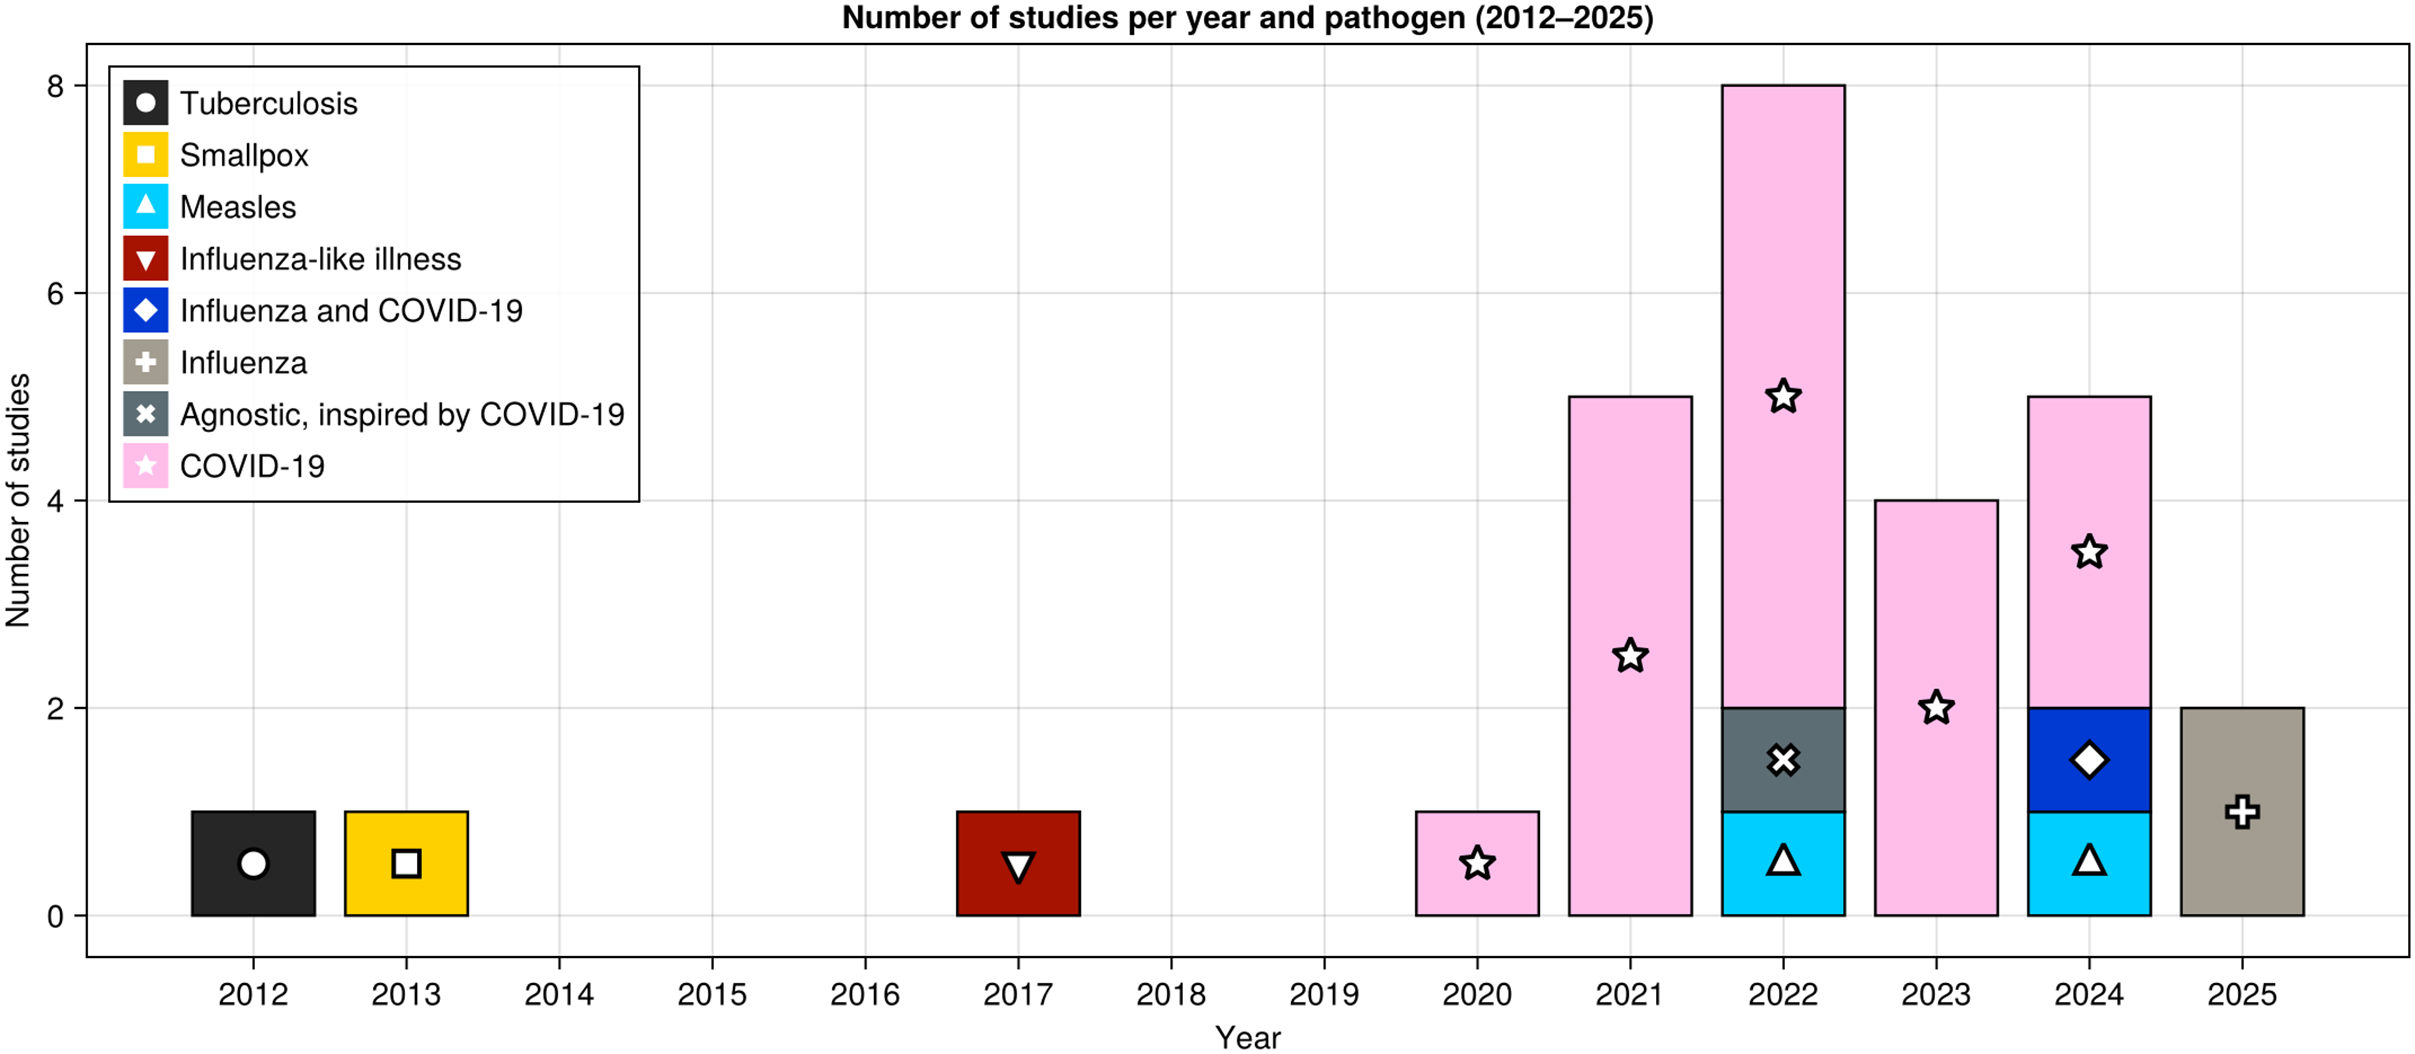
Figure 2 shows the surge in relevant papers published in 2020 or later (25 studies), most of which modelled COVID-19 (19 studies). Other studies modelled influenza (2), influenza and COVID-19 (1), tuberculosis (1), measles (2), influenza-like illness (1), smallpox (1), and an unspecified respiratory infectious disease (1). Only three papers were published prior to 2020 (2012, 2013, and 2017).
Publications included in the systematic review by year published and pathogen modelled. Symbols and colours represent tuberculosis (circle/black), smallpox (square/yellow), measles (arrow pointing upward/light blue), influenza-like illness (arrow pointing downward/dark pink), combined influenza and COVID-19 (diamond/dark blue), influenza (plus/light grey), COVID-19 (star/light pink), and pathogen-agnostic studies inspired by COVID-19 (x/dark grey). The height of each bar corresponds to the total number of studies published in that year.

Figure 2. Long description
The x-axis represents the Year from 2012 to 2025. The y-axis represents the Number of studies from 0 to 8.
Data trends by year:
* 2012: 1 study on Tuberculosis.
* 2013: 1 study on Smallpox.
* 2014 to 2016: 0 studies.
* 2017: 1 study on Measles.
* 2018 to 2019: 0 studies.
* 2020: 1 study on C O V I D-19.
* 2021: 5 studies on C O V I D-19.
* 2022: 8 studies total, consisting of 1 Smallpox, 1 Influenza, and 6 C O V I D-19.
* 2023: 4 studies on C O V I D-19.
* 2024: 5 studies total, consisting of 1 Smallpox, 1 Influenza-like illness, and 3 C O V I D-19.
* 2025: 2 studies on Tuberculosis.
The legend on the right identifies the pathogens: Tuberculosis (black), Smallpox (lightest gray), Measles (light gray), Influenza-like illness (medium-light gray), Influenza and C O V I D-19 (medium gray), Influenza (dark gray), Agnostic inspired by C O V I D-19 (darker gray), and C O V I D-19 (darkest gray). Note that while the caption mentions colors, the provided image is in grayscale.
The most common purpose of the models identified in this review was to evaluate the effect of public health interventions, particularly vaccination, on disease inequities [Reference Chen27, Reference Datta28, Reference Owusu-Dampare and Bouchnita37, Reference Rosenstrom41, Reference Stafford43–Reference Thakur46]. One study focused on the role of household structure in disease transmission, identifying household crowding as a key contributing factor for increased disease rates [Reference Vino48]. Spatial metapopulation models generally sought to explore the relationship between mobility and disease outcomes [Reference Chang26, Reference Gyorgy32, Reference Hou33]. Ethnicity in these models was considered at a ZIP code or census block group (CBG) level, based on the proportion of different ethnicities in each spatial area. Barnes [Reference Barnes24] compared calibrated state-level model parameters to socioeconomic indicators and diversity indices to investigate the relationship between these. Other studies demonstrated how different modelling assumptions lead to different results when modelling interventions. In particular, four studies demonstrated how different choices of the groups considered in the modelling, and different assumptions around assortativity in contact patterns, would affect the outcome of interventions [Reference Elderd, Dwyer and Dukic29, Reference Engebretsen, Rø and de Blasio30, Reference Kadelka34, Reference Ma36, Reference Stafford43].
Model design features, including population demographics, interaction heterogeneity, and parameter settings for the compartmental, metapopulation, and IBMs, are summarized in Tables 2–4.
Model design features for the compartmental models that met the inclusion criteria

Table 2. Long description
The table contains eight columns: Author, Separate (unmixed) populations, Population compartments (demographic characteristics), Population compartment mixing, Parameters that vary by ethnicity, Data sources for model construction, Data sources for calibration, and Ethnic group comparisons in results.
Key entries include:
* Barnes: Focuses on each U S state with homogeneous mixing and state-specific infection rates compared with diversity index.
* Datta et al.: Uses 16 age groups and age-structured contact matrices from POLYMOD to determine preventable M ā ori deaths via equitable vaccination.
* Elderd et al.: Covers Jesuit Missions and European/African outbreaks, varying initial immunity and transmission rates by ethnicity.
* Engebretsen et al.: Uses hypothetical groups to show how rate ratios vary by R 0 and assortativity.
* Fleurantin et al.: Models U S states with 16 age groups and 2 ethnicity groups (D A P and N D A P), varying disease severity and contact rates.
* Kadelka et al.: Includes age, workplace risk, and ethnicity, using Pareto frontier plots to show trade-offs in vaccination strategies between White/Asian and people of color.
* Klotz et al.: Compares Immigrant, non-Indigenous Canadians, and Inuit populations with varying transmission rates.
* Ma et al.: Uses 5 ethnicity groups and C B G s to investigate ethnic assortativity and incidence rate ratios.
* Owusu-Dampare and Bouchnita: Compares Hispanic and non-Hispanic populations across 6 age groups, varying hospitalization and mortality rates.
* Stafford et al.: Compares White and B I P O C populations, equalizing disease outcome rates to determine required vaccination percentages.
* Vino et al.: Compares Indigenous Remote, Indigenous Urban, and non-Indigenous Urban communities using bespoke household contact surveys.
DAP, disproportionately affected population; NDAP, non-disproportionately affected population.
Model design features for the metapopulation models that met the inclusion criteria

Table 3. Long description
The table consists of 10 columns and 5 data rows.
Columns from left to right:
1. Author
2. Subpopulation spatial scale
3. Separate (unmixed) populations
4. Differences between subpopulations
5. Mixing within and between subpopulations
6. Ethnicity groups considered
7. Other drivers considered
8. Data sources for model construction
9. Data sources for calibration
10. Ethnic group comparisons in results
Data Rows:
- Chang et al.: Scale is C B G. Populations include 10 largest U S A metro areas. Transmission varies by C B G. Mixing via mobility at P O Is. Ethnicity is proportion non-White. Other driver is median income. Sources include Census and SafeGraph. Calibrated with metro case data. Results compare infection risk for non-White C B Gs.
- Chen et al.: Scale is C B G. Populations include 9 U S A metro areas. I F R and vaccination rates vary. Mixing via mobility and home transmission. Ethnicity is proportion non-Hispanic White. Other drivers include income, essential workers, and older adults. Sources include Census and SafeGraph. Calibrated with metro death data. Results show correlations between ethnicity, mobility, and deaths.
- Gyorgy et al.: Scale is Z I P codes. Population is Chicago, I L. Fit per-trip risk per Z I P. Mixing via daily trips. Ethnicity categorized as majority White, Black, Latinx, or mixed. Other drivers include household size, income, employment, and housing quality. Sources include Census and SafeGraph. Calibrated with case and testing data. Results examine infection rates and homophily.
- Hou et al.: Scale is custom regions from C B G mobility clusters. Populations are Dane and Milwaukee counties, W I. Fit time-varying transmission. Mixing via daily traffic flow. Ethnicity is proportion of 7 groups. Other drivers are age and business type. Sources include Census and SafeGraph. Calibrated with case data. Results compare trends in predominantly White, Black, and Hispanic areas.
- Wang et al.: Scale is Z I P codes. Population is Greater Boston, M A. Mixing via mobility between Z I P codes. Ethnicity categorized as greater than 80 percent White, greater than 20 percent Latinx or Black, or mixed. Sources include Census, SafeGraph, and vaccine data. Results show infection rates by ethnicity group.
CBG, census block group; IFR, infection-fatality rate; POIs, points of interest.
Model design features for the individual-based models that met the inclusion criteria

Table 4. Long description
The table contains 10 columns: Author, Separate (unmixed) populations, Individual attributes, Consideration of relationships between attributes, Mixing between individuals, Differences by ethnicity, Other drivers considered, Data sources for model construction, Data sources for calibration/validation, and Ethnic group comparisons in results.
Key entries include:
* Arigbede: Models 4 regions with 8 ethnicity groups. Uses homogeneous mixing within regions and ethnicity-specific infection rates. Calibrated against E D visit data.
* Bilal et al.: Uses 16 age groups and 7 race groups. Features a synthetic interaction network (home, work, school, community). Calibrated against ZIP code case data.
* Patel et al.: Focuses on 3 ethnicity groups and diabetes status. Includes ethnicity-specific hospitalization and mortality rates. Validated against ethnicity-specific data.
* Quera-Bofarull et al.: Uses the J U N E synthetic interaction network for 5 ethnicity groups. Calibrated using deep neural networks (Calib N N).
* Rosenstrom et al.: Uses the C O V S I M network. Considers essential worker status and diabetes. Validated against age and ethnicity-specific case and death data.
* Sivakumaar et al.: Models 3 U S states using a Hybrid C O V A S I M network. Considers differences in disease progression and vaccination rates.
* Stafford et al.: Uses SynthPops C O V A S I M. Includes school ethnicity assortativity and workplace risk levels. Calibrated to ethnicity-specific I C U and mortality rates.
* Starr and Kain: Models 4 U S counties with 4 ethnicity groups. Focuses on differences in vaccination rates. Validated against Westchester County case data.
* Thakur et al.: Models N Y C measles outbreak. Includes extra detail on school contacts and household income. Uses Wilcoxon signed-rank tests for comparisons.
* Thomas et al.: Models San Francisco using spatial interaction functions based on distance. Validated against ethnicity-specific case data.
* Williams et al.: Uses the F R E D network for 8 U S counties. Compares Black to White case rate ratios for equal vaccination simulations.
* Zhang et al.: Uses J U N E-N Z for 3 New Zealand health districts. Includes S E S indicators and immunization history. Calibrated against 2019 measles outbreak data.
CDC, Centers for Disease Control and Prevention; ED, emergency department; NSSP, National Syndromic Surveillance Program.
Representations of population demographic heterogeneity
To represent real-world population demographics, most IBMs and compartmental models explicitly stratified the population by ethnicity and other demographic characteristics. Metapopulation models were the exception; these models all assumed homogeneous mixing within spatial areas, for example, ZIP codes, and relied on spatial heterogeneities to represent differences in disease transmission. Where ethnicity was considered, it was when analysing the results, and the ethnicity proportions or majority ethnicity in each spatial area was used. Investigating the representation of ethnicity in these models, we found that in general IBMs represented ethnicity at a finer granularity than compartmental or metapopulation models. IBMs typically categorized their populations into four or more ethnicity groups, whereas most compartmental models used two ethnicity groups only. The exception being the compartmental model by Ma et al. [Reference Ma36], which considered five ethnicity groups; however, the trade-off was that they included no other demographic factors. No models included consideration of people with multiple ethnicities.
Models that include variables such as age, SES, household structure, or workplace type in addition to ethnicity are incredibly valuable because these are some of the key drivers of the observed disparities in disease burden [Reference Abuelezam2, Reference Zelner6]. Of the other demographic factors included, age was the most common, with most IBM and compartmental models (18 out of 23) separating the population by age groups. Household structure was also important, with ten IBMs explicitly representing different household sizes and four compartmental models adjusting their contact matrices to reflect different household size distributions for subpopulations. For COVID-19 in particular, workplace risk was often considered, with four models directly including a workplace risk attribute or compartment, and five other models adjusting their contact structure based on workplace risk. Other less common population attributes included sex/gender, socio-economic status (SES), social vulnerability, and health risk. These extra factors were often only included in IBMs, as they would lead to a prohibitive number of compartments in a compartmental or metapopulation model.
In our review, we also assessed whether the covariance or intersectionality of different attributes was well represented. We found that in many cases this was difficult to ascertain, with only a few papers explicitly describing which covariates they captured. Furthermore, in several models, individual attributes were allocated independently or only using spatial-level heterogeneities. For example, many IBMs reproduced the household size distribution at the spatial area unit but did not consider differences in household size by other factors such as income, age, or ethnicity. If the relationships between factors are not well represented, then estimations of the impact of interventions related to these factors on different ethnic groups may not be reliable.
Representations of interaction heterogeneity
Different model types vary widely in how much interaction heterogeneity can be represented. Network-based IBMs are able to represent individual contact patterns, whereas compartmental models use contact matrices to capture mixing within and between groups, and spatial metapopulation models capture mixing within and between spatial areas.
All five metapopulation models used mobility data from SafeGraph to estimate mixing rates at the level of CBGs [Reference Chang26, Reference Chen27], ZIP codes [Reference Gyorgy32, Reference Wang49] and custom aggregations of CBGs derived from cluster analysis of mobility patterns [Reference Hou33]. In these models, any relationships between ethnicity or other demographic factors and contact rates are only captured indirectly through the demographic composition of the different spatial areas, and the high levels of spatial assortativity in contact patterns.
IBMs are able to capture the most detail in contact patterns for disease transmission, and this is reflected in the models we reviewed. Nine of the 12 IBMs constructed detailed interaction networks to explicitly link individuals through shared households, schools, workplaces, and community interactions [Reference Bilal25, Reference Patel38, Reference Quera-Bofarull, Chopra and Aylett-Bullock40–Reference Sivakumaar, Enayati and Shittu42, Reference Stafford44, Reference Thakur46, Reference Thomas47, Reference Zhang, Orsi and Chen51]. These models used official statistics data (e.g. census) to construct representative homes, workplaces, and schools. Then, to link individuals to workplaces and schools, six IBMs used commuting data from official statistics, one used the TomTom OD analysis engine [Reference Bilal25], and the remainder used location- or distance-based heuristics. One IBM constructed an interaction network using a spatial interaction function for most contacts, but with differences in the household size distribution at census tract level [Reference Thomas47]. In contrast, two IBMs assumed homogeneous population mixing, with Starr and Kain [Reference Starr and Kain45] using a random walk to determine agent interactions, and Arigbede [Reference Arigbede23] assumed the population within each geographic area was well-mixed.
Five compartmental models incorporated ethnicity-specific differences in age-structured mixing patterns. Three studies extended the European POLYMOD age-structured contact matrices [Reference Prem52] to include race/ethnicity and high/low workplace risk [Reference Kadelka34] compartments, including considerations such as differences in household size, inter-generational households, and proportion of essential and frontline workers. These three studies then used varying assumptions on ethnicity assortativity to generate the necessary within- and between-ethnicity contact matrix elements. Two studies constructed different age-structured contact patterns for different ethnicities, taking into account differences in household structure [Reference Vino48], or workplace contact rates [Reference Owusu-Dampare and Bouchnita37] by ethnicity, and ran the populations independently.
Ma et al. [Reference Ma36] did not stratify the population by age, only ethnicity, and constructed an ethnicity-structured contact matrix using ethnic assortativity assumptions, and Engebretsen et al. [Reference Engebretsen, Rø and de Blasio30] explored varying degrees of ethnic assortativity on the resulting disease outcomes across hypothetical ethnic groups. In contrast, Datta et al. [Reference Datta28] used only an age-structured contact matrix, and three compartmental models [Reference Arigbede23, Reference Barnes24, Reference Klotz, Harouna and Smith35] assumed homogeneous mixing with no separate demographic groups.
Disease parameter settings
Several studies incorporated ethnicity-specific disease transmission and progression parameters by ethnicity. Focusing initially on models that varied transmission parameters, we found that two compartmental models varied disease susceptibility or infectivity by ethnicity to best reproduce empirical trends [Reference Klotz, Harouna and Smith35, Reference Ma36]. Similarly, four IBMs varied either the infectivity or susceptibility of individuals based on their ethnicity [Reference Arigbede23, Reference Patel38, Reference Sivakumaar, Enayati and Shittu42, Reference Zhang, Orsi and Chen51].
In addition to disease transmission parameters that varied by ethnicity, we also consider models that vary transmission parameters spatially, as these differences lead indirectly to differences by ethnicity due to spatial segregation. For example, Elderd et al. [Reference Elderd, Dwyer and Dukic29] found that setting a different basic reproduction number R0 for different populations best reproduced empirical smallpox patterns. In more recent COVID-19 models, most metapopulation models, and at least two of the IBMs, varied transmission rates by spatial areas to fit case data. Two IBMs [Reference Patel38, Reference Rosenstrom41] and all metapopulation models used data from SafeGraph (an aggregated and anonymized mobile phone mobility dataset) and/or Google mobility trends to estimate time-varying mobility rates for different spatial areas in response to lockdown measures.
Other disease progression parameters, including rates of hospitalization and mortality, were varied by ethnicity in four compartmental models [Reference Elderd, Dwyer and Dukic29, Reference Fleurantin31, Reference Owusu-Dampare and Bouchnita37, Reference Stafford43], and in five IBMs [Reference Arigbede23, Reference Patel38, Reference Sivakumaar, Enayati and Shittu42, Reference Stafford44, Reference Zhang, Orsi and Chen51].
A key driver of differences in respiratory disease inequities is differences in vaccination rates. Depending on the disease and the vaccine, vaccination or prior immunity can affect both disease transmission and disease progression. Four compartmental models [Reference Elderd, Dwyer and Dukic29, Reference Kadelka34, Reference Owusu-Dampare and Bouchnita37, Reference Stafford43], one metapopulation model [Reference Chen27], and six IBMs [Reference Sivakumaar, Enayati and Shittu42, Reference Stafford44–Reference Thakur46, Reference Williams50, Reference Zhang, Orsi and Chen51] included differences in vaccination rates or prior immunity by ethnicity, either from pre-existing data or using estimated vaccination rates under different scenarios as a key element of the study. Datta et al. [Reference Datta28] used a single age-structured population, so could not set different vaccination rates for different ethnic groups. Instead, they considered different counterfactual scenarios with vaccination rates for the whole population set to the levels seen for the Māori population or the non-Māori population.
Model calibration and validation
Most IBMs reported calibration or validation using empirical data, but it was often not clear which parameters were adjusted and whether these were ethnicity specific. Notable exceptions include five studies that calibrated to [Reference Rosenstrom41, Reference Stafford44, Reference Thomas47, Reference Zhang, Orsi and Chen51] or validated against [Reference Patel38] empirical ethnicity-specific case, hospitalization, ICU, and mortality data.
Advanced methods, such as machine learning and ensemble data assimilation, were used to calibrate parameters to overall case or fatality data in several IBMs and one metapopulation model [Reference Arigbede23, Reference Hou33, Reference Quera-Bofarull, Chopra and Aylett-Bullock40, Reference Zhang, Orsi and Chen51]. Other metapopulation models calibrated parameters for each homogeneous spatial unit to empirical case or fatality data [Reference Chang26, Reference Chen27, Reference Gyorgy32, Reference Wang49].
Several studies considered empirical data biases and limitations in their model design. Fleurantin et al. [Reference Fleurantin31] and Stafford et al. [Reference Stafford43] calibrated only to ethnicity-specific COVID-19 mortality data due to the known under-representation of some ethnic groups in case data. Fleurantin et al. [Reference Fleurantin31] also restricted their model to the ten spatial regions (US states) where ethnicity information was at least 93% complete. Ma et al. [Reference Ma36] used seroprevalence survey data which had higher quality ethnicity information, and less under-reporting bias, than case and hospitalization data. Datta et al. [Reference Datta28] performed sensitivity analyses to account for the potential under-representation of the Māori ethnic group in the administrative dataset.
Discussion of inequities
Framing and interpretation of differences in outcomes by ethnicity varied across studies included in this review. Most studies state differences as inequitable, link them to unfair and unequal access to the social determinants of health, relate findings back to potential impacts on real-world inequities, and discuss data and model design limitations that could bias the results.
In contrast, other studies described differences by ethnicity descriptively, without framing the observed differences as unfair or avoidable. These studies generally also had limited discussions of the underlying structural drivers of inequities. Notably, several large and widely used simulation frameworks, including JUNE [Reference Quera-Bofarull, Chopra and Aylett-Bullock40, Reference Zhang, Orsi and Chen51], CitySEIRCast [Reference Bilal25], COVASIM [Reference Patel38, Reference Rosenstrom41], and FRED [Reference Williams50], incorporated detailed demographic structure but presented ethnic differences in publications as descriptive only.
Bias assessment
Potential sources of bias for the included studies are summarized in Table 5. While there are no formal frameworks for evaluating bias in mathematical models, we selected five key themes as documented in Grading of Recommendations Assessment, Development and Evaluation (GRADE) [Reference Egger53]. Of the 28 included studies, 20 discussed biases from empirical data used in models, and 25 discussed limitations of the model framework used. Only 14 studies published all code and datasets required to reproduce the model and analyses, but an additional 4 studies noted data were available upon request. Most studies stated funding source (23/28) and conflicts of interest (20/28). Transparency on model and data bias and limitations ensures the findings are credible and appropriate for use in informing public health strategies.
Bias assessment for studies included in the systematic review

Table 5. Long description
The table consists of six columns: Author, Authors note biases from empirical data, Authors note model limitations, Data and code availability, Funding identified, and Declare conflicts of interest.
Key data points include:
* Arigbede: Yes for biases and limitations; No code/data; No funding; No conflict (thesis).
* Barnes: No for biases and limitations; No code/data; No funding; No conflict (thesis).
* Bilal et al.: Yes for biases and limitations; Data on request, no code; Yes funding; Not stated conflict.
* Chang et al., Datta et al., Fleurantin et al., Gyorgy et al., Kadelka et al., Ma et al., Stafford et al. (44), and Vino et al.: All report Yes for biases and limitations, and provide open access to code and data.
* Chen et al., Hou et al., Quera-Bofarull et al., Starr and Kain, Wang et al., and Zhang et al.: These authors did not note biases from empirical data but did note model limitations.
* Thomas et al.: No for biases and limitations; Open access code and data; Yes funding; None to declare.
* Williams et al.: Yes for biases; No for limitations; No code/data; Yes funding; Declared conflict.
* Studies by Arigbede, Barnes, Sivakumaar et al., Starr and Kain, and Zhang et al. did not identify funding.
Nearly all (27/28) studies used census or administrative data for building their populations. These datasets introduce ingrained data biases into models, as ethnicity may be misclassified, missing, or overly aggregated, with differential effects across groups [Reference Chin54]. For example, 53% of migrant workers in the USA are undocumented and not captured in census data [Reference Rosenstrom41], while in NZ, ethnicity misclassification is greater for Māori, Pacific, and Middle-Eastern/Latin American/African populations despite recent improvements [Reference Dixon, Batts and Diener55]. Additionally, metapopulation models in this review all relied on anonymized mobility data, which lack demographic information, may misrepresent some populations, and are unavailable or inappropriate in certain settings [Reference Dickinson56]. Very few studies explicitly acknowledged these data limitations, highlighting the need for methods that account for data bias during model design and calibration [Reference John-Baptiste3].
The majority of the studies were US-based COVID-19 models (see Table 1). Despite low ethnicity reporting for COVID-19 case and mortality data, US-based studies typically used this data to calibrate models [Reference Aliseda-Alonso57]. To mitigate data limitations, one study restricted analyses to states with adequate data [Reference Fleurantin31], two relied on mortality data that had better coverage [Reference Fleurantin31, Reference Stafford43], and one instead used seroprevalence estimates [Reference Ma36]. While seroprevalence studies provide better estimates of cumulative infections, they typically lack ethnic and demographic detail, which can be limiting for models focused on investigating inequities, unless otherwise accounted for [Reference Patel39, Reference Bergeri58, Reference Havers59].
Discussion
We identified 28 mathematical epidemiology studies that model infectious respiratory disease transmission and report their results by ethnicity. We found that the COVID-19 pandemic was a key catalyst for improving mathematical modelling of ethnic inequities; only 3 papers out of the 28 were published prior to 2020. These 28 publications represent a very small proportion of the totality of mathematical respiratory disease modelling literature, suggesting that mathematical modelling of ethnicity-related differences in infectious respiratory disease is an under-studied area.
An important point to note was that there were many studies which did not meet the inclusion criteria, despite consideration of some of the key drivers of different infection risks by ethnicity, for example, age structure, household size, income, as they did not take the final step of analysing what the results would be for different ethnic groups. Although this would require consideration of how to add ethnicity as an attribute in an IBM, how to stratify a compartmental model by ethnicity, or how to scale the results based on ethnicity distributions, it would be a valuable step in advancing the field.
When comparing mathematical modelling approaches, we found that IBMs offer greater flexibility than compartmental models for incorporating individual-level heterogeneity. In contrast, compartmental models generally used highly aggregated demographic groups, which minimized complexity and data requirements. However, even for IBMs, which could technically have very large numbers of different ethnicity categories, we found that there is often a trade-off between aggregating dissimilar groups and having sufficient data to populate the model. Relying on highly aggregated categories such as Black/White [Reference Williams50] obscures inequities affecting other groups. Similarly, major ethnicity categories typically include culturally diverse and distinct ethnic groups within them. The appropriate levels of aggregation and ethnicity categorizations to use for a model will depend on the research question and whether data are sufficient for reproducing the differential drivers of inequities for different groups. The approach of Fleurantin et al. [Reference Fleurantin31], which defined the ethnicity grouping for the ‘Disproportionately Affected Population’ state by state, provides one example of how to let the context inform the appropriate categorization.
An important gap identified in this review was that many of the studies did not ensure that they captured the relationships between the individual attributes they included. For example, differences in household sizes for different ages and ethnic groups. In general, representing the intersectionality of multiple attributes in a heterogeneous population is non-trivial, but recent research on the development of synthetic populations shows how to represent real-world demographic structures while mitigating privacy risks and data gaps [Reference Jordon60, Reference Wang61]. Open access and well-evaluated methods for developing synthetic populations specific to the research question are required, and their use must be guided by Indigenous data sovereignty principles, including understanding data limitations and how these affect Indigenous groups.
The importance of contact structures for disease transmission is well established [Reference Keeling and Rohani18], and a number of the studies identified in this review explicitly demonstrated that including (or not including) contact pattern assortativity, including by ethnicity, type of work, and location, qualitatively changed the relative impacts of policies assessed in the modelling [Reference Engebretsen, Rø and de Blasio30, Reference Kadelka34, Reference Ma36, Reference Stafford43]. Most compartmental models rely on contact matrices derived from surveys such as the European POLYMOD survey [Reference Prem52], as contact survey data are not available for many countries. However, existing international surveys are unlikely to appropriately represent some ethnic groups, especially minority ethnicities [Reference Sullivan, Senanayake and Plank62], and may not be applicable to different cultural contexts, such as the USA. Additionally, most of the contact matrices derived from survey data typically only capture the average contacts by age, and either do not include mixing between ethnic groups or rely on simple heuristics. For IBMs, constructing representative social contact networks is challenging and intensive. Several studies reduced resource requirements by adapting existing platforms such as JUNE [Reference Quera-Bofarull, Chopra and Aylett-Bullock40, Reference Zhang, Orsi and Chen51], CitySEIRCast [Reference Bilal25], COVASIM [Reference Patel38, Reference Rosenstrom41], and FRED [Reference Williams50]. However, the commonly used data sources for these networks (census, administrative, survey, and mobility data) each come with distinct gaps and biases [Reference Keeling and Eames63], and often simple heuristics are used for spatial and community assortativity.
When seeking to capture ethnic inequities of respiratory disease spread, it is worth considering which dimensions are most important to represent in population structures, and hence in contact matrix data, for mathematical epidemiology [Reference Tjikundi64–Reference Dall’Amico66]. Country-specific surveys that stratify by these important dimensions would enhance disease models [Reference Richard and Lipsitch5]. The recent Reconnect [Reference Goodfellow67] cross-sectional contact survey and the work in Vino et al. [Reference Vino48] provide examples of how surveys can be used to inform ethnic-specific interaction patterns.
In addition to the contact structure, many models rely on simplifying assumptions to capture other effects on disease transmission [19]. A number of the models in this review varied transmission rates by ethnicity (or spatial area) to calibrate to empirical case data. In this way, modellers were using ethnicity as a proxy for the actual underlying drivers of the higher infection rates. Although ethnicity may be predictive of health outcomes, it is not typically a direct driver; fitting ethnicity-specific parameters to the observed case data risks essentializing ethnicity as the ‘cause’ of the differential outcomes and can obscure the underlying mechanisms that drive inequities. Additionally, it means that the evaluation of any interventions or policies that act on unrepresented underlying drivers can be unreliable [Reference Abuelezam2, Reference Zelner6]. Finally, the same structural factors that influence infection risk may also influence case reporting; hence, calibrating to case data can lead to a biased model.
Where possible, modellers should avoid using ethnicity as a proxy for the drivers of differences in respiratory disease infections in models. By setting non-ethnicity-specific parameters for variables that drive ethnic inequities, modellers can avoid essentializing ethnicity as a causative factor and can better represent the real-world mechanisms of disease transmission and impacts of interventions. This, alongside careful interpretations of results, data sources, and model limitations within the context of health inequities, will reduce the risk of deficit framing [Reference Greaves68] and further marginalizing vulnerable ethnic groups [Reference Abuelezam2, Reference Ross69, Reference Holland70].
Choosing what drivers to include in a specific model requires a nuanced understanding of what drives disease in the population of interest and will depend on the research questions that the model is trying to answer. For example, when modelling the effect of school closures on COVID-19 rates by age and ethnicity during lockdown, it may be necessary to include a multigenerational household variable for the model population, where older adults become protected through this intervention. Findings from epidemiological data [Reference Richard and Lipsitch5] and existing modelling studies can help identify important factors or knowledge gaps to address. There is no single ‘best’ model, and there is high value in methodological pluralism [Reference Streicher, Broadbent and Hellewell71].
While it can be tempting to model as much as possible so that factors are not accidentally missed, this risks overcomplicating models and makes calibration and validation more challenging. When selecting attributes and variables to include, modellers should strive to include only the essential factors for the dynamics being studied. In addition, modellers should consider their choices and language used to ensure that the modelling uplifts communities and avoids deficit framing [Reference Greaves68].
One final recommendation for mathematical epidemiological modelling studies is to strengthen the language regarding health inequities, which acknowledges the inequitable nature of differences and encompasses the ethical imperative to address unfairly distributed resources necessary for good health. This shifts the focus required for improving differences from the vulnerable population and onto the systemic drivers that have led to these differences [Reference Reid, Robson, Robson and Harris72, Reference Lee73]. Although health inequities were the central theme across most of the 28 studies included in this review, some studies continue to describe avoidable differences in outcomes by ethnic groups as inequalities and disparities. While many health outcomes are significantly more prevalent for a particular group, such as dementia in older people, or ovarian cancer in females, these differences, or ‘disparities’, are not necessarily avoidable but are due to biological factors, whereas many infectious diseases and other chronic and acute conditions that affect lower socio-economic and some ethnic groups at higher rates are unfair and avoidable. An appropriate use of ‘inequities’ creates more transparent research by unmasking social determinant pathways that drive these differences, making it easier to identify opportunities for interventions targeting the root cause of the inequities.
Ethnic inequities arise from the social and political contexts that drive unfair distributions of social determinants of health, including income, employment type, and housing quality. The mechanisms in which these factors compound, intertwine, and feedback are complex and unpredictable, and the limited ability to disentangle these effects has implications for designing mathematical models. Model design features become easier to trade-off between, once modellers fully commit to addressing health inequities.
Limitations of this review
While this review included published and unpublished papers, other relevant modelling literature (e.g. government and research reports) may have been missed. Additionally, some models may have been capable of reporting ethnicity-specific results but did not, introducing potential bias if papers only reported ethnicity-specific results when differences were observed. Studies focusing on a single ethnic group were excluded but may have used relevant modelling methods for representing ethnic groups who experience inequities. Further, only 10% of title-screen exclusions were checked, increasing the risk of exclusion bias. Given the breadth of the field of mathematical epidemiology, we restricted the review to mechanistic models of respiratory pathogen transmission. Many other types of statistical and mathematical models exist and are valuable for strengthening our understanding of respiratory infectious disease and its impact on ethnic and marginalized groups, and for informing model design and parameter choices for mechanistic transmission models, but they are not the focus of this review. Methodological pluralism is encouraged as it strengthens our understanding and improves confidence in capturing ethnic inequities [Reference Streicher, Broadbent and Hellewell71].
Most studies were US based, which may mean that the ethnicity-specific findings from the model results may not be generalizable outside of US settings. For example, while the USA and NZ both have significant health inequities for ethnic groups, each has different ethnic compositions, ways of defining race and ethnicity, and drivers for increased disease risk (such as greater health care access barriers in the USA) [Reference Chin74]. Nonetheless, we believe the findings related to methods and model design from this review are generalizable outside of the USA.
Conclusions
This review shows that, although we did not find a large number of examples, ethnic inequities in respiratory infectious disease burden can be meaningfully represented in mathematical models. To do this well requires that factors such as population heterogeneity, differences in interaction structure, interaction assortativity, data limitations, and contextual interpretation are carefully considered and transparently incorporated into model design. A fundamental application of infectious disease models is evaluating public health interventions. While it can be difficult to appropriately model factors that can lead to different infection outcomes by ethnicity in models, doing so is essential for evaluating the differential impacts of potential policies. Without appropriate representation of different ethnic groups, and the mechanistic factors known to influence differential exposure, disease transmission, and disease burden, models are unlikely to accurately assess the relative impact of interventions across population groups (as shown in Refs. [Reference Engebretsen, Rø and de Blasio30, Reference Kadelka34, Reference Ma36, Reference Stafford43]). There is a clear need for better data on the heterogeneity and assortativity of contact patterns within and between different communities. Studies that incorporate population and contact heterogeneities and context-specific interpretations are better positioned to explore how policy choices may affect different population groups [Reference Zelner6].
Considering ethnic inequities in mathematical models is complex but essential if researchers and policymakers want to continue to use these models to gain insights that support strategic public health planning. Ignoring equity risks, misrepresenting transmission mechanisms, and developing models that are not accurate reflections of the unique realities of all groups can potentially widen inequities when applied in real-world settings. As mathematical models are increasingly used to inform public health action, careful attention to incorporating and interpreting ethnic inequities, including transparency on data limitations and appropriate application of models, is essential to ensure that models can be used alongside other epidemiological studies to provide evidence for public health strategies that will reduce inequities and improve health for the most vulnerable populations.
Supplementary material
The supplementary material for this article can be found at http://doi.org/10.1017/S0950268826102118.
Data availability statement
Data extracted from the studies included in this review are provided in Tables 1 and 2. No other data were used for this systematic review.
Author contribution
Z.K. designed the study protocol, which was reviewed by E.H., D.O., and J.W. Z.K. conducted the literature search, screened titles, abstracts, and full text, and extracted data from the final literature, and this was spot-checked by E.H. and reviewed by E.H. and D.O. Z.K. drafted the final paper, which was reviewed by E.H., D.O., and J.W.
Funding statement
Te Pūnaha Matatini, New Zealand and University of Waikato, New Zealand. No other funders to declare.
Competing interests
Z.K., E.H., J.W., and D.O. were funded by Te Pūnaha Matatini, a New Zealand Centre of Research Excellence, for this project, and Z.K. was also funded in part by a University of Waikato Doctoral Scholarship. No other competing interests to declare.
Use of AI tools
During the drafting process, Z.K. used Microsoft 365 Copilot to assist with editing and clarity checking. No AI tool was used to generate ideas, interpretations, or findings. The authors take full responsibility for the final manuscript.




 Open access

