

Introduction
Between 2017 and 2021, Cotswold Archaeology (CA) and Oxford Archaeology (OA) carried out a programme of archaeological investigation of land associated with the M2 Junction 5 (referred to as M2J5) improvement scheme, in Kent (centred at NGR: 585048 161779; Fig. 1). Prior to the main excavation, two geophysical surveysFootnote 1 and three phases of trial-trench investigationFootnote 2 were undertaken to evaluate the archaeological potential of the scheme, to inform the planning process and the subsequent archaeological excavation strategy.Footnote 3 Evidence for early prehistoric to modern settlement and land-use was identified during the trial-trench evaluation but of particular significance was the discovery of an area of Late Iron Age/Early Roman (first century b.c. to first century a.d.) bloomery iron smelting (furnaces and bloomery deposits), on the north side of the scheme (Area A; Fig. 2), and associated activity to the south (Area B; Fig. 3). Given the concentration of furnace-related features in Area A, a geophysical survey was conducted to try and ascertain the full extent of the bloomery activity, revealing that it extended beyond the scheme footprint to the north-west (Fig. 2).Footnote 4 Consequently, the scheme boundary was reduced to preserve the iron-smelting sites in Areas A and B in situ. During the subsequent, main excavation, however, two additional furnace structures were discovered in Area A (Fig. 2), which were radiocarbon dated to the mid-fourth to first centuries b.c. (Middle to Late Iron Age), suggesting a prolonged industrial use of this area.
Site location plan (1:15,000).

Fig. 1 Long description
The map illustrates archaeological investigation areas in Kent related to the M2 Junction 5 improvement scheme. It includes a site location plan with Newington, Kent and surrounding areas marked. The map highlights two main areas, Area A and Area B, with scheme boundaries outlined in red. Area A and Area B are designated for excavation, trial-trenches and geophysical surveys. Smelting sites are marked with specific symbols. Insets show detailed views of trial trenches TT34 and TT39 within Area A and Area B. The map provides a scale and directional arrow for reference.
Plan of bloomery smelting features in Area A (1:2000).

Fig. 2 Long description
The map illustrates archaeological features in Area A, highlighting the scheme boundary in red. It includes various elements such as furnaces or iron working hollows marked in orange, bloomery deposits in blue and other archaeology in grey. Geophysical survey results are indicated in light blue, showing possible metal working areas. Specific locations are labelled with numbers, such as TT101, TT94 and TT95, along with references to features like 9416 slash 9418 and 9302 dash 03 dash 913. The map also features arrows pointing to different areas, providing spatial orientation.
Plan of bloomery smelting features in Area B (1:1500).

Fig. 3 Long description
The map illustrates various elements related to an archaeological investigation. It includes the scheme boundary marked with a line, areas of archaeological investigation and locations of furnaces or working hollows. Other archaeological features are indicated, along with results from a geophysical survey. Specific areas are labelled, such as TT36, TT39 and 3915 to 3912. A scale is provided at the bottom, showing 1 to 1500 and 25 metres. A directional arrow is present, indicating north. The map is divided into sections with different labels and features, providing a detailed overview of the investigation site layout.
This report provides a summary of the smelting sites discovered during the M2J5 improvement works. A detailed excavation report, which includes methodological approaches and full specialist finds and biological reports, is available online via Cotswold Archaeology’s website.Footnote 5
Location and geology
The scheme incorporated land to the north and south of Junction 5 of the M2 and followed an approximately 2 km long section of the A249 (Fig. 1) that follows the base of the Stockbury Valley. Accordingly, much of the land within the scheme was low lying (approximately 62–72 m above Ordnance Datum). The M2 forms the northern boundary of the Kent Downs Area of Outstanding Natural Beauty (AONB) and the landscape surrounding the scheme is characteristic of the wider, predominantly rural, undulating chalk downland of the Mid Kent Downs.Footnote 6
The underlying geology within the scheme boundary is predominantly mapped as Seaford Chalk Formation, with Thanet Formation sand, silts and clays recorded at the north-western and north-eastern extents of the scheme. These are overlain by superficial head deposits of clay, silt, sand and gravel and clay-with-flints.Footnote 7
Archaeological context
This area of Kent has seen limited development, with the nearest known evidence for prehistoric and Roman land-use and settlement recorded during archaeological investigations at Borden, 2.5 km to the north-east, and in and around Stockbury, 1–3 km to the south-west (Fig. 1).Footnote 8 Of most significance were Late Iron Age/Early Roman smelting sites discovered at Monk’s Orchard, South Street Road, Stockbury,Footnote 9 2.5 km to the south-west (Fig. 1); and at two locations within the Stockbury pipeline easement, 1 km (F113) and 3 km (F119) to the south-west of the scheme (Fig. 1).Footnote 10 Until the discovery of these furnaces, and further examples at Newington, situated approximately 3 km to the north (Fig. 1), little has been known about later prehistoric and early Roman ironworking in north Kent, east of the Medway.
Evidence of smelting within the Stockbury pipeline (sites F113 and F119) comprised approximately 18 shaft furnaces that had been constructed in large hollows that, along with the presence of post-holes, were interpreted as sunken-floored structures. Two possible smithing hearths and pits associated with the extraction and preparation of ore were also recorded.Footnote 11 The slag assemblage from sites F113 and F119 was dominated by furnace slag (approximately 169 kg) but tap-slag was also present in smaller quantities (approximately 39 kg).Footnote 12 Taken together with the uncommon ‘sunken-shaft’ design of the furnaces, this implies that the technology used at these sites was ‘an intermediary or evolutionary link between Iron Age slag-pit furnaces and Roman tapping furnaces’.Footnote 13 The remains of a single furnace of probable Late Iron Age date was also discovered at Monks Orchard, Stockbury, together with a mixed assemblage of undiagnostic and tap/run slag.Footnote 14
Bloomery iron-smelting technology can be divided into two main types, where slag might either be ‘tapped’ from the furnace or allowed to accumulate at the base. The majority of the earliest bloomery smelting evidence in England suggests that the slag produced during the process was retained in the lower part of the furnace or in a pit situated beneath it.Footnote 15 This produced iron-smelting slags with variable characteristics: some are present as slag cakes or furnace bottomsFootnote 16 but most are rather amorphous.Footnote 17 It is possible that the slag was removed at the end of the smelt (when solid) in order to allow the furnace to be used again.
Roman iron smelting appears to have taken place in shaft furnaces (>1 m high) with a ground-level hearth and typically produced large volumes of waste slag, especially tap slag.Footnote 18 It is clear that the molten slag was tapped from the furnace periodically during the smelting process, which would allow the smelt to run for longer, increase bloom production, and enable furnaces to be re-used multiple times.Footnote 19 These two approaches to bloomery iron smelting (tapping and non-tapping) are usually seen as distinct technologies,Footnote 20 with a chronological significance; the earliest iron smelting in Britain appeared to use a non-tapping approach, while most Roman smelting used tapping. Nevertheless, not all smelting slag from Roman sites is tap slag; a proportion of Roman smelting slag is similar to non-tapped smelting slag (or non-diagnostic ironworking slag).
Iron smelting within the M2 Junction 5 improvement scheme (Figs 2–7)
The most extensive area of iron-smelting evidence uncovered during the M2J5 archaeological investigations was in Area A and comprised four furnaces and their associated working hollows (19010/19005, 19022/19024, 9416/9418 and 9302/9303/9313; Fig. 2). Additionally, this area contained six possible working hollows (9317, 9321, 9323, 9426, 9427 and 9428) that were only partially exposed within the trial-trenches (TT93 and TT94; Fig. 2) and were subsequently preserved in situ (Table 1).Footnote 21 Evidence for iron smelting in Area B (Fig. 3) comprised two pit-like features (3912 and 3915) that exhibited heat-affected fills and slag, suggesting that they may also have served as working hollows. Possible associated activity comprised large pit 3602 in Area B (3.4 m in diameter and 1.2 m deep), which might have been linked to clay extraction to make the furnace shafts, and small pits 19028 (Area A; Fig. 2) and 3904 (Area B; Fig. 3), which were 1–1.4 m in diameter and 0.2–0.5 m deep. Both of these contained waste slag (383 g), although their exact function remains uncertain.Footnote 22 Notably, no features related to domestic activities or associated workshops were found within the M2J5 scheme.
Excavation status of smelting-related features in Areas A and B.

Table 1 Long description
The table details the excavation status of smelting-related features in Areas A and B, focusing on furnaces, working hollows, and pits. In Area A, feature 19022/19024 is fully excavated, while others like 19010/19005 and 9302/9303 are partially excavated. Many features, such as 9416/9418 and 9317, remain unexcavated or preserved in situ. In Area B, features 3312 and 3915 are 50% excavated, with feature 3602 only 25% excavated. The data highlight a trend of partial excavation in both areas, with a significant number of features in Area A left unexcavated.
Furnaces and working hollows (Figs 5–7)
The most complete structures recorded within the improvement scheme (9302/9303, 19010/19005 and 19022/19024) were in Area A and each comprised the remains of a furnace shaft and an associated working hollow (Figs 2 and 5–6). Structures 9302/9303, 19010/19005 and 19022/19024 were excavated longitudinally in order to record a profile of the shaft and working hollow, but only 19022/19024 was subject to full excavation (Table 1).
The furnace shafts were oval, with internal diameters ranging from 0.43 to 0.6 m. Constructed from clay, these shafts had thick, vertically sloping walls (e.g. furnaces 19022 and 19010; Figs 5–6) that had been constructed partially below ground level, surviving to a height of 0.35–0.6 m, though their original height remains unknown. The sides of the shafts were scorched, with concentric rings of heat-affected clay visible on the surface around them. Unlike the Stockbury pipeline examples, which displayed multiple layers from repeated repairs, these shafts showed no signs of relining.Footnote 23 All three shafts (9302, 19010 and 19022) had been constructed within and on the edge of wider features interpreted as working hollows. While the furnace walls would originally have extended into the working hollows, no remnants survived to indicate whether they included a tapping arch. There was also no evidence of a basal pit beneath the shafts, as would be expected in non-tapping technology.
An additional furnace (9416) was discovered in trial-trench TT94 (Fig. 2), where it remained unexcavated and was subsequently preserved in situ. It appeared to share a similar size and shape with the other furnaces, featuring concentric semi-circles of heat-affected clay in its layout, as illustrated in Figure 7.
The M2J5 furnaces were associated with sub-oval or sub-square-shaped working hollows (9303, 19005 and 19024; Figs 4–6) that would have facilitated the removal of slag from the shafts. The dimensions of the pits observed (approximately 0.6–1.5 m in diameter and 0.45–0.6 m deep) were comparable to the furnace construction pits recorded at sites F113 and F119 of the Stockbury pipeline.Footnote 24 However, there was an absence of larger working hollows, which were noted on the pipeline sites. This may be attributed to truncation resulting from previous construction activities associated with the M2.
Furnace 9302 and working hollow 9303/9313 under excavation (1 m scale).

Fig. 4 Long description
The image shows an excavation site with a rectangular pit. The pit has a distinct edge and appears to be carved into the ground. Above the pit, a measuring scale is placed horizontally, providing a reference for the size of the excavation. The surrounding area has a textured surface, indicating soil or earth. The pit has a curved section on one side, suggesting a specific shape or purpose in the excavation process.
Profile (1:20) and photograph (1 m scale) of furnace 19010 and working hollow 19005.

Fig. 5 Long description
The top section shows a diagram of an archaeological excavation profile, illustrating the furnace shaft and working hollow. It includes labels for burnt material, clay natural, chalk natural and radiocarbon sample locations. The diagram is oriented from northwest to southeast, with measurements marked at 0, 1.2 and 0.5 metres. Below, a photograph depicts the excavation site with a visible hollow in the ground. A measuring stick is placed across the hollow and a scale marker is positioned nearby. The ground shows different textures and materials, corresponding to the labelled sections in the diagram above.
Plan (1:20), profile (1:20) and photograph (1 m scale) of furnace 19022 and working hollow 19024.

Fig. 6 Long description
The top part shows a plan and section view of furnace 19022 and working hollow 19024. The plan illustrates the layout with labels indicating features such as the break of slope, fired clay lining, heat-affected material, clay natural and chalk natural. The section view provides a profile of the furnace and hollow, with specific layers marked, including burnt material and sediment location. The bottom part is a photograph showing the excavated furnace and hollow, with visible layers of soil and burnt material. A scale is present for reference, indicating the dimensions of the excavation site.
Photograph of furnace 9416 and associated working hollow 9418, preserved in situ (2 m scale).

Fig. 7 Long description
The image shows a clay surface with two distinct areas labeled ‘working hollow’ and ‘furnace shaft’. The surface appears to have been affected by heat, indicated by the colouration. Above these areas, a measuring stick is placed horizontally, providing scale for the features. The layout suggests a preserved archaeological site with concentric patterns visible in the clay.
Areas A and B contained a further eight pit-like features that have been interpreted as possible furnace working hollows (3912, 3915, 9317, 9321, 9323, 9426, 9427 and 9428; Figs 2 and 3) based on their similar size and shape to the aforementioned furnace structures, combined with the presence of charcoal-rich fills and waste slag. Features 3912, 3915 and 9428 in particular, collectively produced approximately 28 kg of industrial waste that included iron ore, tap slag, slag cakes, non-diagnostic ironworking slag, hammerscale and vitrified clay lining (VCL) (a fragment of which contained a possible tuyère hole, associated with the use of bellows). However, these features were only partially exposed during the trial-trench evaluation and only features 3912, 3915 and 9428 were subject to excavation (Table 1), so they could represent a mix of furnace working hollows and rubbish pits.
Bloomery deposits (Fig. 2)
In Area A, a sequence of nine deposits (9404, 9406–9413) was found in trial-trench TT94, underlying possible working hollows 9428, 9426 and 9427 (Fig. 2). The deposits covered an area of at least 10 m by 2 m and with a depth exceeding 0.7 m it is probable that they had formed within a hollow, although no cut was identified.
The deposits (Fig. 2) varied in thickness (between 0.1–0.3 m thick) and consisted of bands of dark-brownish grey sandy silts and lighter bands of yellowish brown, greyish brown and yellowish orange sandy clays and clayey silts. Blue and purple-grey mottling and lenses of whitish yellow clayey silt were noticeable throughout. Charcoal flecks and lumps of fired clay were identified in most of the deposits, whilst 150 g of slag was recovered from upper deposit 9404. The description of these deposits suggests that most of them originated as fragments of VCL and fired clay. The material had been comminuted so finely (and compressed?) that it resisted identification or sampling during excavation.
Environmental evidence
The charcoal assemblages from the furnace structures largely comprised oak, with smaller quantities of blackthorn/cherry, hazel and hawthorn group.Footnote 25 The dominance of oak is likely due to its increased thermal efficiency, with the other taxa potentially representing additional fuel sources or tinder material. Some charcoal fragments were mineral-encrusted or vitrified, which is suggestive of high-temperature burning consistent with iron production. Cereal waste (including barley and hulled wheat and a large amount of cereal chaff) from the backfill of furnace shaft 19010 may be indicative of waste from late-stage crop-processing activities, used as tinder in the furnace.Footnote 26
Dating evidence
Dating of the smelting activity within the scheme was problematic, due to difficulties in identifying contemporary artefacts and ecofacts associated with the use of the furnaces versus material derived from the infilling of these features after they had gone out of use. Three radiocarbon samples obtained from wood charcoal of short-lived species, collected from furnace structures 19010/19005 and 19022/19024 in Area A, returned date ranges corresponding to the Middle to Late Iron Age (Table 2; Figs 5 and 6). It is acknowledged that this represents an unusually early date for the application of tapping technology, but the samples of charcoal were obtained from the bases of the furnace shafts and working hollows and are considered to be from secure contexts.
Radiocarbon results from smelting-related features in Area A.

Table 2 Long description
The table presents radiocarbon dating results for smelting-related features in Area A, focusing on different sample materials and their δ13C values. The conventional radiocarbon ages range from 2163±24 to 1990±30 years before present. Calibrated ages show a spread from 360−280 cal. B.C. to 50 cal. B.C.−120 cal. A.D., indicating a broad timeline of smelting activities. Charcoal samples include Hazel and Cherry, with varying growth ring details. The δ13C values range from −27.9 to −25.8, suggesting differences in the carbon isotopic composition of the samples. The calibrated age ranges reflect a high probability of accuracy, with some samples showing multiple possible date ranges.
* The end points of the conventional radiocarbon calibrated ranges have been rounded out to the nearest ten years.
A probable Late Iron Age/Early Roman use of the iron-smelting site in Area A was indicated by a radiocarbon date from wood charcoal recovered from possible working hollow 9428 (Beta-481026; Table 2). This was supported by a small quantity of Southern British (‘Belgic’) grog-tempered pottery and unsourced flint and grog-tempered pottery of Late Iron Age/Early Roman date (12 sherds, 110 g) that was found in the upper fills of working hollows 19005 and 9313 and possible working hollow 9428. While the pottery recovered from Middle to Late Iron Age dated working hollow 19005 (structure 19010/19005) is considered to be intrusive, probably derived from a later episode of backfilling, the other features (9313 and 9428) could feasibly be of Late Iron Age/Early Roman date, making them more consistent with the furnaces found within the Stockbury pipeline and at Monks Orchard.Footnote 27
The M2J5 industrial waste assemblage (Figs 8–15)
By David Dungworth
Introduction
The form of the slag recovered from the M2J5 furnace structures and associated features indicates that most was produced during smelting. The slag would have formed inside furnaces at high temperatures (>1100°C): part of the iron ore yielded metallic iron, while the remaining ore would have reacted with the furnace lining and charcoal ash to form the slag. Gravity would encourage molten slag to accumulate toward the base of a furnace; however, this is also where the bloom formed (and where air was introduced into the furnace). The build-up of slag at the base of the furnace would eventually choke it, so the molten slag had to be managed by the smelters. The current form of the slag tells us how the smelters managed this problem.Footnote 28
The M2J5 slag assemblage includes both tap slag and non-tapped smelting slag and is comparable with the nearby and broadly contemporary Stockbury pipeline sites (F113 and F119; Fig. 1),Footnote 29 all of which appear to show iron smelting that employs elements of the prehistoric tradition (largely non-tapping) and the Roman tradition (tapping).
Visual examination
All of the slag and other associated waste from the M2J5 was examined visually and recorded following standard guidance.Footnote 30 The slag assemblage comprises both fayalitic waste slag and fragments of ceramic materials used in the construction of furnaces. While some of the slag appears to be in good condition, with little corrosion, some is partially obscured by thick layers of concreted iron corrosion products that impeded the successful identification of slag categories.Footnote 31
The main categories of material identified include the following:
Tap slag (TAP): This comprises lumps and sheets of fayalitic slag (i.e. the dominant mineral is fayalite, Fe2SiO4) with a characteristic ropey, flowed upper surface and a lower surface which retains impressions of the ground surface over which it ran while molten.Footnote 32 Tap slag is generally black in colour, does not respond to a magnet and contains low to moderate proportions of porosity.
Run/flow slag: This comprises small runs, flows, strands, or tendrils of fayalitic slag with smooth surfaces similar to the upper surface of tap slag.Footnote 33 The apparent direction of flow tends to be vertically. It is assumed that this slag flowed inside the furnace and around charcoal but it did not ‘wet’ the charcoal.
Furnace Bottom (FB): Large accumulations of fayalitic slag which formed close to the base of an iron bloom smelting furnace.Footnote 34 These are usually black and have a density consistent with a fayalitic (Fe2SiO4) composition (typically 4 g/cm3). Furnace bottoms are typically 250–300 mm in diameter and (when complete) can weigh in excess of 10 kg.Footnote 35 The accumulation of large masses of smelting slag in a furnace bottom indicates that the slag was not tapped from the furnace.
Slag Cake (SC): Circular or oval lumps of fayalitic slag, often with a flat or dished upper surface. Many such lumps of slag can be identified as smithing hearth cakes (SHC, see below) while the very largest examples can usually be identified as furnace bottoms (FB, see above). The category slag cake (SC) is used here to cover material which is either fragmentary or intermediate in size and could not be certainly identified as SHC or FB.
Smithing Hearth Cake (SHC): Circular or oval, and plano-convex (or concave convex), accumulations of fayalitic slag that formed inside a blacksmith’s hearth.Footnote 36
Furnace slag: Lumps of fayalitic slag characterised by the frequent impressions of charcoal on the surface. Furnace slag tends to have rather contorted shapes with a high surface area compared to their size (at least compared to tap slag or FBs). These slags are most commonly associated with an iron-smelting furnace where slag was not tapped but allowed to accumulate inside the fuel bed of the furnace.Footnote 37
Non-diagnostic Ironworking Slag (NDFe): Fragments of fayalitic slag which lack sufficient diagnostic surface morphology to allow a distinction to be made between smelting and smithing.Footnote 38 This category includes a high proportion of material which is too fragmentary to allow a specific identification of the process which generated it.
Vitrified Ceramic Lining (VCL): Vitrified ceramic usually showing a black vitreous (inner) face, an intermediate reduced fired ceramic layer and an oxidised-fired (outer) layer.Footnote 39
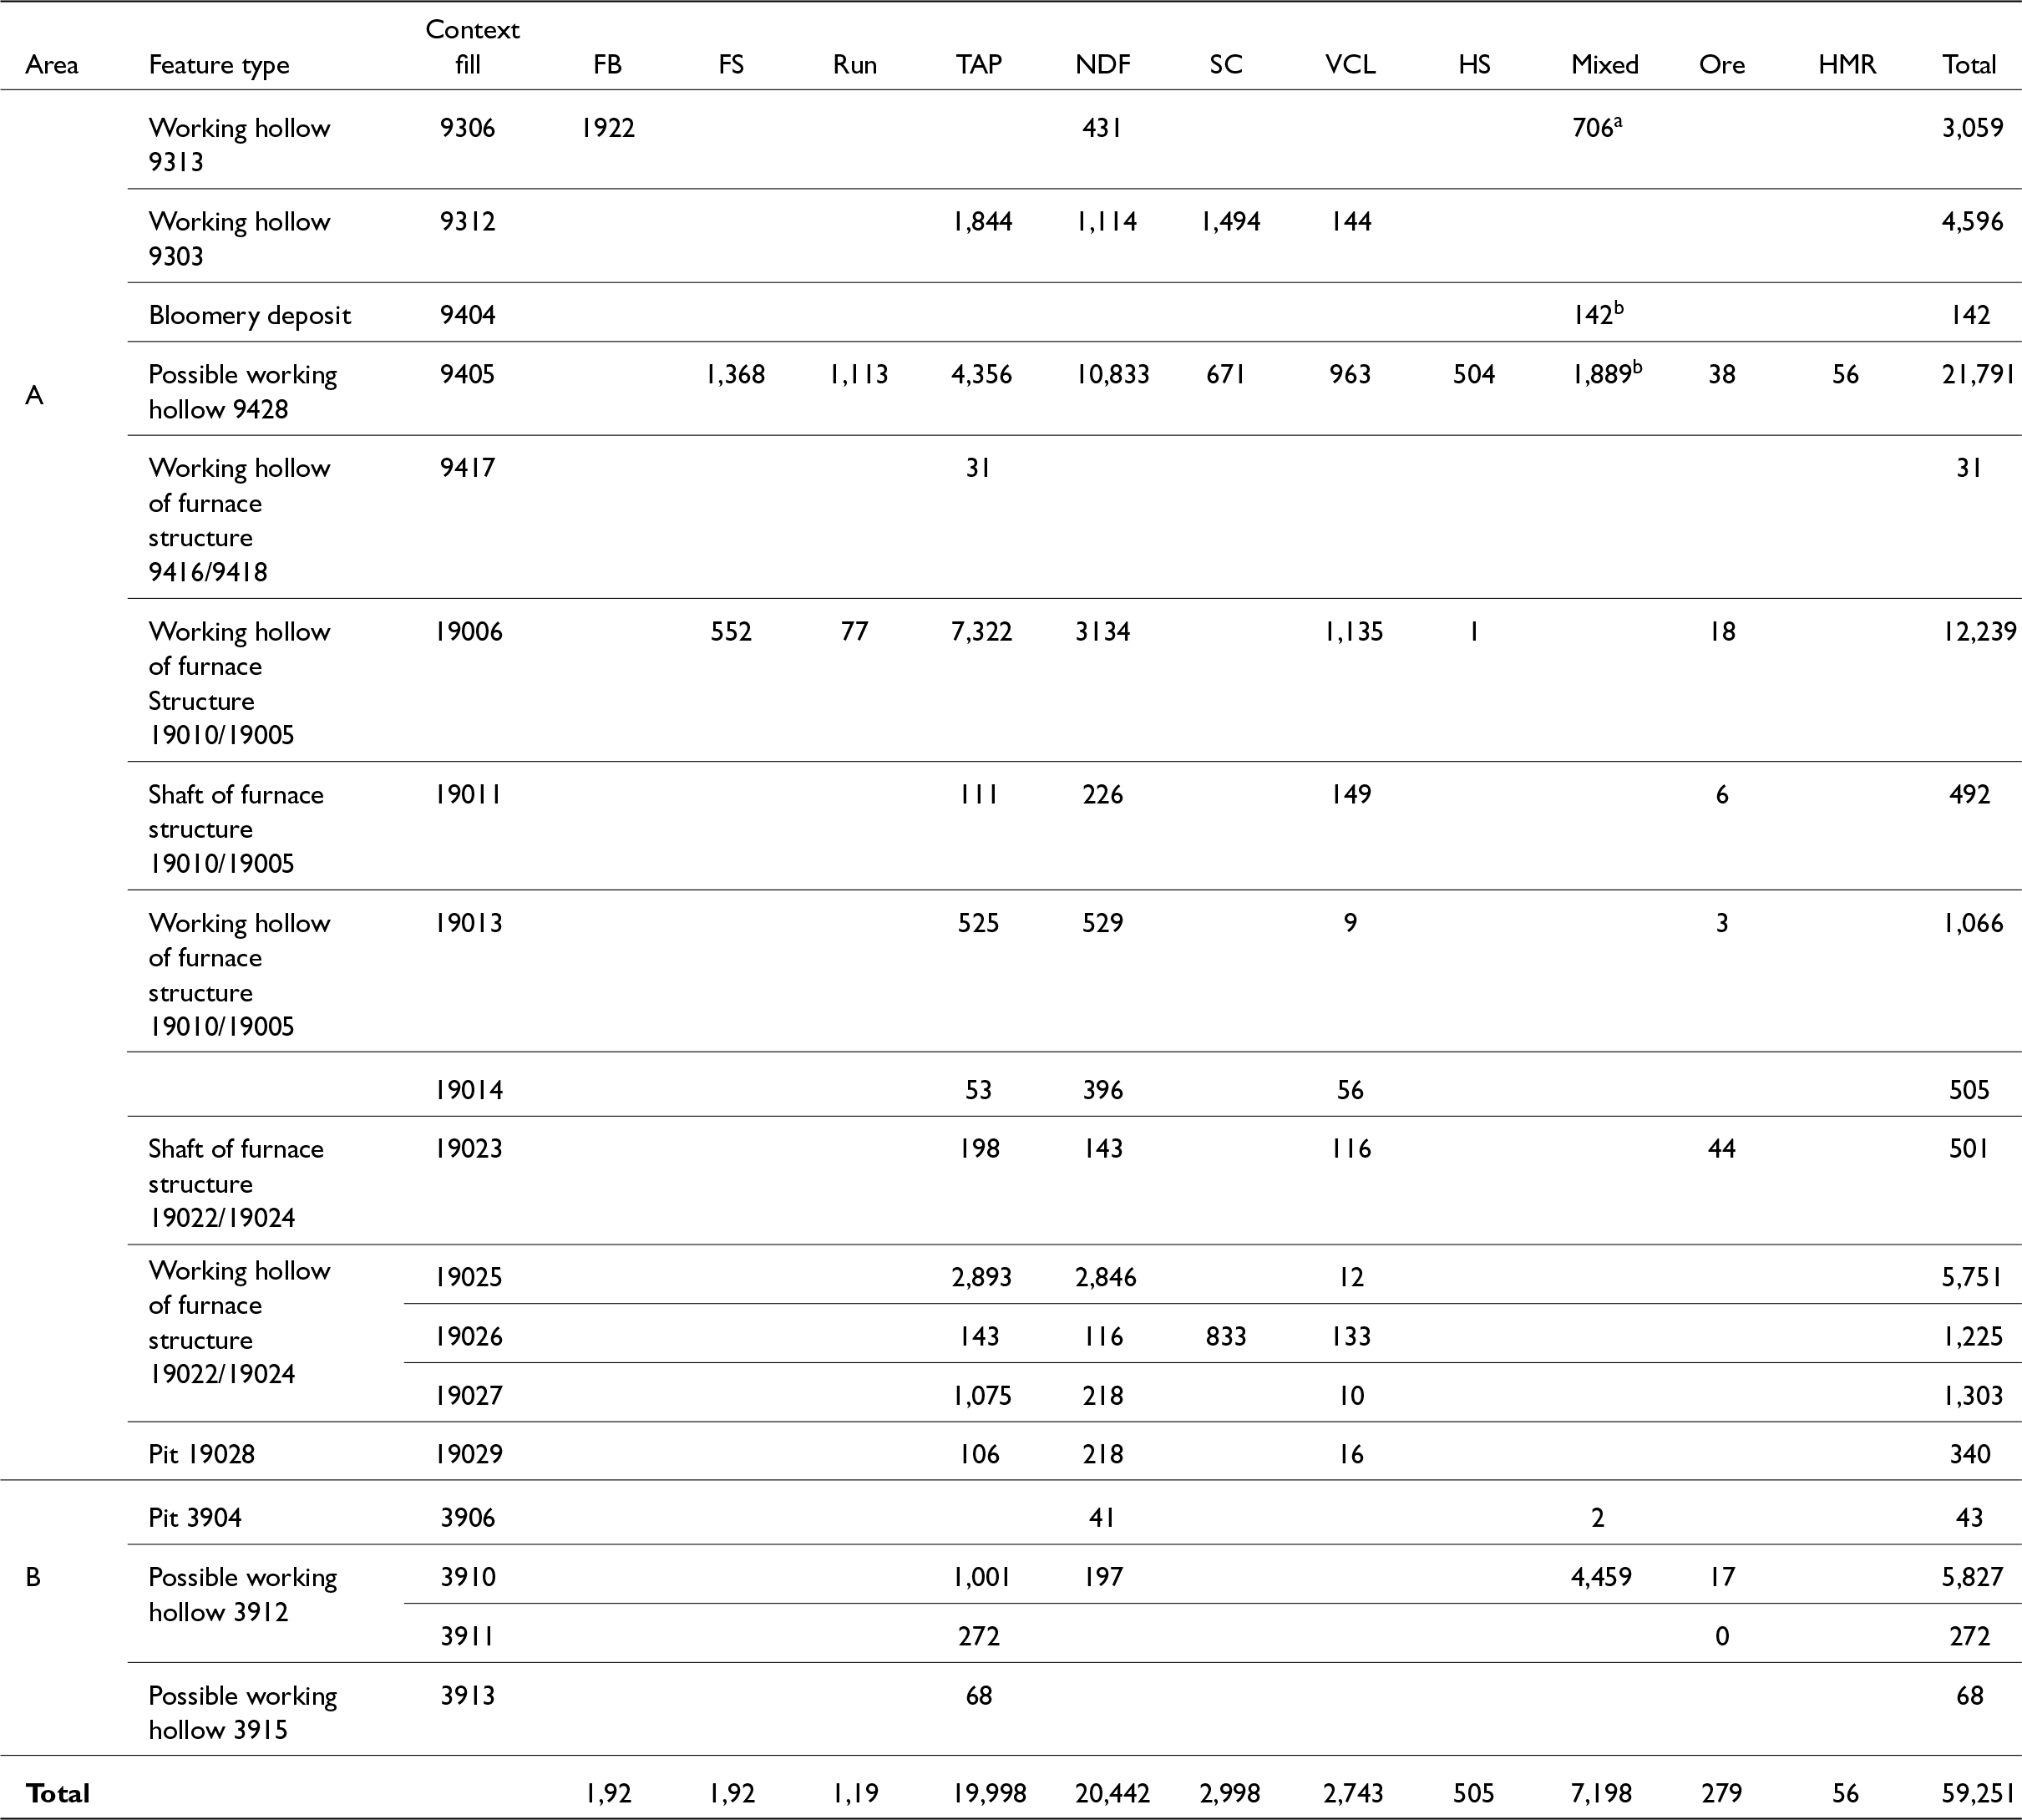
The M2J5 metalworking assemblage comprises 48.5 kg of (fayalitic) ironworking slag, 2.7 kg of associated ceramics and 8.1 kg of minor/mixed/miscellaneous materials (Table 3). The identification of the nature of the ironworking is hampered by the fact that the most abundant category of slag (20.4 kg) is non-diagnostic ironworking (NDFe) slag.Footnote 40 The remaining 28 kg of ironworking slag have diagnostic morphologies and provide evidence for smelting.
Summary of metalworking debris from M2 Junction 5 (a mixed = roasted ore fines and flint; b mixed = slag, fired clay and charcoal).

Table 3 Long description
The table summarizes metalworking debris from M2 Junction 5, detailing various types of slag and residues across different areas and features. Area A's possible working hollow 9428 shows the highest total debris at 21,791, primarily due to large amounts of tap slag (10,833) and non-diagnostic ironworking slag (4,356). In contrast, Area B's possible working hollow 3912 has a total of 5,827, with a notable amount of hammerscale (4,459). The data highlights significant variations in debris types and quantities across different features, indicating diverse metalworking activities. The absence of data in some cells suggests incomplete records or negligible findings for those categories.
FB = furnace bottom; FS = furnace slag; Run= fun/flow slag; TAP = tap slag; NDFe = non-diagnostic ironworking slag; SC = slag cake; VCL = vitrified clay lining; HS = hammerscale; HMR = heat-magnetised residues
The most abundant diagnostic slag is tap slag (20.0 kg, Fig. 8A). Much of this has fragmented but there are several fairly large (0.2–0.4 kg) fragments from sheets. Rarely, the tap slag contains small fragments of fired clay or VCL that became trapped when the slag was tapped from the furnace.
(A) tap slag from 9407 (upper surface on the left, lower surface on the right); (B) slag cake from 19026 (upper surface on the left, side view on the right); (C) run or flow slag from 9405.

Fig. 8 Long description
The image A shows tap slag from 9407, with the upper surface on the left and the lower surface on the right. The slag has a rough texture and irregular shape. The image B shows a slag cake from 19026, with the upper surface on the left and a side view on the right. It appears more compact and dense compared to the tap slag. The image C shows run or flow slag from 9405, consisting of several smaller fragments with varied shapes and sizes. A scale is present indicating measurements from zero to 50 millimetres.
The assemblage also includes 3.0 kg of slag cakes (Fig. 8B); however, it is not immediately clear whether these were produced during smelting or smithing. The slag cakes are slightly larger than most smithing hearth cakesFootnote 41 but smaller than smelting furnace bottoms.Footnote 42 The slag cakes resemble some of those from Trevelgue Head, Cornwall,Footnote 43 where the high manganese content indicated an association with smelting rather than smithing. Nevertheless, the presence of hammerscale (see below) shows that some smithing took place.
There is a variety of non-tapped smelting slags present, including furnace slag (1.9 kg), and run/flow slag (1.2 kg). The run slag consists of small irregular lumps with smooth flowed surfaces (Fig. 8C). Run slag often seems to have flowed around obstacles without ‘wetting’ them. The furnace slags varied in size and shape but all display abundant charcoal impressions, (Fig. 9A). The form of such slags is varied but they usually have relatively high surface areas for their volume: they display rather contorted shapes compared to most other types of ironworking slag.
(A) furnace slag from 9405 with some flow texture and charcoal impressions (three views); (B) ore from 3910; (C) ore (and flint) from 19006; and (Di–Dvi) polished cross-sections through the ore samples.

Fig. 9 Long description
The image A shows three views of furnace slag with flow texture and charcoal impressions. The image B displays several ore fragments scattered across the surface. The image C presents a larger ore piece alongside a smaller conical fragment. The images D subscript i to D subscript vi show polished cross-sections of ore samples arranged in circular patterns. Each circle contains various shapes and sizes of ore sections, highlighting their textures and surfaces. The scale bars indicate measurements for each section, with image A showing a scale of 50 millimetres and images D subscript i to D subscript vi showing a scale of 20 millimetres.
The proportion of tap slag identified (20.0 kg) far outweighs the non-tapped slag (3.1 kg (FS, Run; Table 2), 8.0 kg if the slag cakes are included) but this neglects the 20.7 kg of non-diagnostic ironworking (NDFe) slag. The NDFe slag is clearly identifiable (colour and density) as ironworking slag, but tends to be highly fragmented, with only a small proportion of original external surfaces. The NDFe slag is unlikely to include any tap slag (or run slag) as this is easily recognised (smooth, flowed surfaces), even when present as very small fragments (∼1 cm3). Therefore, it is proposed that the bulk of the 20.4 kg of NDFe slag derives from the fragmentation of non-tapped furnace slags.Footnote 44
A single context, fill 9405 of possible working hollow 9428, produced 560 g of hammerscale (∼90 per cent hammerscale, with small amounts of ore and slag), which shows that some forging took place. It is not immediately clear if this hammerscale represents artefact forging/repair or the initial forging of blooms.
A total of 7.2 kg of the assemblage comprises bags of mixed material from the heavy fraction left from sieving soil samples. The mixed material from possible working hollow 9428 (fill 9405) contains fragments of ore, slag, hammerscale, charcoal and fired clay, a mixture which is suggestive of smelting and forging. Those from possible working hollow 3912 (fill 3910) and working hollow 9313 (fill 9306) are predominantly made up of flint and ore, which suggests ore processing.
The assemblage includes numerous small fragments of iron ore (Fig. 9B–D). While some ore was collected by hand during excavation, much more is present in (mixed) residues from sieving soil samples. A few pieces of ore adhere to fragments of flint (Fig. 9C). The ore varies in colour from dark-greyish purple to reddish orange (Fig. 9Di–Dvi). The coincidence of ore and flint (and apparently no slag) in some of the mixed material samples from fills 3910 and 9306 suggest that ore processing might have occurred in the vicinity of these contexts.
The 2.7 kg of VCL represents fragments of smelting furnaces: it would be common for furnaces to be damaged during use (especially during extraction of an iron bloom at the end of a smelt). Nevertheless, the quantity of recovered VCL is modest, especially given the number of furnaces recorded.
Material distribution
The slag and related materials were recovered from a limited number of contexts (Tables 3 and 4). The largest collection of slag from a single context (21.8 kg) is that from possible working hollow 9428. The three excavated furnace structures (9302/9303/9313, 19010/19005 and 19022/19024) provided 7.6 kg, 14.3 kg and 8.8 kg of material, respectively, but this was usually present in three separate layers within each associated working hollow, although some was recovered from the shafts as well. The furnaces would not have been operable with the working hollows filled, so there is no certain link between the furnaces and the slag in the associated hollows. It is feasible to assume, however, that the furnace shafts and working hollows would have begun to infill soon after being abandoned and that at least some of the slag could have been waste produced during their use.
Summary of the principal slag-containing contexts in Area A (weight, kg).

Table 4 Long description
The table measures the weight of slag in kilograms across different contexts in Area A, categorized by TAP, Non-TAP, NDFe, and Other. Possible working hollow 9405 has the highest total slag weight at 21.8 kg, with NDFe being the largest contributor at 10.8 kg. In contrast, Furnace structure 9302/9303 has the lowest total slag weight at 4.6 kg, with Non-TAP contributing 2.6 kg. Furnace structure 19010/19005 and 19022/19024 have total weights of 14.3 kg and 8.8 kg, respectively, with NDFe being a significant contributor in both. The data suggests that NDFe is a major component across all contexts, indicating its prevalence in slag formation.
Scientific examination of selected samples
Methods
The analysis of 39 samples comprised recording microstructure using a scanning electron microscope (SEM) and determining chemical composition using an energy-dispersive spectrometer (EDS) attached to the SEM. Samples were prepared for analysis by embedding in resin and polishing the cross-section to a 1-micron finish. The SEM examination confirmed that many of the samples have regions which are at least partially corroded. These areas are marked by the leaching out of one phase; often the glassy matrix but in some cases, it is the iron oxide (wüstite) that has corroded. These areas are unlikely to provide accurate information on the nature of the slag before corrosion and so were avoided when collecting EDS data. Each sample was analysed several times using 5–12 separate areas. The EDS data comprises measurements of the concentrations of a range of elements and this elemental data has been converted into oxide weight percentage figures and then normalised to 100 weight (wt) per cent. The EDS data only covers the most abundant elements present. The detection limit varies from element to element but is never less than 0.1 wt per cent, and so data are only reported for a limited range of elements (Sodium (Na), Magnesium (Mg), Aluminium (Al), Silicon (Si), Phosphorus (P), Sulphur (S), Chlorine (Cl), Potassium (K), Calcium (Ca), Titanium (Ti), Manganese (Mn) and Iron (Fe); Table 5).
Average composition (and standard deviation) of analysed ore, slag, and ceramic samples.

Table 5 Long description
The table measures the average composition and standard deviation of various elements in ore, slag, and ceramic samples. Best ore has the highest mean FeO content at 94.8%, with a low standard deviation of ±2.3. In contrast, VCL ceramic has the highest mean SiO2 content at 81.1%, with a standard deviation of ±4.8. Tap slag and non-tap slag have similar FeO means, 66.9% and 66.0% respectively, but non-tap slag has a higher CaO mean at 3.87%. VCL vit has a notable K2O mean of 2.42%, with a high standard deviation of ±1.47, indicating variability. The data suggests significant differences in elemental composition across sample types, with some elements showing high variability.
Ore (Fig. 10)
Ferruginous lumps of possible ore were collected from five separate features. In most cases, these lumps proved to be sufficiently iron-rich that they can be regarded as iron ore (or at least waste from collecting and preparing ore); however, four samples are too low in iron to have been serviceable as an iron ore. The remaining samples generally fall into two groups: a very rich ore (>90 wt per cent iron oxide (FeO)) and a possible ore (70–90 wt per cent FeO), although some of the latter may represent the discard of ‘ore’ which was deemed too iron-poor.
The iron ore micromorphology is variable but mostly comprises an iron oxide matrix (cf. massive, microcrystalline hematite)Footnote 45 that contains varying proportions of silica-rich inclusions (Fig. 10A). These silica-rich inclusions are relatively large (0.01–0.1 mm) and some of these contain cracks. Cracks are also present throughout the iron-rich matrix, and their form and distribution suggests that cracking may have occurred over time with some cracks displaced by later cracks. Rarely, some parts of the iron ore appear to have a micro-botryoidal form (Fig. 10B) and others a ‘soft ore’.Footnote 46
SEM image of ore from 3910 showing iron oxide with quartz inclusions (A) and iron oxide with cracks and voids (B).

Fig. 10 Long description
The image A shows an SEM image of iron ore with quartz inclusions. The surface is marked by large, dark inclusions surrounded by a lighter matrix. Prominent cracks run across the image, intersecting the inclusions. The image B shows another SEM image of iron ore with cracks and voids. The surface features numerous small, irregularly shaped inclusions and voids. Cracks are visible throughout, with some intersecting the inclusions. Both images include scale bars and technical details at the bottom, such as magnification and date.
Tap slags (Fig. 11)
The tap slag samples (Fig. 11) are all fayalitic (dark grey) with minor areas of corrosion. A few of the samples also have ceramic material, as inclusions, or adhering to one surface. It is assumed that the tap slag ran over fragments of furnace lining, or that fragments of furnace lining fell onto the upper surface of slag during the tapping procedure.
SEM image of (A) tap slag from 9312 showing wüstite dendrites (white) and fayalite laths (grey); (B) SEM image of tap slag from 19025 showing fayalite laths with eutectic wüstite (fine white droplets in the grey laths). Hercynite (darker grey) is also visible at the margins of some fayalite laths; (C) SEM image of tap slag from 19023 showing very long and thin fayalite laths; (D) SEM image of tap slag from 19023 showing very short fayalite laths in a partially devitrified glassy matrix; and (E) SEM image of tap slag from 19027 showing iron oxide crystals along the boundary between two separate flows of taps slag (domains). The boundary is also marked by cracks or voids.

Fig. 11 Long description
The image A shows tap slag from 9312 with wüstite dendrites and fayalite laths. The image B shows tap slag from 19025 with fayalite laths, eutectic wüstite droplets and hercynite at the margins. The image C shows tap slag from 19023 with long, thin fayalite laths. The image D shows tap slag from 19023 with short fayalite laths in a partially devitrified glassy matrix. The image E shows tap slag from 19027 with iron oxide crystals along the boundary between two separate flows, marked by cracks or voids.
The tap slags largely share the same microstructure (Fig. 11). The mineral phases present (wüstite, fayalite and minor minerals) are typical of bloomery slags.Footnote 47 Fayalitic slags contain a high proportion of iron which can exist as fayalite (iron silicate, Fe2SiO4), but also as the oxide wüstite (FeO). Wüstite usually takes the form of dendrites (Fig. 11A), which likely solidified first as the slag cooled. Wüstite is also present in some samples as eutectic structures (usually fine droplets of one phase inside another distinct phase). In several samples there are some fayalite laths with eutectic wüstite (Fig. 11B). All of the tap slags contain a high proportion of fayalite (Fig. 11A), though the crystal form varies from very long thin laths (Fig. 11C), through intermediate laths, (and rarely) to short laths (Fig. 11D). A small proportion of the spinel hercynite (FeAl2O4) is present in some of the samples. This hercynite has crystallised after most of the fayalite but remains as inclusions trapped in the margins of fayalite (Fig. 11B). The matrix (or groundmass) in-between the wüstite and fayalite is conventionally described as glassy.Footnote 48 Tap slags are assumed to have cooled rather quickly with insufficient time for this glassy matrix to form crystalline phases. Electron microscopy has increasingly revealed that the ‘glassy matrix’ often does contain a range of (secondary) crystalline phases. These include phases which already crystallised (i.e. wüstite and fayalite) as well as traces of new complex minerals.
Where possible, chemical data was collected from separate flows within each sample of tap slag, but these tended to be chemically uniform. This chemical homogeneity between flows contrasts with the often sharp differences in microstructure (especially grain size and shape) that can be observed between different flows (e.g. Fig. 11E). The tap slag (Table 5) is rich in iron oxide and silica, with minor amounts of aluminium oxide, calcium oxide, and phosphorus oxide. Overall, the tap slag samples display slightly less chemical variation than the non-tapped slags (Table 5).
Smelting slag (non-tap) (Fig. 12)
The samples of non-tapped slag are morphologically diverse, but they include slag which appears to have collected at the base of a furnace, or along the side of the furnace, as well as furnace slags with abundant charcoal impressions, and those with vertical flow textures (i.e. runs inside the furnace). The non-tapped slag samples are all fayalitic but corrosion is common, and markedly more so than for the tapped slags. A few of the samples also have ceramic material (brown), as inclusions, or adhering to one surface. In two cases, the attached ceramic material appears to be the remains of a furnace wall (or perhaps the lining of a pit underneath the furnace). Where the ceramic furnace lining material lies directly below the slag (base of the furnace?) there has been relatively little reaction between the fayalitic slag and the ceramic, but where the ceramic appears to represent furnace wall there is often some localised melting of the ceramic to form glassy regions in between the ceramic and the fayalitic slag.
The non-tapped slags share the same microstructure (Fig. 12A–F) with a typical range of mineral phases present (wüstite, fayalite and minor minerals).Footnote 49 Wüstite is present in many of the non-tapped slags and it occasionally dominates the microstructure, largely obscuring other phases (Fig. 12A); however, several samples contain virtually no wüstite (Fig. 12B). Where wüstite is present, it usually takes the form of dendrites which can be relatively coarse (spacing of 20–50 µm) or fine (∼10 µm). Wüstite is present in some samples as eutectic structures (usually fine droplets of one phase inside another distinct phase).
SEM images of (A) furnace slag from 9405 showing abundant fine dendritic wüstite which partially obscures the other phases present; (B) furnace slag from 9312 showing fayalite laths of contrasting size in a glassy but partially devitrified matrix; (C) furnace slag from 19006 showing complex, devitrified matrix in between wüstite dendrites and fayalite laths; (D) SEM image of furnace slag from 19006 showing wüstite-leucite (white droplets in dark grey) and hercynite (slightly darker grey than the surrounding fayalite); (E) furnace slag from 3911 showing fayalitic slag above and ceramic below with a thin interaction zone (partially vitrified); and (F) furnace slag from 9306 showing vitrified ceramic and fayalitic slag filling a crack in the ceramic.

Fig. 12 Long description
Image A shows furnace slag from 9405 with fine dendritic wüstite partially obscuring other phases. Image B depicts slag from 9312 with fayalite laths of varying sizes in a glassy, partially devitrified matrix. Image C illustrates slag from 19006 with a complex, devitrified matrix between wüstite dendrites and fayalite laths. Image D presents slag from 19006 with wüstite-leucite droplets and hercynite in a fayalite matrix. Image E shows slag from 3911 with fayalitic slag above and ceramic below, featuring a thin interaction zone. Image F displays slag from 9306 with vitrified ceramic and fayalitic slag filling a crack in the ceramic.
Fayalite is the dominant phase in most samples (Fig. 12B) and the crystal form is variable (laths, most of which are quite short, and almost equiaxed crystals). A few samples have regions composed of near continuous fayalite where the shape of individual crystals is hard to discern. Most of the fayalite crystals are uniform and homogeneous; there is no sign of zoning. Eutectic fayalite-wüstite is rare. Two minor phases are present in the non-tapped slags: hercynite and leucite. Leucite (a potassium-aluminium-silicate, KAlSi2O6) is present in many samples (Fig. 12C) as distinct and uniform crystals that appear to be embedded in the margins of some the fayalite crystals. Some of the leucite forms small and finely dispersed particles within the fayalite that suggest a eutectic origin. The relatively abundant leucite is often accompanied by small euhedral crystals of hercynite (FeAl2O4). The matrix is variable in proportion and character. The matrix exhibits extensive crystallisation and is rarely glassy, even in part (Figs 12B–12D). The secondary crystallisation takes several different forms: laths, dendrites, florets, etc.
Fragments of ceramic material are present in several samples of non-tapped slag. The fragments on the base of non-tapped slag are assumed to be the base of the furnace structure (or possibly the pit underneath the furnace). The boundary in between the fayalitic slag and the underlying ceramic is sharp and relatively thin. There is an interaction zone where some slag has reacted with the underlying ceramic and effected a degree of vitrification up to 0.2 mm into the ceramic (Fig. 12E). Beyond this distance the ceramic has barely been fired by the heat: the matrix in the clay has not vitrified. This suggests that the centre of the fire would have been somewhere above this sample. Two fragments appear to have adhering ceramic from the side of the furnace (or the pit below the furnace) and these show much deeper vitrification of the ceramic and a much thicker interaction zone (Fig. 12F)
The chemical composition of the non-tapped smelting slags (Table 5) is broadly comparable with the tap slags (see above): high levels of iron oxide and silica, with minor amounts of aluminium, calcium and phosphorus. The only significant compositional difference in the average chemical composition is the elevated calcium content of some of the non-tapped slags. The tap slags and the non-tapped slags largely share the same average chemical composition, but the non-tapped slags display more chemical variability. The extremes of chemical composition are more commonly found in the samples of slag which were not tapped from the furnace.
Vitrified ceramic lining (Fig. 13)
Six samples of VCL have a pronounced vitrified (inner) surface with underlying areas of ceramic. The VCL samples share many microstructural features with each other and with some of the ceramic material previously seen adhering to samples of smelting slag (above). The ceramic regions are all composed of a quartz-rich clay. The quartz is fine-grained, with few inclusions above 0.1 mm in diameter. It is likely that the clay was naturally quartz-rich, rather than deliberately tempered. The ceramic regions furthest from the inner vitrified surface are least affected by the heat: these regions have a clay/silt matrix which has been fired but which shows no signs of forming a glassy matrix (Fig. 13A). Areas of ceramic with low degrees of heat/firing have abundant, small-sized, and irregularly shaped porosity. Areas closer to the heat (Fig. 13B–C) show progressively pronounced signs of vitrification. The clay/silt matrix melts and forms a glassy matrix; the number of pores rapidly decreases, while the remaining pores are larger. The quartz inclusions are enveloped in the glassy matrix and begin to be eroded by it, forming slightly smaller and more rounded particles. The quartz inclusions also show increased cracking due to heating/cooling.
SEM images of (A) VCL from 19014 showing fired ceramic region; (B) VCL from 19023 showing fired ceramic region; (C) VCL from 19023 showing quartz grains with a partially vitrified clay/silt matrix; and (D) VCL from 19006 showing the vitrified (glassy) inner surface (upper part) and the underlying vitrified ceramic with quartz inclusions.

Fig. 13 Long description
Image A shows a fired ceramic region from VCL 19014, displaying a dense microstructure. Image B depicts another fired ceramic region from VCL 19023, with visible porosity and irregular shapes. Image C illustrates quartz grains within a partially vitrified clay/silt matrix from VCL 19023, showing rounded particles and reduced porosity. Image D presents the vitrified inner surface of VCL 19006, with quartz inclusions and a glassy matrix, highlighting the effects of heat on the ceramic material.
The vitrified inner surface of VCL (Fig. 13D) is usually glassy, although often containing some crystalline material, and the glass has often separated into two components comprising fine glassy droplets in a glassy matrix (microphase separation).Footnote 50 The inner vitrified surface of VCL varies considerably in thickness from 0.1 mm to 10 mm. This reflects the intensity of the heating in different parts of the furnace: areas closest to the tuyère would be hottest and the surrounding clay would be the most vitrified.
The individual EDS analyses of VCL can be grouped into those areas in which there is minimal vitrification or contamination of the ceramic, and those in which there is marked vitrification and contamination (Table 5). The ceramic is very silica-rich, with moderate levels of aluminium oxide, iron oxide and potassium oxide. The more vitrified parts of the VCL show strongly elevated levels of iron oxide that probably derives from the slag generated in the furnace during smelting. Many components associated with the ceramic (SiO2, Al2O3, TiO2 and possibly MgO) decline as the result of reactions and contamination. Some components (K2O, CaO and P2O5) rise and may reflect the contribution made from fuel ash.
Hammerscale
A total of 0.5 kg of hammerscale was recovered from fill 9405 (of possible working hollow 9428) and samples of spherical, flake and irregular hammerscale were analysed. The spherical hammerscale is hollow (30–90 per cent of the volume being empty) with further small pores in the ‘walls’ of the spheres. The flake hammerscale is composed of several different iron oxides (wüstite and magnetite?) with a typical layered microstructure. The remaining samples of ‘irregular’ hammerscale are relatively large and are usually heterogeneous. The ‘irregular’ hammerscale might be an indicator that the assemblage represents bloom smithing.Footnote 51 The chemical analysis shows that most of the flakes tend to be iron-rich with low levels of other components, while the spheres, although still iron-rich, often have higher levels of silicon, aluminium, etc.Footnote 52
Summary
The scientific examination shows that the iron-smelting debris is relatively uniform in microstructure and chemical composition. All samples are dominated by the mineral fayalite and this is often accompanied by wüstite. Minor minerals are also present, especially leucite and hercynite. The tap slags and the non-tapped slags share the same average chemical composition, but the latter are less homogeneous than tap slags.
The strongest local parallel for M2J5 can be found within the Stockbury pipeline archaeological investigations,Footnote 53 where iron smelting (producing both tap slag and a substantial quantity of non-tapped smelting slag) took place at two locations (F113 and F119). The two Stockbury sites were broadly contemporary with each other (associated pottery was interpreted as coming from the last half of the first century b.c. to the first quarter of the first century a.d.), and broadly contemporary with the iron smelting in Areas A and B of the M2J5. The Stockbury slag shares a similar range of compositions (Figs 14 and 15; Table 6), that are also shared with those from the later (Roman) site at Westhawk Farm which lies 27 km to the south-east (Fig. 1).Footnote 54 The chemical similarities shared by these three smelting sites suggest the use of similar ores and smelting procedures. The slight differences from other regions suggest regionally specific iron-smelting traditions.Footnote 55
Plot of silica and iron oxide content (A) and aluminium oxide and potassium oxide content (B) of all smelting slag compared with Stockbury (Girbal Reference Girbal2019) and Westhawk Farm (Paynter Reference Paynter2007a).

Fig. 14 Long description
The image contains two scatter plots. The first plot (A) shows the relationship between silica (SiO subscript 2) weight percent on the x-axis and iron oxide (Fe subscript 2 O subscript 3) weight percent on the y-axis. Data points are marked for M2J5, Stockbury and Westhawk Farm, showing a downward trend. The second plot (B) displays aluminium oxide (Al subscript 2 O subscript 3) weight percent on the x-axis and potassium oxide (K subscript 2 O) weight percent on the y-axis. Data points for the same locations are scattered without a clear trend. Each plot uses different symbols to represent the data from M2J5, Stockbury and Westhawk Farm.
Plot of magnesium oxide and calcium oxide content (A) and phosphorus oxide and manganese oxide content (B) of all smelting slag compared with Stockbury (Girbal Reference Girbal2019) and Westhawk Farm (Paynter Reference Paynter2007a).

Fig. 15 Long description
The image A shows a scatter plot with magnesium oxide content on the x-axis (weight percent) and calcium oxide content on the y-axis (weight percent). Data points are represented by squares for M2J5, plus signs for Stockbury and crosses for Westhawk Farm. The image B shows a scatter plot with manganese oxide content on the x-axis (weight percent) and phosphorus oxide content on the y-axis (weight percent). Similar symbols are used to represent data from M2J5, Stockbury and Westhawk Farm.
Average chemical composition of M2J5 smelting slag (with Stockbury pipeline and Westhawk Farm for comparison).

Table 6 Long description
The table compares the average chemical composition of smelting slag from M2J5, Stockbury Pipeline, and Westhawk Farm. M2J5 slag has a mean FeO content of 66.5%, slightly lower than Stockbury's 68.7% but higher than Westhawk's 65.4%. Al2O3 levels are highest in Westhawk Farm at 5.59%, compared to 4.40% in M2J5 and 4.19% in Stockbury. P2O5 is most concentrated in Westhawk Farm at 1.47%, with Stockbury at 1.17% and M2J5 at 0.99%. Variability is noted in the standard deviations, particularly for CaO and FeO across all sites. These differences highlight the distinct chemical profiles of slag from each location.
The chemical composition of the smelting slags, ore and VCL from M2J5 can be used to model the bloomery process, and in particular how the slag formed.Footnote 56 The slag contains slightly elevated levels of a range of elements (Na, Mg, Al, P, K and Ca) compared to the ore. These chemical differences are due to the fact that the ore reacts with some of the furnace lining (rich in Al and K) and some of the charcoal ash (rich in Na, Mg, P, K and Ca). Material balance modelling suggests that each 1 kg of ore would be converted into 0.3–0.4 kg of iron bloom (and 0.5–0.8 kg of slag).
Discussion
The archaeological excavations undertaken for the M2J5 scheme uncovered evidence for at least four shaft furnace structures in Area A, with a further eight possible furnace working hollows uncovered in Areas A and B. In addition to these, numerous geophysical anomalies identified immediately to the west of Area A are likely to represent further furnaces (Fig. 2).Footnote 57 This evidence, together with the late prehistoric furnaces discovered within the Stockbury pipeline and at Monks Orchard, suggests that a significant and protracted regional iron-manufacturing industry had operated in the area of the Stockbury Valley prior to the Roman Conquest. Close links between the pipeline sites (F113 and F119; Fig. 1) and M2J5 Areas A and B is suggested by the use of similar furnace construction methods and smelting technology. However, the volume of slag and furnaces discovered at pipeline sites F113 and F119 significantly surpassed that found during the M2J5 archaeological excavations. Footnote 58
The current form of the slag from the StockburyFootnote 59 and M2J5 sites suggest that some was tapped from the furnace in a molten state while the remainder was left in the furnace (but could be removed cold before the furnace was re-used).Footnote 60 At the Stockbury pipeline sites, the presence of tap and non-tapped slag in association with shaft furnaces has been interpreted as possible evidence for a hybrid, transitional technology that employed elements of prehistoric non-tapping and perceived ‘imported’ Roman tapping smelting technology.Footnote 61
The location of a smelting industry in the Stockbury Valley would have been influenced by the availability of sources of wood and iron ore and the longevity of these production sites implies that this must have been a favourable location, with a sufficient supply of resources. The clay-with-flint geology in the area around Stockbury would have supported woodland and had possibly seen less woodland clearance in prehistory, compared to more fertile soils in the river valleys and footslopes of the downs.Footnote 62 The source of iron ore used by the M2J5 smelters could not be conclusively determined but analyses of the ore and slag from Stockbury and the M2J5 all show chemical similarities, suggesting the use of similar ores. It is likely that they would have utilised concretionary ironstone or iron pan from patches of Lenham beds sand within the clay-with-flints situated on the North Downs, and several large pits identified along the Stockbury pipeline easement were interpreted as possible ore extraction pits.Footnote 63
The use of tapping furnaces has traditionally been regarded as a technological innovation introduced to Britain in the later Iron Age, becoming widely adopted after the Roman Conquest.Footnote 64 However, the evidence from the M2J5 suggests that this technology was already being applied during the mid-fourth to first centuries b.c. in this area and definitely by the first century b.c./first century a.d. at the sites of Monks Orchard and Stockbury pipeline.Footnote 65
Acknowledgements
The authors would like to thank GRAHAM (GRAHAM Construction Company) for commissioning the project, on behalf of Highways England, and Simon Mason (Principal Archaeological Officer Kent County Council) for his guidance and monitoring during the fieldwork and post-excavation stages of the archaeological works. Fieldwork was undertaken by Eilidh Barr, Mike Donnelly, Joao Heitor, Pawel Jablonski, Rebecca Peacock, Daniele Pirisino, Joan Roig, Izzie Ward and Dane Wright, assisted by CA and OA staff. The illustrations were prepared by Ryan Wilson.