Implications
For decades, porcine genetic selection has targeted the improvement of growth rate, feed efficiency and carcass lean meat content, thus considerably improving production levels. However, it is not known whether this selection impacted animal resilience to psychological, physical or microbial stressors. At present, animal robustness is a new target in pig genetic selection. It is thus of importance to determine whether performance and robustness traits are antagonists. In this study, the comparison of two breeds of pigs (a productive widely used breed and a local rustic one) reared in two contrasted housing environments gives some information regarding the impact of selection for high meat production level on the susceptibility of animals to environmental stressors.
Introduction
For decades, genetic selection in porcine production has targeted the improvement of growth rate, feed efficiency and carcass lean meat content, resulting in a considerable increase in meat production levels. At present, the genetic selection schemes are asked to promote sustainable breeding and create robust animals, able to combine a high production potential with good resilience to psychological, physical or microbial stressors (Knap and Rauw, Reference Knap and Rauw2009). The neuroendocrine stress response and the immune response are two main physiological ways of self-protection and adaptation of organisms to environmental challenges. Both these systems display large interindividual variations, partly attributable to genetic background. In pigs, breed-related differences have been observed for basal and stress-induced secretion of cortisol and adenocorticotropic hormone (Désautés et al., Reference Désautés, Sarrieau, Caritez and Mormede1999; Désautés et al., Reference Désautés, Bidanel, Milan, Iannuccelli, Amigues, Bourgeois, Caritez, Renard, Chevalet and Mormède2002), acute-phase protein production (Clapperton et al., Reference Clapperton, Bishop, Piñeiro, Campbell and Glass2007), leukocyte blood numbers (Clapperton et al., Reference Clapperton, Bishop and Glass2005a), antibody- and cell-mediated immune responses (Joling et al., Reference Joling, Wever, Oskam and Henken1993; Wilkie and Mallard, Reference Wilkie and Mallard1999) and susceptibility to several viruses (Opriessnig et al., Reference Opriessnig, Fenaux, Thomas, Hoogland, Rothschild, Meng and Halbur2006; Vincent et al., Reference Vincent, Thacker, Halbur, Rothschild and Thacker2006; Petry et al., Reference Petry, Lunney, Boyd, Kuhar, Blankenship and Johnson2007). This variability was shown to rely on the additive genetic effects of a few quantitative trait loci (Edfors-Lilja et al., Reference Edfors-Lilja, Wattrang, Andersson and Fossum2000; Wimmers et al., Reference Wimmers, Murani, Schellander and Ponsuksili2009).
Negative phenotypic correlations can be found between immune and performance traits. For example, comparison of pig lines selected for high or low lean growth under restricted feeding (Clapperton et al., Reference Clapperton, Bishop and Glass2005a) or comparison of contrasted breeds such as Large White (LW) pigs and Meishan pigs (Clapperton et al., Reference Clapperton, Bishop, Cameron and Glass2005b) showed that high-producing animals have higher circulating levels of acute-phase proteins, such as α1-acid glycoprotein (AGP) or haptoglobin. These data suggest either that the higher-producing pigs were undergoing undetectable subclinical infections, whereas the less-efficient pigs would have a better health status, or that, in response to a similar immune stimulation, high-producing pigs would have a higher amplitude of inflammatory response than rustic animals. Accordingly, in a trial where two commercial lines of pigs were infected with porcine reproductive and respiratory syndrome virus, the fast-growing line suffered more severe clinical disease and greater reduction in BW growth after infection (Doeschl-Wilson et al., Reference Doeschl-Wilson, Kyriazakis, Vincent, Rothschild, Thacker and Galina-Pantoja2009). Regarding the endocrine system, genetic selection for efficiency or lean meat production is likely to have modified the release of hormones supporting nutrient utilization and storage, including catecholamines and cortisol (Foury et al., Reference Foury, Tribout, Bazin, Billon, Bouffaud, Gogue, Bidanel and Mormède2009).
Beside the immune and stress neuroendocrine responses, the ability to cope with oxidative stress caused by an imbalance between reactive oxygen species (ROS) production and antioxidant defense systems is another important factor for animal performances and longevity (Monaghan et al., Reference Monaghan, Metcalfe and Torres2009). Besides their roles in essential biological processes, including microbial killing by macrophages and neutrophils (Dröge, Reference Dröge2002), ROS cause oxidative stress at high concentrations. Numerous diseases, including pneumonia, enteritis and sepsis, in pigs generate oxidative stress (Lykkesfeldt and Svendsen, Reference Lykkesfeldt and Svendsen2007). As endogenous ROS are mainly by-products of metabolic processes, the level of oxidative stress can be an indicator of the ability of animals to sustain an adequate equilibrium between high metabolic performance and health status. Once again, literature suggests that the capacities of defense against oxidative stress are genetically controlled and negatively correlated with productivity in pigs and chicks (Brambilla et al., Reference Brambilla, Civitareale, Ballerini, Fiori, Amadori, Archetti, Regini and Betti2002; Castellini et al., Reference Castellini, Dal Bosco, Mugnai and Bernardini2002).
Thus, selection for high production levels might have been associated with an increased susceptibility of animals to environmental stressors such as pathogens, heat variations or psychological stressors (Rauw et al., Reference Rauw, Kanis, Noordhuizen-Stassen and Grommers1998; Prunier et al., Reference Prunier, Heinonen and Quesnel2010). This vulnerability would be even more marked in environments that strongly differ from the environment in which animals have been selected. This last point is of major importance for alternative outdoor or organic systems, where microbial and thermal environments might strongly differ from indoor conventional systems, but where the same breeds are often used (Dourmad et al., Reference Dourmad, Canario, Gilbert, Merlot, Quesnel and Prunier2010). For these reasons, the effect of the interaction between animal environment and genetic selection for high performance on welfare and health needs to be investigated. A way to address this question is to compare how breeds differing in growth performances and carcass leanness behave in different environments. For this purpose, the LW breed, displaying high growth performance and lean meat, was compared with the Basque (B) breed, characterized by rusticity, a low growth rate and a high adiposity. Animals from both breeds were placed in a conventional (C) housing environment, in which LW pigs have been selected, or in an enriched (E) environment. Their responsiveness to environmental conditions was addressed through the comparison of the intra-breed variation of activities of the corticotropic axis and the immune system. The same animals were used for meat quality measures that will be published elsewhere.
Material and methods
Animals, housing and experimental interventions
The experiment was conducted following French guidelines for animal care and use. People involved in the experiment were holders of an animal experimentation agreement delivered by the veterinary services of the French Ministry of Agriculture.
A total of 40 B and 40 LW castrated male pigs were used. The experiment was realized in two replicates undertaken in 2 successive years. Each trial started during summer and ended during winter. To slaughter the pigs from the two breeds at the same time, as well as the same BW, B pigs were put on experiment 1 month earlier because of their slower growth rate. Animals were transferred into two rooms (one per system) located in the same building between 3 (LW pigs) and 6 (B pigs) months of age (at 35 kg live weight). Each room had two pens containing 10 pigs of either B pigs or LW pigs. The C pens had concrete slatted floor (1.0 m2/pig) and a temperature fixed at 22.1 ± 1.0°C. The E pigs were on sawdust bedding (1.3 m2/pig) with free access to a roofed outdoor run dispensing 1.1 m2/pig. In C pens, the average ambient temperature was 21.9 ± 1.3°C (±s.d.). In the E housing system, the indoor mean ambient temperature was lower with greater fluctuation (17.9 ± 4.0°C) and the mean outdoor temperature was 13.1 + 6.2 °C. Pigs had free access to water and received standard grower and finishing diets (from 35 to 70 kg live weight and from 70 to 145 kg, respectively). They were fed ad libitum until average feed intake reached 2.5 kg/day per pig. Thereafter, they received 2.5 kg feed/day until 110 kg live weight and 3.0 kg/day afterwards.
Pigs from the four experimental groups were immunized on the same day against Keyhole Limpet Hemocyanin (KLH) at an average age of 136 and 221 days for LW pigs and B pigs, respectively. Pigs were injected intra-muscularly in the neck with 5 mg DNP-KLH (2,4-dinitrophenyl conjugated to KLH; Merck, Nottingham, UK) diluted in 1 ml sterilized water and 1 ml Montanide ISA 206 adjuvant (kindly provided by SEPPIC, 75321 Paris, France). A second injection was administered 3 weeks later. Pigs were sent to the slaughterhouse at the average live weight of 145 kg (average age of 230 and 315 days, for LW pigs and B pigs, respectively). Within replicate, pigs were slaughtered in four slaughtering sessions each including pigs from both breeds and housing environments. Animals from different housing pens were not mixed during the transportation and the resting time at slaughterhouse in order to prevent agonistic interactions between unfamiliar animals.
Sampling procedures and measurements
Blood was collected from the anterior vena cava 10 days after the second KLH immunization between 0830 and 0930 h (average age of 167 and 252 days for LW pigs and B pigs, respectively). The sampling procedure took less than 2 min. K2EDTA blood samples were collected for endocrine (cortisol, corticosteroid-binding globulin) and immune (blood formula, haptoglobin) assays. Samples were also collected in heparinized tubes for cell culture and in tubes without anticoagulant for immunoglobulins G (IgG) and Pig Major Acute-Phase protein (PigMAP) assays. Plasma and sera were kept at −20°C until use. Salivary samples were collected the day before blood sampling at 0700, 1100, 1500 and 1900 h. Salivary samples were collected by allowing pigs to chew on cotton buds until they were moistened. Cotton buds were rapidly centrifuged at 3000 × g for 15 min at 4°C. Saliva samples were stored at −20°C until assay. At slaughter, blood was collected on EDTA, heparin and without anticoagulant for haptoglobin, PigMAP, α1-acid glycoprotein (AGP) and hydrogen peroxide assays.
Animals were visually inspected three times for skin wounds during the fattening period at a BW of 84 ± 10, 99 ± 7 and 125 ± 4 kg (periods 1, 2 and 3, respectively). Each body region was assigned with a score adapted from the Welfare Quality WQ® Assessment Protocol for pigs (2009): score 0 – no significant wound, score 1 – more than one scratch of at least 2 cm length, score 2 – at least one deep or open wound, or more than 10 scratches of at least 2 cm length. Animals were assigned an overall score of 0 if the entire body region had a score of 0, 1 if at least one region had a score of 1 or 2 if at least two body regions had a score of 2. At slaughter, lungs were inspected for pleuritis and heart pericarditis. Lung lesions were scored by summing the score attributed to each of the seven lobes according to the consolidation surface area (from 0: no lesion to 4: total pulmonary consolidation), leading to an individual severity score ranging from 0 to 28 (Madec and Kobisch, Reference Madec and Kobisch1982). Rhinitis was estimated by summing the shrinking score attributed to each of the four turbinate bones inside the snout (from 0: intact to 4: total atrophy) and the distortion score attributed to the nasal wall (from 0: no deviation to 2: severe deviation), leading to an individual severity score on a scale from 0 to 18. During the second replicate, one pig from the LW-E group was excluded from the study before the blood sampling and one pig from the B-C group was excluded before the last skin injuries measurement because of death and major locomotion trouble, respectively.
Cortisol- and corticosteroid-binding globulin (CBG)-binding assays
Cortisol was assessed in plasma using an iodine 125 radio-immunoassay (Immunotech, Prague, Czech Republic) and in saliva using an immuno-luminescence assay (LIA, IBL, Hamburg, Germany). The respective detection thresholds were 8 and 2.1 ng/ml. Intra- and inter-assay variation coefficients (CV) were, respectively, 4.3% and 5% for plasma cortisol and 3.5% and 6.8% for salivary cortisol.
For CBG maximum binding capacity (CBG-Bmax), each plasma sample was incubated for 30 min on a shaking platform at room temperature with an equal volume of dextran-coated charcoal (5% charcoal and 0.5% dextran) to remove endogenous steroids. Charcoal was removed from the plasma by centrifugation at 3000 × g for 15 min. The binding capacity of CBG in the stripped plasma was determined at 4°C using a modification of the solid-phase assay method described by Pugeat et al. (Reference Pugeat, Chrousos, Nisula, Loriaux, Brandon and Lipsett1984) and adapted by Geverink et al. (Reference Geverink, Foury, Plastow, Gil, Gispert, Hortos, Furnols, Gort, Moisan and Mormède2006).
Hydroperoxide assay
The derivatives of Reactive Oxygen Metabolites (d-ROMs) test is a suitable test to evaluate the whole oxidant capacity of plasma samples. Hydrogen peroxide (H2O2) content was assessed in singleton in slaughter-heparinized blood samples taken from pigs of the second replicate only. The d-ROMs test kit (Callegari, Parma, Italy; distributor Deltavit Laboratory, Janzé, FRANCE) was used following the method described by Sauerwein et al. (Reference Sauerwein, Schmitz and Hiss2007). Intra- and inter-assay CVs were 8% and 10%, respectively. The results are expressed in mg equivalent H2O2/dl.
Blood formula, acute-phase proteins and IgG
The total numbers of leukocytes and the differential count of lymphocytes, monocytes and neutrophils were measured with a hematology automatic cell counter calibrated for pigs (MS-9®, Melet Schloesing laboratories, 95520 Osny, France; intra-assay CV < 3% for total leukocyte, lymphocyte and neutrophil and 6% for monocyte numbers). Commercial kits were used for haptoglobin (Ridascreen haptoglobin; R-Biopharm AG, Darmstadt, Germany; detection limit: 0.033 mg/ml, inter-assay CV: from 2% to 5%), PigMAP (PigMAP kit ELISA, PigCHAMP Pro Europa, Ségovie, Spain; detection limit: 0.44 mg/ml) and α1-acid glycoprotein (porcine a1AG SRID kit; Cardiotech Services, New Jersey 07762, USA; detection limit: 50 mg/ml, intra-assay CV: 4%). Total IgG and anti-KLH IgG were assessed by ELISA as described previously (Couret et al., Reference Couret, Jamin, Kuntz-Simon, Prunier and Merlot2009a and Reference Couret, Otten, Puppe, Prunier and Merlot2009b), using, respectively, a goat (Bethyl) and a rabbit (Nordic Immunological Laboratories) anti-pig IgG–Fc polyclonal antibody directed to whole pig IgG isotypes.
Lymphocyte cultures
Peripheral blood mononuclear cells (PBMCs) were isolated from heparinized blood samples by density gradient centrifugation, washed in Hank's Balanced salts (HBSS) culture medium and resuspended at a concentration of 10 × 106 cells/ml RPMI 1640 supplemented with 10% fetal bovine serum, 1% penicillin/streptomycin and 1% l-glutamine, as described previously (Couret et al., Reference Couret, Otten, Puppe, Prunier and Merlot2009b). For proliferation assays, cells (0.5 × 10⁶ cells/well in a final volume of 150 μl) were cultured in triplicate in the presence of the T-cell-specific mitogen concanavalin A (ConA 1.5 μg/ml), KLH (10 μg/ml) or medium alone (spontaneous proliferation), and pulsed after 68 h of incubation with MTT (0.5 μg/ml) for 4 h. All media and mitogens were obtained from Sigma-Aldrich (38297 Saint Quentin Fallavier, France), except KLH (Merck Chemicals, Nottingham, UK). A 10% SDS buffer in 0.01 M HCl was used to solubilize the dark blue crystals overnight at 37°C. The optical density (OD) was measured at a test wavelength of 550 to 600 nm and a reference wavelength of 630 nm.
For cytokine expression, assessed in the second experimental replicate only, cells were cultured in duplicate in the presence of KLH (10 μg/ml) or medium (9 × 10⁶ cells/well in a final volume of 1 ml). After 20 h, cells were collected in 2 ml centrifuge tubes, spinned down, suspended in 1 ml trizol and stored at −80°C until mRNA analysis.
Cytokine mRNA determination
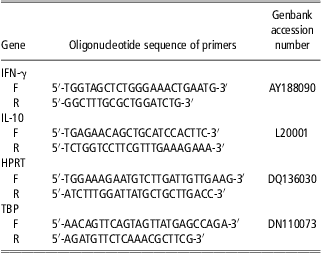
Interleukin-10 (IL-10) and interferon-gamma (IFN-γ) mRNA levels were investigated in KLH-stimulated cultures as respective markers of lymphocyte T-helper type 2 and type 1 KLH-specific responses. Total RNA was extracted from trizol-treated PBMCs, according to the method of Chomczynski and Sacchi (Reference Chomczynski and Sacchi1987). RNA concentration was evaluated by a ND-1000 Spectrophotometer (NanoDrop Technologies, Wilmington, DE, USA), and RNA quality was assessed using an Agilent Bioanalyser 2100 (Agilent Technologies, Santa-Clara, CA, USA). Complementary cDNA was synthesized from 20 ng of total DNAse-treated RNA in 10 μl of reaction buffer using random primers and murine Moloney leukemia virus reverse transcriptase, according to manufacturer's instructions (Applied Biosystems, Courtaboeuf, France). Forty cycles of amplification were carried out in 12.5 μl of PCR buffer (Fast SYBGreen® Master Mix, Applied Biosystem, Courtaboeuf, France) with 2.5 μl of 1/50 diluted first-strand cDNA reaction and 0.2 μM forward and reverse primers. The primers for porcine IL-10, IFN-γ and house-keeping genes (hypoxanthine phosphoribosyl-transferase and TATA-binding protein) are described in Table 1. A third house-keeping gene (18 S rRNA) was measured using the predeveloped Taqman kit from Applied Biosystems (Courtaboeuf, France). Amplification product specificity was checked by dissociation curve analysis and efficiencies (Ef) of each gene were calculated. For a given sample and a given gene, ΔCT(gene)sample was calculated as CT(gene)sample − CT(gene)calibrator, using a calibrator made of a pool of experimental samples. For each sample, the Efgene −ΔCT(gene) values of the three house-keeping genes were combined into a single normalization factor using GeNorm software (Vandesompele et al., Reference Vandesompele, De Preter, Pattyn, Poppe, Van Roy, De Paepe and Speleman2002). The amount of IL-10 and IFN-γ transcript was expressed as a ratio: Efcytokine −ΔCT(cytokine)/Normalization factor.
Oligonucleotide primers used for real-time reverse transcriptase-PCR and respective gene accession numbers

F = forward; R = reverse; IFN-γ = interferon-γ; IL-10 = interleukin-10; HPRT = hypoxanthine phosphoribosyl-transferase; TBP = TATA-binding protein.
Statistical analysis
A logarithmic (Log) transformation was performed for plasma cortisol and CBG-Bmax, a Log (var × 100) transformation for cytokine mRNA expression and a square-root transformation for salivary cortisol and cell proliferation in order to fit normal distributions. Data were analyzed using ANOVA and means and standard errors were calculated using the mixed procedure of SAS (version 8.1, 2000, SAS Inst. Inc., Cary, NC). The main factors of the analysis were genotype (G), housing (H), the genotype × housing interaction, and replicate was introduced as a random factor. For haptoglobin and PigMAP, the sampling date effect was added, as well as its interactions with housing and genotype and the random effect of individual pigs. For cell proliferation and cytokine mRNA, the mitogen (M) effect was also added, as well as its interactions with housing and genotype. Statistically not significant factors were gradually removed from the model, considering a significance level of 0.05 for main factors and 0.10 for interactions. The Bonferroni test was used for post-hoc comparisons. Pneumonia and rhinitis scores were analyzed using ANOVA as though they were continuous variables. The number of pigs per experimental group displaying pleuritis, pericarditis and a given score of body lesions (from 0 to 2) was analyzed with the Genmod procedure of SAS.
Results
Endocrine traits
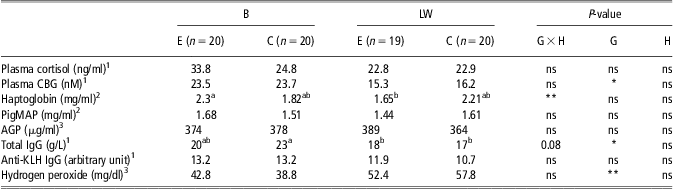
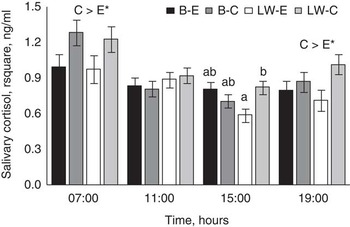
Cortisol concentrations and CBG-Bmax were investigated during the growing period. Plasma cortisol was not affected by any factor, whereas genotype influenced plasma CBG-Bmax, which was higher in B pigs than in LW pigs (P < 0.05; Table 2). Salivary cortisol was affected by housing environment when evaluated at both 0700 and 1900 h. The C pigs displayed higher levels than E pigs in both breeds (P < 0.05; Figure 1). At 1500 h, there was a significant genotype × housing interaction with higher saliva cortisol levels in the conventional than in the E environment for LW pigs, the B pigs of both housing systems being intermediate.
Blood parameters of B pigs and LW pigs housed in C or E environments

B = Basque; LW = Large White; C = conventional environment; E = enriched environment; G = genotype; H = housing; CBG = corticosteroid-binding globulin; PigMAP = porcine major acute-phase protein; AGP = α1-acid glycoprotein; Ig = immunoglobulin; KLH = Keyhole Limpet Hemocyanin.
The standard errors and P-values for G, H and G × H interaction are presented. For acute-phase proteins, the sampling period effect and its interaction with H and G were not significant, thus mean values including both time points are presented.
*, **Levels of significance of 0.05 and 0.01, respectively.
a,bMeans with different letters are statistically different (P < 0.05).
1Cortisol, CBG and Ig levels were assessed during the growing period.
2Haptoglobin and PigMAP were assessed during growing period and at slaughter.
3AGP and hydrogen peroxide were assessed at slaughter time only.
Salivary cortisol levels of Basque (B) and Large White (LW) pigs housed in conventional (C) or enriched (E) environments. Saliva was collected at an average age of 166 and 251 days for LW and B, respectively (B-E: n = 20; B-C: n = 20; LW-E: n = 19; LW-C: n = 20). Mean group values ±standard errors of the square root concentration (expressed in ng/ml) are presented. C > E means that the effect of housing is significant (*P < 0.05). When the genotype × housing interaction is significant, statistically different groups are annotated with different letters (a,b).

Inflammatory traits
PigMAP and haptoglobin levels were assessed during the growing period and at slaughter, whereas AGP levels were measured at slaughter only. PigMAP and AGP levels were neither affected by genotype nor by housing environment (Table 2). Haptoglobin levels were stable over time and were influenced by the genotype × housing interaction (P < 0.01). In the E environment, B pigs displayed higher haptoglobin levels than LW pigs, whereas both breeds had comparable levels in the C environment. Hydrogen peroxide (d-ROMs) level measured at slaughter was strongly influenced by the genotype, with lower concentrations in B pigs than in LW pigs (P < 0.001; Table 2).
Immune response traits
Total serum IgG concentrations were affected by genotype (P < 0.05; Table 2) and moderately by genotype × housing interaction (P = 0.08). B-C pigs displayed higher total IgG levels than LW pigs, whatever their housing environment, whereas B-E pigs had intermediate levels. Anti-KLH IgG titers were comparable in all groups (Table 2).
Leukocyte traits
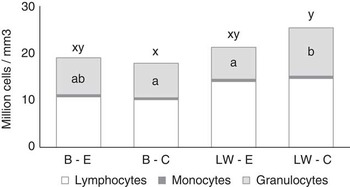
Total leukocyte number was affected by the genotype × housing interaction (P = 0.07; Figure 2). LW pigs displayed more total white blood cells than B pigs, but the difference was significant only in the C environment (P < 0.05). This genotype × housing interaction effect was partly because of higher granulocyte numbers in C-LW pigs than in E-LW pigs (P < 0.01). LW pigs also displayed higher lymphocyte numbers than B pigs, whatever the housing conditions (P < 0.001). Conversely, the relative percentage of lymphocytes and neutrophils and the lymphocyte/neutrophil (L/N) ratio were influenced by the genotype × housing interaction (P < 0.05, data not shown). LW pigs housed in the E environment had higher lymphocyte percent and L/N ratio and lower granulocyte percent than the other three groups (P < 0.05).
Blood numbers of total leukocytes, lymphocytes, monocytes and neutrophils of Basque (B) and Large White (LW) pigs housed in conventional (C) or enriched (E) environments. Blood was collected at an average age of 167 and 252 days for LW and B, respectively (B-E: n = 20; B-C: n = 20; LW-E: n = 19; LW-C: n = 20). Mean group values are expressed in million cells per mm3 of blood. When the genotype × housing interaction is significant, post-hoc comparison are indicated with small letters (a, b for the comparison of granulocyte numbers; x, y for the comparison of total white blood cell numbers).

Lymphocyte proliferation and cytokine mRNA expression
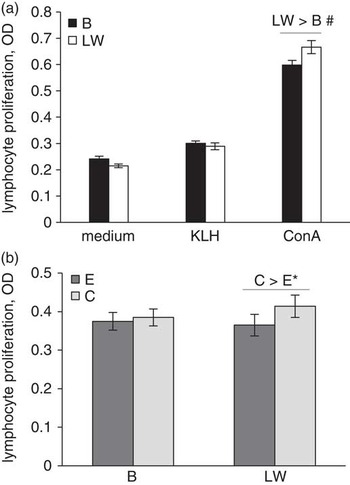
Blood lymphocyte proliferation was affected by the presence of mitogens in cell cultures in interaction with the genotype (P < 0.01; Figure 3). Cells from LW pigs tended to proliferate more than those from B pigs in response to ConA (P = 0.07). The housing × genotype interaction was also significant (P = 0.08). When the three culture conditions were analyzed together, cell proliferation was higher for the LW pigs reared in the C environment than in the E environment (P < 0.05), whereas for B pigs cell proliferation did not differ between housing environments (P > 0.1).
Proliferation of peripheral blood mononuclear cells of Basque (B) and Large White (LW) pigs housed in conventional (C) or enriched (E) environments. Blood was collected at an average age of 167 and 252 days for LW and B, respectively (B-E: n = 20; B-C: n = 20; LW-E: n = 19; LW-C: n = 20). The responses in the three culture conditions (medium alone, and medium supplemented with Keyhole Limpet Hemocyanin (KLH) or concanavalin (ConA)) were included in a single ANOVA model. The figure illustrates the mitogen × genotype interaction (a) and the genotype × housing interaction (b), which were both statistically relevant (P < 0.05 and P = 0.08, respectively). Mean group values ±standard errors of the square root concentration (expressed in optical density) are presented. P < 0.1, *P < 0.05 refer to post-hoc comparisons.

The level of expression of IFN-γ and IL-10 mRNA transcripts, the two cytokines implied in the control of the lymphocyte T helper responses of type 1 and 2 during antigen-specific responses, was investigated in blood cell cultures. Levels of both transcripts were higher in KLH-stimulated cultures than in spontaneous cultures (0.44 v. 0.06 ± 0.06, P < 0.001 for IFN-γ and 1.03 v. 0.57 ± 0.14 for IL-10, P < 0.05 for arbitrary units); however, genotype and housing environment had no significant effect on IFN-γ and IL-10 mRNA levels.
Skin and respiratory tract lesions
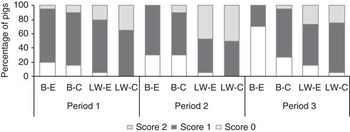
Genotype (P < 0.001) and housing environment (P < 0.05) influenced the numbers of pigs with skin lesion scores of 0 (Figure 4). The score 0 was more frequent among B pigs than LW pigs and among pigs reared in the E pens relative to C pens, regardless of the period. The score 2 was more frequent in LW pigs than in B pigs, and only B pigs exhibited differences between housing systems with less frequent score 2 in the E environment compared with the C environment (significant genotype × housing, P < 0.05). The period at which skin lesions were assessed influenced the frequency of scores 0 (P < 0.05) and 1 (P = 0.06). The frequency of score 0 was higher during the period 3 compared with periods 1 and 2 (P < 0.05). The frequency of score 1 was higher during period 1 than periods 2 and 3 (P < 0.05).
Frequency of skin lesions in Basque (B) and Large White (LW) pigs housed in conventional (C) or enriched (E) environments. Animals were visually inspected for skin wounds at a BW of 84 ± 10 kg (Period 1), 99 ± 7 kg (Period 2) and 125 ± 4 kg (Period 3), and assigned with a score ranging from 0 (no significant wound) to 2 (B-E: n = 20; B-C: n = 20; LW-E: n = 19; LW-C: n = 20).

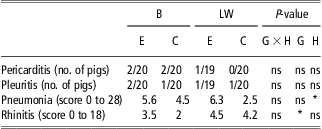
Among the 79 pigs included in the study, only 40 were absolutely free from any sign of rhinitis and 50 from pneumonia (0 scores). Rhinitis was more severe in LW pigs than in B pigs regardless of the environment. Pneumonia was more frequent in the E environment than in the C environment (P < 0.05) regardless of the genotype (Table 3).
Respiratory tract pathologies at slaughter in B pigs and LW pigs housed in C or E environments

B = Basque; LW = Large White; C = conventional environment; E = enriched environment; G = genotype; H = housing.
The frequencies of occurrence or the mean score per group are presented, as well as the P-values for G, H and G × H interaction.
*Level of significance of 0.05.
Discussion
The aim of this study was to determine whether porcine breeds differing in their expected rusticity would show differences in their adaptive capacities to different housing environments. It was mainly focused on the interaction between breed and housing factors, assuming that the breed displaying the higher within-breed differences for health and immune traits between the two environments could be considered as more sensitive to environmental stressors.
Genotype effects
This experiment was also designed to evaluate meat quality, and thus animals had to be slaughtered in the same batches at the same live weight. Taking into account that growth rate is slower in B pigs, these animals started the experiment and were slaughtered at an older age. Therefore, the breed effect is confounded with an age effect. However, animals of both genotypes were observed well before senescence at a period when age has no clear effect on the parameters measured here (see discussion below).
A significant genotype effect was observed for plasma CBG with higher levels in B pigs than in LW pigs. Such an effect was expected as higher plasma levels were previously observed in fat than in lean breeds of pigs (Ousova et al., Reference Ousova, Guyonnet-Duperat, Iannuccelli, Bidanel, Milan, Genet, Llamas, Yerle, Gellin, Chardon, Emptoz-Bonneton, Pugeat, Mormede and Moisan2004; Geverink et al., Reference Geverink, Foury, Plastow, Gil, Gispert, Hortos, Furnols, Gort, Moisan and Mormède2006). Indeed, it is hypothesized that the CBG gene could play a role in fat tissue development (Ousova et al., Reference Ousova, Guyonnet-Duperat, Iannuccelli, Bidanel, Milan, Genet, Llamas, Yerle, Gellin, Chardon, Emptoz-Bonneton, Pugeat, Mormede and Moisan2004). This probably does not result from the difference of age between the two breeds because plasma CBG levels are stable after 3 months of age in pigs (Roberts et al., Reference Roberts, Kattesh, Baumbach, Gillespie, Godkin, Schneider and Saxton2003). Higher plasma and salivary cortisol levels were also expected in B pigs than in LW pigs as previously observed in Meishan pigs compared with LW pigs (Désautés et al., Reference Désautés, Sarrieau, Caritez and Mormede1999; Désautés et al., Reference Désautés, Bidanel, Milan, Iannuccelli, Amigues, Bourgeois, Caritez, Renard, Chevalet and Mormède2002). Our data did not support such difference. However, a higher cortisol release in LW pigs than B pigs due to food frustration (Prunier et al., Reference Prunier, Dourmad and Etienne1993) and social stress (Coutellier et al., Reference Coutellier, Arnould, Boissy, Orgeur, Prunier, Veissier and Meunier-Salaün2007) could have masked the genotype effect. Indeed, pigs from both breeds received the same amount of feed at a given live weight, whereas the potential growth rate and appetite are much higher in LW pigs than in B pigs. The higher level of social competition in LW pigs than in B pigs is supported here by the higher score of skin lesions in LW pigs.
Measurement of d-ROMs in blood has been reported as indicative of oxidative stress (Ridker et al., Reference Ridker, Brown, Vaughan, Harrison and Mehta2004) and already used as an oxidative stress index in human, calves and pigs (Cornelli et al., Reference Cornelli, Terranova, Luca, Cornelli and Alberti2001; Ballerini et al., Reference Ballerini, Civitareale, Fiori, Regini, Betti and Brambilla2003; Brambilla et al., Reference Brambilla, Ballerini, Civitareale, Fiori, Neri, Cavallina, Nardoni and Giannetti2003). In this study, B pigs had lower d-ROMs levels than LW pigs regardless of their housing environment, which is in agreement with the hypothesis of a better redox status in rustic slow-growing pigs relative to fast-growing pigs (Brambilla et al., Reference Brambilla, Civitareale, Ballerini, Fiori, Amadori, Archetti, Regini and Betti2002). In birds, resistance of red blood cells to ROS has also been negatively correlated to growth rate. Most of these studies suggest that animals usually grow at suboptimal level in order to maintain their capacity to cope with oxidative stress. Thus, selection for high growth potential might have impaired the ability to adapt to oxidative stress and/or accelerated ROS production through higher metabolic rate. Serum d-ROMs are also associated with inflammation (Hirose et al., Reference Hirose, Kawabe, Komiya and Saito2009) and to physical activity (Bloomer and Fisher-Wellman, Reference Bloomer and Fisher-Wellman2008) in humans. In our study, the differences between the two genotypes are unlikely to result from differences in inflammatory status, as the two breeds did not differ in their acute-phase proteins levels (see below paragraph). However, as LW pigs were shown to be more aggressive than B pigs in their home pen, it might have been also the case during the 1-day fasting before slaughter, leading to increased physical activity, and thus increased d-ROMs. Differences in age cannot explain the higher d-ROMs level of LW pigs relative to B pigs. Indeed, oxidative stress has been shown to increase with age (Dröge, Reference Dröge2002), and, in our study, the eldest B pigs had the lowest oxidative status.
Regarding immune function, significant genotype effects were observed at the level of blood lymphocyte counts. This probably does not result from the difference in age between the two breeds because blood formula reaches stable levels over 3 months of age in pigs (Stull et al., Reference Stull, Kachulis, Farley and Koenig1999). A possible explanation might be differences in physical integrity (skin injuries) and microbial infection (rhinitis), which affect blood formula, and were more severe in LW pigs than in B pigs. Otherwise, the differences in leukocyte counts might be related to genetic factors (Edfors-Lilja et al., Reference Edfors-Lilja, Wattrang, Andersson and Fossum2000). In accordance with this latter hypothesis, several results suggest that the number of circulating lymphocytes might be inversely correlated to carcass leanness and growth performance (Clapperton et al., Reference Clapperton, Bishop and Glass2005a and Reference Clapperton, Bishop and Glass2006). The two breeds did not differ in their acute-phase proteins levels. This is in agreement with the literature regarding haptoglobin (Magnusson et al., Reference Magnusson, Wilkie, Artursson and Mallard1999; Clapperton et al., Reference Clapperton, Bishop and Glass2005a and Reference Clapperton, Bishop, Cameron and Glass2005b) but unexpected regarding PigMAP and AGP levels, which were reported to be higher in LW pigs than Meishan pigs (Clapperton et al., Reference Clapperton, Bishop and Glass2005a, Reference Clapperton, Bishop, Cameron and Glass2005b and Reference Clapperton, Bishop, Piñeiro, Campbell and Glass2007).
Housing system effects
The positive effect of E housing has been attributed to a higher behavioral stimulation of the animals, leading to more environmental investigation and physical activity and less congener oral manipulations (de Jong et al.; Reference de Jong, Ekkel, van de Burgwal, Lambooij, Korte, Ruis, Koolhaas and Blokhuis1998; Lebret, Reference Lebret2008). Regarding the corticotropic axis activity, pigs had higher salivary cortisol levels in the C pens than in the E pens. Such an effect on salivary cortisol is in agreement with results from de Leeuw and Ekkel (Reference de Leeuw and Ekkel2004) but in contradiction with those from de Jong et al. (Reference de Jong, Ekkel, van de Burgwal, Lambooij, Korte, Ruis, Koolhaas and Blokhuis1998) and de Groot et al. (Reference de Groot, de Jong, Prelle and Koolhaas2000), showing higher levels of salivary cortisol in pigs reared in the E environment or with results from Morrison et al. (Reference Morrison, Johnston and Hilbrands2007) showing no difference between housing environments. In a previous study comparing pigs reared in the same E and C environments as described here, similar levels of urinary cortisol were also found in both environments (Lebret et al., Reference Lebret, Prunier, Bonhomme, Foury, Mormède and Dourmad2011). Three hypotheses may explain the discrepancies between studies. First, the studies relating an increase of salivary cortisol in response to enrichment used concrete floor daily covered with fresh straw, whereas the other studies and ours used deep litter. Fresh straw may stimulate investigative and social activities and hence adrenal activity more than deep litter. Second, rearing in an E environment from birth until 7 weeks of age seems to increase salivary cortisol secretion during daytime compared with rearing in a barren environment (Munsterhjelm et al., Reference Munsterhjelm, Valros, Heinonen, Halli, Sijander-Rasi and Peltioniemi2010). Our pigs and those from de Leeuw and Ekkel (Reference de Leeuw and Ekkel2004), Morrison et al. (Reference Morrison, Johnston and Hilbrands2007) and Lebret et al. (Reference Lebret, Prunier, Bonhomme, Foury, Mormède and Dourmad2011) were reared in a C system during early life contrarily to those from de Jong et al. (Reference de Jong, Ekkel, van de Burgwal, Lambooij, Korte, Ruis, Koolhaas and Blokhuis1998) and de Groot et al. (Reference de Groot, de Jong, Prelle and Koolhaas2000) who were placed in an E system from birth. Third, in this study, social competition was higher in the barren than in the E environment as shown by the score lesions, and social stress is known to increase salivary concentrations of cortisol in pigs (Coutellier et al., Reference Coutellier, Arnould, Boissy, Orgeur, Prunier, Veissier and Meunier-Salaün2007).
Surprisingly, plasma cortisol levels were not affected by housing. The discrepancy between salivary and plasma results may be explained by diurnal-related variations. Indeed, the influence of housing on salivary cortisol was observed at 0700 h but not at 1100 h, whereas blood samples were drawn between 0830 and 0930 h. Moreover, salivary cortisol is more tightly linked to the free fraction of circulating cortisol than to the total concentration of cortisol that was measured in this study (Vining et al., Reference Vining, McGinley, Maksvytis and Ho1983; Perogamvros et al., Reference Perogamvros, Keevil, Ray and Trainer2010).
Pneumonia severity scores at slaughter were higher in the E pens compared with the C pens for both breeds. The lower ambient temperature, as well as the higher temperature variation between indoor and outdoor areas of the E environment might have influenced the severity of respiratory tract pathologies. However, on average, the pneumonia severity remained low in both housing environments, and the difference in respiratory diseases severity among the two housings remained at a subclinical level and did not lead to severe inflammation, as acute-phase proteins were unaffected by housing at any of the two sampling points.
Even if acute exercise can be associated with increased oxidative stress (Bloomer and Fisher-Wellman, Reference Bloomer and Fisher-Wellman2008), the lack of difference in d-ROM levels between the two housing systems is not surprising. In fact, E pigs might have experienced mild intense bouts of exercise not sufficient to alter their oxidative status. Finally, all pigs were exposed to stress before slaughter (mainly during transport), which could have masked a potential housing effect and could also explain the quite high d-ROMs levels recorded for all pigs in this study.
Genotype × housing interaction
Regarding the corticotrope axis, conventional housing increased salivary secretion levels in both breeds at 0700 and 1900 h. However, during daytime (1100 and 1500 h samplings), B pigs had similar levels in both environments, whereas C-LW pigs had already higher levels than E-LW pigs at 1500 h. This suggests that LW pigs were more steadily affected than B pigs by the stressful C housing. Regarding the immune function, housing effects were never observed in both breeds simultaneously but were more often visible among the LW breed. Neutrophil numbers and blood lymphocyte proliferation were lower in LW pigs housed in E pens relative to C pens. The immune differences observed in our study might be because of differences in stress levels between the two housing systems. Glucocorticoids control circulating blood leukocyte numbers (Dhabhar et al., Reference Dhabhar, Miller, McEwen and Spencer1995), and a low L/N ratio is usually associated with high circulating cortisol levels. This matches with our data, as C-LW pigs displayed a lower L/N ratio than E-LW pigs and also showed more steadily increased levels of salivary cortisol over the day. Conversely, in B pigs, the L/N ratio and the salivary cortisol levels during daytime (1100 and 1500 h) were similar in the two housing systems.
Differences in lymphocyte proliferation could hardly be explained by the differences in cortisol. High circulatory levels are usually associated with a suppression of proliferation in situations of acute stress (Wallgren et al., Reference Wallgren, Wilén and Fossum1993), but this effect is much less obvious in situations of long-lasting stress (de Groot et al., Reference de Groot, de Jong, Prelle and Koolhaas2000; Couret et al., Reference Couret, Otten, Puppe, Prunier and Merlot2009b). Differences in lymphocyte proliferation may be induced by differences in the level of immune stimulation of pigs, because of differences in their microbial environment. Sawdust bedding and concrete floor usually marginally differ in the microbial composition of bioaerosols (Letourneau et al., Reference Letourneau, Nehme, Meriaux, Masse and Duchaine2010), but the access to an outdoor area might have provided a more diversified microbial environment, although the design of the area (roof, concrete floor, wire fencing) limited the contacts of pigs with wild animals and soil microorganisms. The fact that only LW pigs had an increased proliferation in C environment relative to E environment is in agreement with our leukocyte count and salivary cortisol data, and suggests that LW pigs’ adaptive traits are more influenced by the environment than those of B pigs.
Conclusion
This study showed that B pigs and LW pigs were differentially influenced by their housing environment at both endocrine and immune levels. The major result was that the two breeds exhibited some differences in their adaptation to the housing environment. Among the 24 sanitary, endocrine or immune traits investigated, the housing conditions affected eight variables in both breeds (salivary cortisol at 0700 and 1900 h, severity of pneumonia at slaughter) or only in B pigs (sever skin lesions) or LW pigs (salivary cortisol at 1500 h, granulocyte numbers and lymphocyte/granulocyte ratio and lymphocyte proliferation). Broadly speaking, LW pigs seemed to be more affected by the environment than B pigs. These observations strengthen the hypothesis that selection for high meat production level might be associated with an increased susceptibility of animals to environmental stressors.
Acknowledgment
The authors gratefully acknowledge from the European Community financial participation under the 6th Framework Program for Research, Technological Development and Demonstration Activities, for the Integrated Project Q-PORKCHAINS FOOD-CT-2007-036245. We thank A.-M. Mounier, M. Génissel, C. Guérin, M. Lefèbvre, H. Demay, B. Carissant, P. Touanel, M. Alix, J. Liger, J.F. Rouaud and N. Bonhomme from the PEGASE unit for their technical help; A. Foury and P. Mormède for the CBG assay, the B pig producer network for providing animals and SEPPIC society for providing Montanide adjuvant.
Disclaimer
The views expressed in this publication are the sole responsibility of the author(s) and do not necessarily reflect the views of the European Commission. Neither the European Commission nor any person acting on behalf of the Commission is responsible for the use, which might be made of the information. The information in this document is provided as is and no guarantee or warranty is given that the information is fit for any particular purpose. The user thereof uses the information at its sole risk and liability.