I. INTRODUCTION
The coercive field (H c) is an important feature of a magnet. A large effort has recently been spent on enhancing H c due to the desire for increasing technological applications.Reference Ishii and Sencia1–Reference Jin, Ohkoshi and Hashimoto3 In light of high magnetocrystalline anisotropy, rare earth-transition metal alloys such as SmCo5 and Nd2Fe14B materials are well-known permanent magnets with an achievable H c above 3.3 and 10.0 T.Reference Lu, Song and Zhang4, Reference Kronmuller5 For iron oxides, however, a boost to their H c has been limited because of their low magnetocrystalline anisotropy and spin-orbit coupling effects.Reference Ishii and Sencia1–Reference Jin, Ohkoshi and Hashimoto3, Reference Dutta, Manivannan, Seehra, Shah and Huffman6–Reference Zhou, Zhang, Gong, Zhang, Wu, Du and Wu28 Although rare earth-transition metal alloys have larger coercive fields than iron oxides, the study of iron oxides for achieving large H c is also very important because of availability, high Curie temperature (T c = 928 K), low cost, stability, superparamagnetism, biomedical applications, and ferrofluid.Reference Ishii and Sencia1–Reference Jin, Ohkoshi and Hashimoto3, Reference Dutta, Manivannan, Seehra, Shah and Huffman6–Reference Zhou, Zhang, Gong, Zhang, Wu, Du and Wu28 Generally speaking, one way to increase H c is to decrease the size of the particles forming the single magnetic domain down to the domain size. Toward this end, the highest H c up to 2.0 T at room temperature (RT) for Ca2+/Sr2+/Ba2+-induced ε-Fe2O3 was recently reported.Reference Jin, Hashimoto and Ohkoshi2, Reference Jin, Ohkoshi and Hashimoto3 Unfortunately, the as-synthesized ε-Fe2O3 products are a rare phase and have an unstable structure.Reference Jin, Hashimoto and Ohkoshi2, Reference Jin, Ohkoshi and Hashimoto3, Reference Tronc, Chaneac and Jolivet11–Reference Sakurai, Namai, Hashimoto and Ohkoshi14
As it is well known, doping in materials with selective elements offers an effective approach to adjust their physical and chemical properties, particularly for their magnetic functions,Reference Chakrabarti, Mandal and Chaudhuri16–Reference Ianos27 which is crucial for practical applications. Since γ-Fe2O3 owns an inverse spinel with a cubic unit cell where iron (III) cations are distributed over tetrahedral A and octahedral B positions according to the formula FeA(Fe5/3V1/3)BO4,Reference Sakurai, Namai, Hashimoto and Ohkoshi14–Reference Zhu and Li20 doping γ-Fe2O3Reference Chakrabarti, Mandal and Chaudhuri16–Reference Tripathy, Adeyeye, Boothroyd and Shannigrahi21 was found to influence cation vacancy ordering strongly in iron (III) cations, which has a significant impact on the magnetic parameters, such as saturation magnetization and coercivity.Reference Chakrabarti, Mandal and Chaudhuri16–Reference Tripathy, Adeyeye, Boothroyd and Shannigrahi21 To date, however, Cu-doped γ-Fe2O3 nanostructures have not been reported, although magnetisms of Cu-doped Fe3O4 films,Reference Tripathy, Adeyeye, Boothroyd and Shannigrahi21 SmCo6.7−xCuxCr0.3 magnets,Reference Yao, Liu, Zhao and Zhang22 and the role of Cu addition in the coercivity enhancement of sintered Nd–Fe–B permanent magnetsReference Li, Ohkubo, Akiya, Kato and Hono23 were investigated. In this article, we first report the synthesis of Cu-doped γ-Fe2O3 nanowires with a larger RT H c (2.08 T) that has been the highest value reported so far for the RT maghemite nanostructures. Also, the H c value has been raised to more than five times as compared with the recent maximum coercivity field (3.3 kOe) for pure γ-Fe2O3 nanoparticles at a very low temperature (5 K) announced.Reference Kusigerski, Tadic, Spasojevic, Antic, Markovic, Boskovic and Matovic7
II. EXPERIMENTAL METHODS
The Cu-doped γ-Fe2O3 nanowires were synthesized by using a chemical vapor deposition process, using ferrous nitrate and cuprous nitrate powders as the source materials. The experimental setup is similar to our previous work.Reference Zhou, Zhang, Gong, Zhang, Wu, Du and Wu28 All the as-studied samples were grown at 200 °C, in the mix gas (H2 and Ar) and under a deposition pressure of ∼10 Torr; only the Cu content of the products was varied. In a typical experiment, a silicon substrate and a small quartz boat were first cleaned using a standard treatment in piranha solution (10% H2O2 + 20% H2SO4), and rinsed with deionized water. Fe(NO3)2·6H2O (99.9%; 18.1 g) and CuNO3 powders (99.9%; 0, 0.89, 1.26, and 1.89 g, respectively, for nominal ratios of Fe to Cu) were placed in the middle of the boat with the silicon substrate, which was inserted into a horizontal tube furnace. After a quartz boat with permanent magnet material (∼0.25 T) having been put in a quarter of the furnace (at lower temperature area), the system was quickly heated to 200 °C under 40 sccm gas flow and the ∼10 Torr pressure for 1.5 h, and then cooled to RT. Subsequently, the large-scale wool-like brown specimens were obtained in the silicon substrate.
The samples were characterized extensively for phase and chemical composition through x-ray powder diffraction (XRD) and high-resolution XRD (HRXRD). The morphologies, sizes, and microelement/structure analysis of the as-fabricated single nanowires were demonstrated using scanning electron microscopy/transmission electron microscopy (SEM/TEM), the energy dispersive x-ray spectroscopy (EDS), and selective area electron diffraction (SAED), respectively. A little of the products so obtained was ultrasonically dispersed in ethanol and a drop of this ethanol solution was deposited on a holey nickel grid (instead of copper grid because of the consideration of Cu concentration quantitative analysis) with carbon film. The temperature dependence of magnetization and the RT magnetic properties were performed by means of the Superconductor Quantum Interference Magnetometer (MPMS XL5; Quantum Design, Inc., San Diego, CA).
III. RESULTS AND DISCUSSION
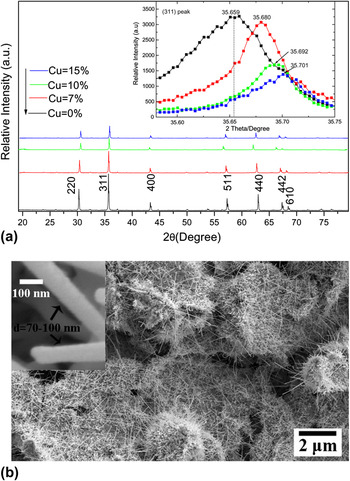
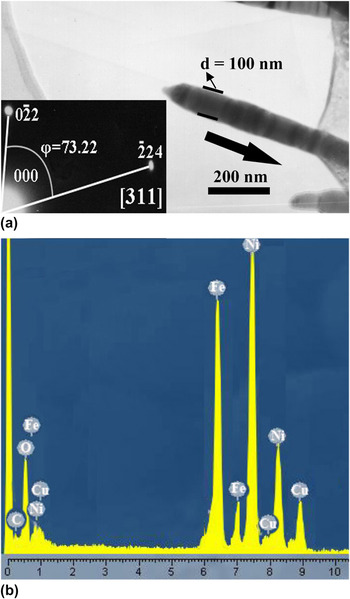
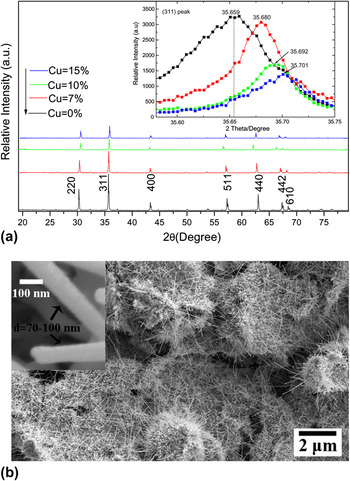
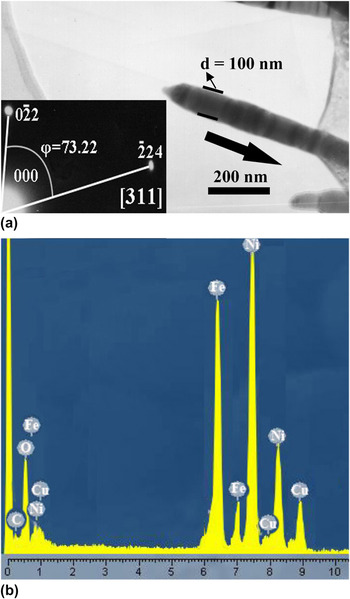
As shown in Fig. 1(a) and the upper inset, one can see four typical XRD and HRXRD patterns for the as-fabricated bulk Cu-doped γ-Fe2O3 nanowire specimens with varying Cu doping concentrations. All diffraction peaks (seven peaks) marked with the Miller indices confirm the primitive cubic phase of γ-Fe2O3 (space group P4132) (JCPDS card no. 39-1346). No impurity phases including Cu, nitrates, and other oxides (such as hematite and magnetite phaseReference Sakurai, Namai, Hashimoto and Ohkoshi14, Reference Lai, Shafi, Loos, Ulman, Lee, Vogt and Estournes15) have been detected within experimental error. As one might expect, the peaks are gradually toward a slightly high angle side with the increasing of Cu concentrations, for example, according to the (311) peak, the one peak position (35.659°) for undoped sample is observably shifted into another peak position (35.701°) (15% Cu-doped specimen) as indicated in the inset (HRXRD patterns). This result suggests that the Cu can partly substitute Fe in the inverse spinel structure of γ-Fe2O3, resulting in the formation of a monocrystalline Cu ferrite/Fe–Cu–O phase, which may be a reason for a surprising high coercivity (H c).Reference Jin, Hashimoto and Ohkoshi2, Reference Jin, Ohkoshi and Hashimoto3 This may be attributed to a small change in the lattice constant, which is caused by the larger ionic radius of the Cu atom which substitutes the Fe one.Reference Lai, Shafi, Loos, Ulman, Lee, Vogt and Estournes15–Reference Yao, Liu, Zhao and Zhang22 Additionally, it is perceived that the intensity of the all peaks decreases with increasing Cu doping content. For morphologies and sizes of our products, a typical SEM image is depicted in Fig. 1(b) where one can observe the as-made large-scale wire-like Cu-doped γ-Fe2O3 (10%) nanostructures, mostly lying on the Si substrate surfaces. The left inset figure in Fig. 1(b) is a corresponding high-resolution SEM image. On the basis of two images, the length and the diameter of the single nanowires were estimated to be several micrometers and 70–100 nm, respectively. As for further microcharacterization of the single nanowires, a representative TEM image is shown in Fig. 2(a). Lower inset in Fig. 2(a) is shown for SAED patterns of single nanowires, which can be indexed to the single crystal cubic structure and compatible with XRD results. A diameter (100 nm) and a growth direction [311] (as indicated by a large black arrow) are clearly indicated in Fig. 2(a). Quantitative composition analysis of individual nanowires [EDS, Fig. 2(b), for 10% Cu-doped sample] finds that the two kinds of atomic ratios between Fe and Cu are about 10.44:1, which are well-matched with nominal raw ingredients put in furnace.
(a) X-ray powder diffraction (XRD) patterns of undoped and Cu-doped γ-Fe2O3 [upper inset: counterpart high-resolution XRD showing shifting of the (311) peak toward the higher 2θ angle as dopant concentration increases]; (b) scanning electron microscopy (SEM) and high-resolution SEM (inset) image of 10% Cu-doped γ-Fe2O3 nanowires.
(a) Transmission electron microscopic image and (inset) selective area electron diffraction patterns; (b) dispersive x-ray spectroscopy for 10% Cu-doped γ-Fe2O3 nanowires.
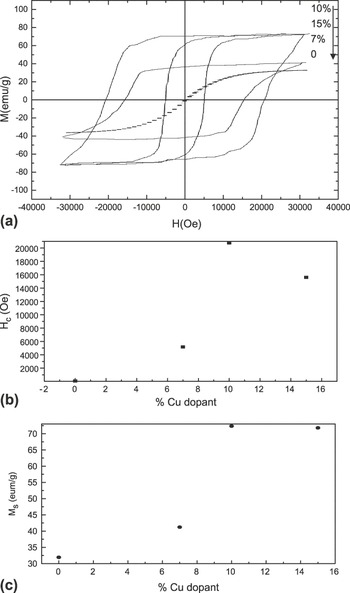
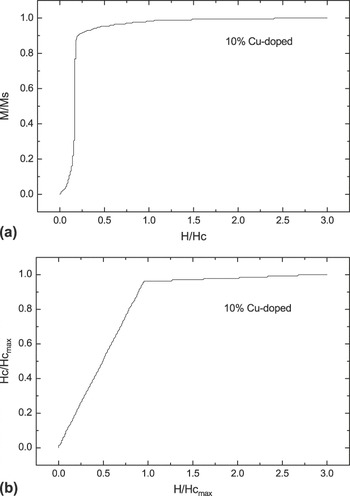
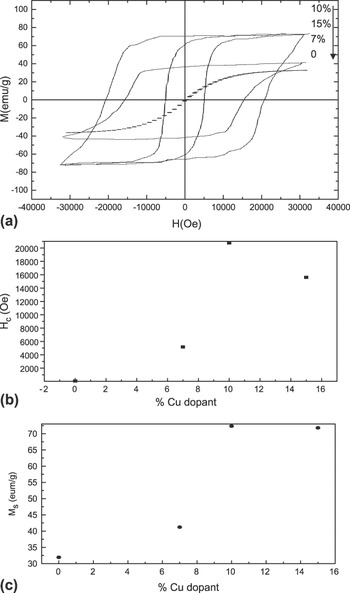
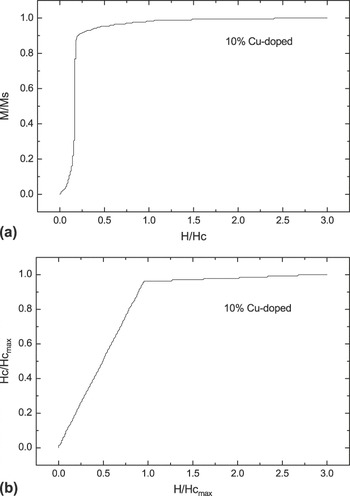
The representative RT magnetization curves (undoped, 7% Cu-doped, 10% Cu-doped, and 15% Cu-doped) are revealed in Fig. 3(a), where magnetic field is applied parallel to the plane of the products. All of the samples show clear ferromagnetic behavior and are strongly dependent on the Cu concentration. The H c and saturation magnetization (Ms) values are apparently revealed in Figs. 3(b) and 3(c), respectively. The observation of enhanced magnetic behavior depends on the presence or absence of Cu dopant. The experimental data also show the H c of the as-synthesized samples increases monotonically from 78.59 Oe and 31.92 emu/g for undoped γ-Fe2O3 samples to 2.08 T and 72.32 emu/g for 10% Cu-doped γ-Fe2O3 specimens. For the 15% Cu-doped γ-Fe2O3 sample, however, H c and Ms decrease to 1.56 T and 72.19 emu/g, respectively. This behavior may be attributed to a complex cation arrangement in the Cu-doped γ-Fe2O3, which is compatible with earlier reports.Reference Tripathy, Adeyeye, Boothroyd and Shannigrahi21, Reference Yao, Liu, Zhao and Zhang22 It has been previously suggested that Cu atom can occupy both tetrahedral and octahedral sites in the spinel structure.Reference Zhu and Li20, Reference Tripathy, Adeyeye, Boothroyd and Shannigrahi21 In particular, the magnetic hysteresis loop of the 10% Cu-doped γ-Fe2O3 indicates that this sample exhibits a surprisingly high H c value of 2.08 T at RT, which is over 264 times that of undoped samples (78.59 Oe).Reference Zhou, Zhang, Gong, Zhang, Wu, Du and Wu28 Here we investigate such larger coercivity mechanism of the as-synthesized 10% Cu-doped γ-Fe2O3 samples. Figure 4(a) shows the normalized initial magnetization curves for the nanowire bulk with 10% Cu concentrations measured at RT. A jump appears when the applied field does not reach the coercive field. This is a typical characteristic of the nucleation.Reference Lu, Song and Zhang4, Reference Tripathy, Adeyeye, Boothroyd and Shannigrahi21, Reference Yao, Liu, Zhao and Zhang22 Figure 4(b) illustrates the normalized dependence of the coercivity on the maximum applied field, determined from the maximum hysteresis loop for the nanowires with Cu = 10% measured at RT. The coercivity changes quickly and is linear at the low applied fields but increases slowly at the applied field with around the maximum coercivity. Such behaviors are also characteristics of the nucleation controlled magnets.Reference Lu, Song and Zhang4, Reference Tripathy, Adeyeye, Boothroyd and Shannigrahi21, Reference Yao, Liu, Zhao and Zhang22 In fact, however, the reason for the 10% Cu-doped sample exhibiting such a large H c value has not been clearly understood. It may be attributed to (i) the suitable nanowires with magnetic ripple structures that form a single magnetic domain because of isolated nanoscale with diameters smaller than 100 nm, for which single domain states could be expectedReference Jin, Hashimoto and Ohkoshi2, Reference Jin, Ohkoshi and Hashimoto3; (ii) the formation of the well-dispersed Cu-doped γ-Fe2O/γ-Cu-Fe-O nanostructures in which the results are agreement with XRD data.
(a) Room-temperature (RT) M–H curve for the as-synthesized undoped, 7%, 10%, and 15% Cu-doped samples; (b) changes in the coercive field; (c) saturation magnetization values with increase in Cu concentration.
(a) Normalized initial magnetization curves; (b) normalized dependence of the coercivity on the maximum applied field for the 10% Cu-doped γ-Fe2O3 nanowires at RT.
IV. CONCLUSIONS
In this study, this approach provides a simple and inexpensive method for the preparation of stable and magnetic Cu-doped γ-Fe2O3 nanowires. The as-synthesized samples with a giant value of coercivity H c (2.08 T even at RT) and enhancing saturation magnetization (Ms) may have potential applications in high-density magnetic storage, ferrofluids, biomedicine, and fundamental science. In additional, the present facile growth process (the addition of Cu ion can lead to the growth of nanowire products) is expected to be readily extendable to fabricate similar functional γ-Fe2O3 nanowires of other ferromagnetic materials with FCC structures.
ACKNOWLEDGMENTS
This work was partially supported by the Program for Science & Technology Innovation Talents in Universities of Henan Province (No. 2008 HASTIT002), Innovation Scientists and Technicians Troop Construction Projects of Henan Province (No. 094100510015), and by the Natural Science Foundation of China under Grant No. 20971036.