

Introduction
As the field of implementation science continues to experience rapid expansion, important progress has been made in the development and categorization of measures of implementation determinants, processes, and outcomes [Reference Rabin, Purcell and Naveed1–Reference Proctor, Bunger and Lengnick-Hall4]. Yet, more work is needed to elucidate the psychometric properties (e.g., dimensionality, reliability, and measurement invariance) of these instruments [Reference Weiner, Lewis and Stanick5–Reference Martinez, Lewis and Weiner7] – particularly for implementation outcomes (e.g., acceptability, appropriateness, feasibility, adoption, fidelity [Reference Proctor, Silmere and Raghavan8]) and when tools are used in new settings or languages. These instruments are arguably the most critical components of implementation science in shedding light on how, where, and for whom interventions work in practice [Reference Lewis, Fischer, Weiner, Stanick, Kim and Martinez6].
Studies have highlighted limitations in the number and quality of instruments of acceptability, appropriateness, and feasibility – three common implementation outcomes considered leading indicators of implementation success [Reference Weiner, Lewis and Stanick5, Reference Proctor, Silmere and Raghavan8, Reference Mettert, Lewis, Dorsey, Halko and Weiner9]. Acceptability is the perception that a treatment or practice is agreeable, palatable, or satisfactory. Appropriateness is the perceived fit, relevance, or compatibility of the treatment or practice. Feasibility is the extent to which the treatment or practice can be successfully used or carried out in a given agency or setting [Reference Proctor, Silmere and Raghavan8]. Systematic reviews of implementation outcome instruments in 2015 and 2020 found that the highest number of instruments addressed acceptability, followed by feasibility and then appropriateness. The reviews found limited psychometric information and quality across the outcomes [Reference Lewis, Fischer, Weiner, Stanick, Kim and Martinez6, Reference Mettert, Lewis, Dorsey, Halko and Weiner9, Reference Khadjesari, Boufkhed and Vitoratou10], which is a critical research gap. Yet, acceptability, appropriateness, and feasibility are among the most commonly assessed implementation outcomes [Reference Allen, Pilar and Walsh-Bailey11], highlighting a particular need to understand the quality of available measurement tools [Reference Donenberg, Merrill and Obiezu-Umeh12].
There is also a need for practical and contextually relevant measures of implementation outcomes for low-resource settings [Reference Rabin, Purcell and Naveed1, Reference Khadjesari, Boufkhed and Vitoratou10, Reference Donenberg, Merrill and Obiezu-Umeh12], such as in global projects addressing HIV among youth. Youth HIV prevention and care programs are critical to reduce the HIV burden, since young people are disproportionately impacted by the epidemic [13], and focusing on implementation will strengthen the success of these interventions [Reference Vorkoper, Tahlil and Sam-Agudu14]. However, validated scales from high-income settings, which often require extensive time and staff support to assess, may not be relevant or reliable in resource-constrained settings [Reference Rabin, Purcell and Naveed1, Reference Donenberg, Merrill and Obiezu-Umeh12]. Practitioners are unlikely to use psychometrically strong measures if they are not pragmatic [Reference Rabin, Purcell and Naveed1, Reference Khadjesari, Boufkhed and Vitoratou10, Reference Glasgow and Riley15].
The mental health implementation science tools (mhIST) are a set of seven implementation determinant and outcome scales with some evidence on their psychometric properties that are gaining popularity in low- and middle-income countries [Reference Aldridge, Kemp and Bass16]. These tools were developed over five years using theoretical frameworks, existing measures, expert consultations, and iterative testing [Reference Aldridge, Kemp and Bass16, Reference Haroz, Bolton and Nguyen17]. A psychometric assessment by Aldridge et al. of the Consumer and Provider mhIST compiled data from seven studies across six countries and found strong structural validity and internal consistency reliability. They also found that most scales – including those measuring acceptability, appropriateness, and feasibility– were multidimensional [Reference Aldridge, Kemp and Bass16], suggesting that they may be capturing multiple constructs and could be shortened.
The Prevention And Treatment through a Comprehensive Care Continuum for HIV-affected Adolescents in Resource Constrained Settings (PATC3H) consortium provides a valuable opportunity to deepen our understanding of the mhIST. The consortium was comprised of eight projects funded by the National Institutes of Health (NIH) to address the HIV prevention and care continuum among adolescents and young adults across seven countries [18, Reference Tucker, Iwelunmor and Abrams19]. A rigorous process was used to select items from several mhIST implementation outcome measures and harmonize the shortened measures across the consortium projects [Reference Donenberg, Merrill and Obiezu-Umeh12]. Because only two projects administered the full set of harmonized youth items, the present analyses focus on those studies. In response to Aldridge et al.’s calls to examine the mhIST’s psychometric performance in additional populations and across a broader range of reliability evidence [Reference Aldridge, Kemp and Bass16], we set out to understand the psychometric properties of the harmonized shortened versions of the acceptability, appropriateness, and feasibility mhIST measures completed by youth in two PATC3H consortium studies [Reference Aldridge, Kemp and Bass16]. Specifically, we evaluated dimensionality (i.e., factor structure), measurement invariance across independent samples, internal consistency reliability, and correlations among brief implementation measures. Given that acceptability, appropriateness, and feasibility represent related but distinct implementation constructs, they were expected to show moderate inter-correlations while maintaining sufficient differentiation. We sought to determine if shorter versions of the measures would retain good psychometric properties, filling research gaps in pragmatic implementation outcome measures suitable for resource-limited settings.
Methods
Harmonization overview and measures
At the PATC3H consortium’s launch, a Data Harmonization Working Group was developed to strengthen the science of HIV prevention and care in low- and middle-income countries by establishing common data elements across studies. Implementation science was identified as an important area for harmonization, and a sub-group was established [Reference Donenberg, Merrill and Obiezu-Umeh12]. This sub-group identified eight implementation outcomes with measures for harmonization. The three implementation outcome measures selected for youth – i.e., acceptability, appropriateness, and feasibility – drew from the mhIST Consumer tool [Reference Aldridge, Kemp and Bass16]. The sub-group chose to use the mhIST because its items go beyond general perceptions, offering insight into concrete aspects of the implementation process relevant to the implementation outcomes of interest.
Through extensive discussions involving representatives across studies, the sub-group identified items from across three mhIST scales to recommend for harmonization: 7 out of 15 acceptability items, 5 out of 13 appropriateness items, and 8 out of 15 feasibility items (for full scales, see Appendix 1). Subsets of items were recommended rather than full mhIST measures to reduce the burden of measurement administration (we refer to these as brief mhIST scales in the current study). Response options for each item were on a four-point Likert scale (“Not at all,” “A little bit,” “A moderate amount,” and “A lot,”) while also including “Don’t know” and “Not applicable” options. When querying teams near the end of the grant, we found that two of eight studies collected data on all recommended items and were thus included in analyses: IMARA-SA (Informed, Motivated, Aware, and Responsible Adolescents and Adults- South Africa) and CombinADO.
Included studies and data collection procedures
IMARA-SA
IMARA-SA is a two-day HIV/STI prevention program for adolescent girls and young women (AGYW, ages 15–19) and their female caregivers (FCs), aiming to reduce STI incidence and increase uptake of HIV testing and counseling (HTC), and pre-exposure prophylaxis (PrEP) [Reference Donenberg, Atujuna and Merrill20]. A randomized controlled trial was conducted in the Cape Town metropolitan area, recruiting AGYW-FC dyads through outreach and referrals. AGYW were eligible if aged 15–19 years and living in Phillippi Village or nearby, while FCs were 24+ years old, in close contact with the AGYW, and selected by the AGYW. Dyads were randomized to IMARA-SA or a time-matched health promotion (HP) control. IMARA-SA used interactive and joint activities addressing individual, social, and structural drivers of HIV-risk; the HP program promoted healthy living using similar methods. Participants completed baseline, 6-, and 12-month surveys, STI screening, HTC, and received a one-month PrEP prescription if eligible. MhIST measures were collected at the end of each program day via audio-computer assisted self-interview (ACASI) in English or Xhosa. Although intervention acceptability was assessed after both days of the IMARA-SA and HP workshops, appropriateness and feasibility were only assessed at the end of the second workshop since most intervention material was delivered on the second day. Thus, mhIST items analyzed drew from the end of Workshop Day 2.
CombinADO
CombinADO was a cluster-randomized controlled trial evaluating the impact of a multi-component intervention (CombinADO strategy) versus optimized standard of care (SOC) on viral suppression, ART adherence, and retention in care among adolescents and youth living with HIV (AYLHIV, aged 10–24 years) in Nampula Province, Mozambique [Reference Mogoba, Lesosky and Zerbe21]. A total of 12 health facilities participated and were randomized to either the optimized SOC arm, which included community sensitization, one-stop youth-friendly services, health worker training, information/motivation walls and tools for clinic staff or the CombinADO arm, which included all components of the SOC arm plus peer support, mental health screening and linkage, informational video, and caregiver and youth support groups. After twelve months of intervention implementation, consecutive AYLHIV seeking HIV care at the 12 study clinics were invited to complete a one-time post-intervention assessment, which included mhIST measures of acceptability, appropriateness, and feasibility. All measures were translated into Portuguese and back-translated into English by English-Portuguese study team members and administered by trained fieldworkers in private settings.
Data analytic strategy
Analyses were performed in R/R Studio (v4.2.3) [Reference Team22, Reference Team23] and Mplus 8.2 [Reference Muthén and Muthén24]. To examine the factor structure of the measures, we used a split half validation approach in which half of each sample for IMARA-SA and Combinado was used for principal factor analysis (PFA) (“sub-sample 1”) and the other half was used for confirmatory factor analysis (CFA) (“sub-sample 2.”) Because splitting the samples reduced the number of observations available for CFA (e.g., Combinado sample (n = 192)), we also estimated CFAs using the full samples for both studies as a sensitivity analysis to evaluate the robustness of findings (Supplementary Material 1).
Within sub-sample 1, we conducted a parallel analysis [Reference O’connor25] followed by PFA using varimax rotation to determine the number of factors needed to represent each implementation outcome measure for both study teams. Factor loadings above 0.30 were considered adequate. We used parallel analysis to provide an empirical estimate of the number of factors and then applied PFA with varimax rotation to examine the latent constructs underlying the implementation outcome measures.
PFAs were followed by CFAs estimated in Mplus 8.2 using maximum likelihood estimation with robust standard errors [Reference Muthén and Muthén24] within subsample 2 to test the factor structure identified in the exploratory analyses. Model fit of the CFAs was assessed using the Akaike Information Criterion (AIC), sample size-adjusted Bayesian Information Criterion (ssBIC), and model chi-square (lower values indicate better fit), as well as the comparative fit index (CFI), root mean square error of approximation (RMSEA), and standardized root mean square residual (SRMR). Values of CFI > 0.95, RMSEA≤0.05, and SRMR<0.06 indicate good model fit [Reference Hu and Bentler26]. Nested chi-square difference tests were used to assess equality constraints and examine measurement invariance across study teams.
We next tested measurement invariance of the CFAs across IMARA-SA and CombinADO to shed light on the stability and cross-validation of the factor structure across independent samples. When testing one scale across different groups, configural invariance means that the same items are associated with the same factors across groups. Metric invariance indicates that the relationship between each item and the underlying factor is equivalent across groups, reflected by imposing equal factor loadings. When a construct demonstrates metric invariance, a one-unit change in the factor has the same effect on each item across samples. Scalar invariance means that item intercepts or thresholds are equivalent, allowing for meaningful comparison of latent means. Finally, error invariance indicates that the residual variances of all items are equal across groups. In order to compare how a construct (e.g., acceptability) relates to other constructs (e.g., appropriateness, adoption, fidelity, etc.) across groups, metric invariance is necessary. At least scalar measurement invariance must exist in order to allow latent means comparisons across groups and to claim that a scale is suitable for cross-cultural comparisons [Reference Stevanovic, Jafari and Knez27].
Cronbach’s alpha coefficients were calculated to examine internal consistency reliability of the implementation outcome measures for each study team. We used the following common thresholds to interpret internal consistency levels from Cronbach’s alpha ranges: 0.90 and above as “excellent;” 0.8–0.89 as “good;” 0.7–0.79 as “acceptable;” 0.60–0.69 as “questionable;” 0.50–0.59 as “poor;” and 0.49 and below as “unacceptable” [Reference Hair, Black, Babin and Anderson28].
Finally, scaled scores were computed to examine associations among the implementation outcome measures. These analyses were intended to characterize the pattern of relationships among the constructs and determine whether they aligned with theoretical expectations regarding the distinct but related nature of implementation outcomes.
Results
Sample characteristics and descriptive statistics
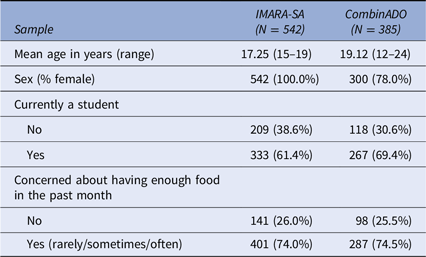
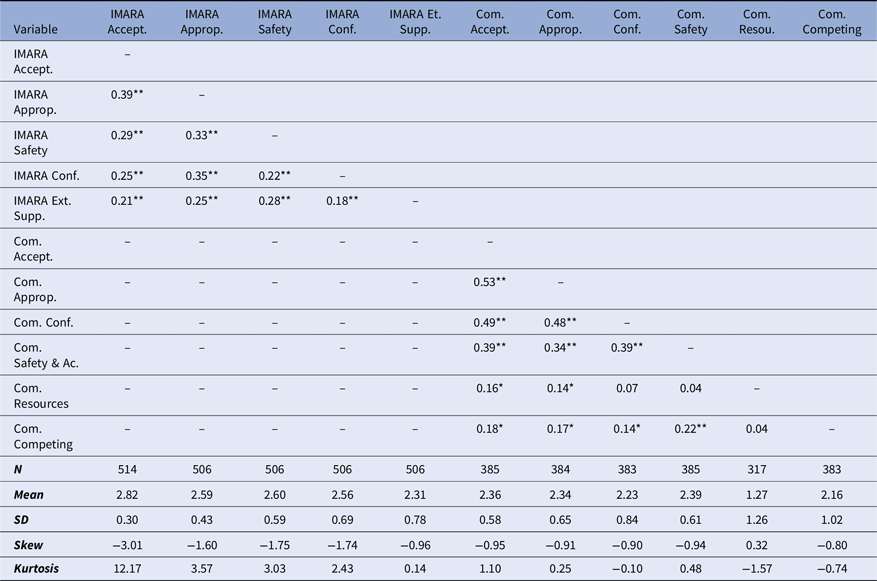
Our sample included 899 youth from IMARA-SA and CombinADO combined. Demographic characteristics are in Table 1. Means, standard deviations, skewness, and kurtosis of all computed scales are in Table 2. Means were higher in IMARA-SA than CombinADO across all measures. Skewness and kurtosis values fell outside of the acceptable range for acceptability in IMARA-SA. Taken together, IMARA-SA participants had the tendency to endorse items more positively, which may have limited variability in response distributions.
Demographic characteristics of participants

Table 1. Long description
The table compares demographic characteristics of participants from IMARA-SA and CombinADO. It has 6 rows and 3 columns. The columns are labeled Sample, IMARA-SA (N = 542), and CombinADO (N = 385). The rows are labeled Mean age (range), Sex (% female), Currently a student, and Concerned about having enough food in the past month. Row 1: Mean age (range), IMARA-SA (N = 542), 17.25 (15-19); CombinADO (N = 385), 19.12 (12-24). Row 2: Sex (% female), IMARA-SA (N = 542), 542 (100.0 percent); CombinADO (N = 385), 300 (78.0 percent). Row 3: Currently a student, IMARA-SA (N = 542), No, 209 (38.6 percent); Yes, 333 (61.4 percent). Row 4: Currently a student, CombinADO (N = 385), No, 118 (30.6 percent); Yes, 267 (69.4 percent). Row 5: Concerned about having enough food in the past month, IMARA-SA (N = 542), No, 141 (26.0 percent); Yes (rarely/sometimes/often), 401 (74.0 percent). Row 6: Concerned about having enough food in the past month, CombinADO (N = 385), No, 98 (25.5 percent); Yes (rarely/sometimes/often), 287 (74.5 percent).
Notes: IMARA-SA demographic characteristics represent youth who completed Workshop Day 2 (N = 542). Psychometric analyses were completed with available data (N = 514). Surveys measuring acceptability, appropriateness, and feasibility were completed anonymously, thus the closest approximation of sample characteristics includes youth who completed Workshop Day 2.
Bivariate correlations and descriptive statistics for implementation outcome measure scaled scores

Table 2. Long description
The table presents bivariate correlations and descriptive statistics for implementation measure scaled scores. It includes 12 rows and 12 columns. The rows are labeled with variables such as IMARA Accept., IMARA Approp., IMARA Safety, IMARA Conf., IMARA Et. Supp., Com. Accept., Com. Approp., Com. Conf., Com. Safety, Com. Resour., and Com. Competing. The columns are labeled with the same variables. The table shows correlation coefficients between these variables, with some values marked with asterisks indicating significance levels. Below the correlation matrix, there are rows for N, Mean, SD, Skew, and Kurtosis, providing descriptive statistics for each variable. Notable trends include higher means in IMARA-SA than CombinADO across all measures and skewness and kurtosis values falling outside the acceptable range for IMARA-SA.
Notes: * = p < .05. ** = p < .001. Accept = Acceptability, Approp = Appropriateness, Conf = Confidentiality, Ext Supp = External Support, Com = CombinADO, Feas = Feasibility, Ac = Access, SD = standard deviation, Competing is short for Competing Responsibilities. The second factor (Confidentiality) for feasibility in CombinADO was comprised of only one item (item 10); therefore, a scaled score was not computed and the raw data from this item wereused.
Factor analysis
Acceptability
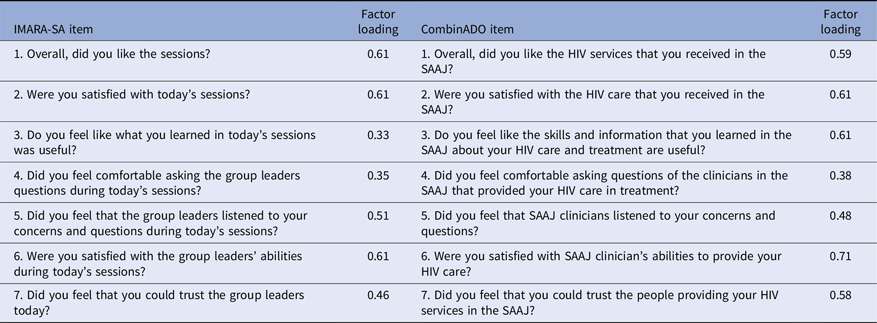
Parallel analysis of the seven mhIST acceptability items suggested a one factor solution for sub-sample 1 of IMARA-SA and a two-factor solution for sub-sample 2 of CombinADO. However, the two-factor solution in CombinADO had cross-loadings for item 6 (0.55 on factor 1 and 0.39 on factor 2). We explored this further by estimating a PFA with a one-factor solution in CombinADO. The model yielded strong factor loadings (range = 0.43–0.71). The one factor solution in IMARA-SA likewise estimated without errors and yielded moderate to strong factor loadings (range = 0.33–0.68). In summary, results from PFA supported a one factor model on 7 items from the mhIST’s acceptability measure across IMARA-SA and CombinADO.
Regarding the single factor measurement models, the CFA for IMARA-SA sub-sample 2 provided an excellent fit to the data (χ2 = 13.61(14), p = 0.48, CFI = 1.00, RMSEA = 0.00, 90% CI [0.00, 0.06], SRMR = 0.04). The initial single factor measurement model for CombinADO sub-sample 2 did not provide an acceptable fit to the data (χ2 = 60.74(14), p < 0.001, CFI = 0.77, RMSEA = 0.13, 90% CI [0.10, 0.16], SRMR = 0.09) and modification indices suggested freeing one residual correlation. Freeing this correlation led to a significant improvement in model fit (χ2 = 32.06(1), p < .001) and the final single factor measurement model provided excellent fit (χ2 = 17.51(13), p = 0.18, CFI = 0.98, RMSEA = 0.04, 90% CI [0.00, 0.09], SRMR = 0.04).
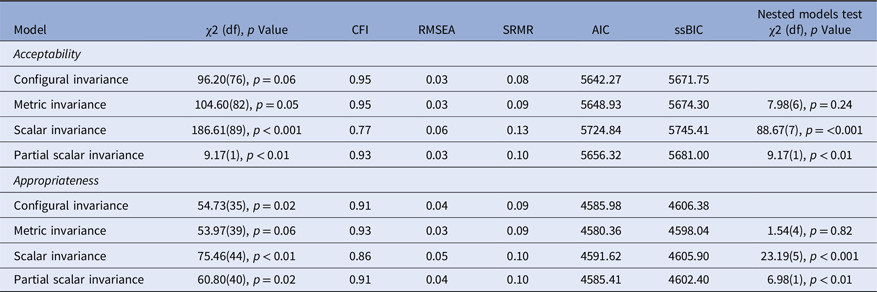
When testing measurement invariance, the configural confirmatory factor model with two factors (i.e., one factor for each study team) for the seven-item measure fit the data well. A nested model test supported equivalence of the factor loadings across study teams. Constraining all indicator intercept variances to be equal across study teams led to a significant decrement in model fit. Partial scalar invariance was not supported. The final model (imposing metric invariance) provided a good fit to the data. Factor loadings for the acceptability measure CFA are reported in Table 3. All fit statistics and results from nested model tests for measurement invariance testing are reported in Table 4. Taken together, results supported a consistent one factor structure of seven items from the acceptability measure across IMARA-SA and CombinADO.
Standardized factor loadings for the acceptability confirmatory factor model imposing metric invariance across IMARA-SA and CombinADO sub-samples 2

Table 3. Long description
A table comparing factor loadings for IMARA-SA and CombinADO items. The table has two columns for factor loadings and seven rows for different items. Column headers are IMARA-SA item, Factor loading, CombinADO item, and Factor loading. Row 1: Overall, did you like the sessions?, 0.61, Overall, did you like the HIV services that you received in the SAAJ?, 0.59. Row 2: Were you satisfied with today’s sessions?, 0.61, Were you satisfied with the HIV care that you received in the SAAJ?, 0.61. Row 3: Do you feel like what you learned in today’s sessions was useful?, 0.33, Do you feel like the skills and information that you learned in the SAAJ about your HIV care and treatment are useful?, 0.61. Row 4: Did you feel comfortable asking the group leaders questions during today’s sessions?, 0.35, Did you feel comfortable asking questions of the clinicians in the SAAJ that provided your HIV care in treatment?, 0.38. Row 5: Did you feel that the group leaders listened to your concerns and questions during today’s sessions?, 0.51, Did you feel that SAAJ clinicians listened to your concerns and questions?, 0.48. Row 6: Were you satisfied with the group leaders’ abilities during today’s sessions?, 0.61, Were you satisfied with SAAJ clinician’s abilities to provide your HIV care?, 0.71. Row 7: Did you feel that you could trust the group leaders today?, 0.46, Did you feel that you could trust the people providing your HIV services in the SAAJ?, 0.58.
Notes: SAAJ = Serviços Amigos dos Adolescentes e Jovens, the Adolescent and Youth Friendly Services clinic for CombinADO. All factor loadings were significant at p < .0001. Exact item content administered in IMARA-SA on top and exact item content administered in CombinADO on bottom within each row.
Fit statistics for factor models testing measurement invariance

Table 4. Long description
The table presents fit statistics for factor models testing measurement invariance, divided into two main sections: Acceptability and Appropriateness. Each section includes rows for Configural invariance, Metric invariance, Scalar invariance, and Partial scalar invariance. The columns include Model, χ2 (df), p Value, CFI, RMSEA, SRMR, AIC, ssBIC, and Nested models test χ2 (df), p Value. For Acceptability, Configural invariance has χ2 (df) of 96.20(76), p Value of 0.06, CFI of 0.95, RMSEA of 0.03, SRMR of 0.08, AIC of 5642.27, ssBIC of 5671.75, and Nested models test χ2 (df) of 7.98(6), p Value of 0.24. Metric invariance has χ2 (df) of 104.60(82), p Value of 0.05, CFI of 0.95, RMSEA of 0.03, SRMR of 0.09, AIC of 5648.93, ssBIC of 5674.30, and Nested models test χ2 (df) of 88.67(7), p Value of <0.001. Scalar invariance has χ2 (df) of 186.61(89), p Value of <0.001, CFI of 0.77, RMSEA of 0.06, SRMR of 0.13, AIC of 5724.84, ssBIC of 5745.41, and Nested models test χ2 (df) of 9.17(1), p Value of <0.01. Partial scalar invariance has χ2 (df) of 9.17(1), p Value of <0.01, CFI of 0.93, RMSEA of 0.03, SRMR of 0.10, AIC of 5656.32, ssBIC of 5681.00, and Nested models test χ2 (df) of 9.17(1), p Value of <0.01. For Appropriateness, Configural invariance has χ2 (df) of 54.73(35), p Value of 0.02, CFI of 0.91, RMSEA of 0.04, SRMR of 0.09, AIC of 4585.98, ssBIC of 4606.38, and Nested models test χ2 (df) of 1.54(4), p Value of 0.82. Metric invariance has χ2 (df) of 53.97(39), p Value of 0.06, CFI of 0.93, RMSEA of 0.03, SRMR of 0.09, AIC of 4580.36, ssBIC of 4598.04, and Nested models test χ2 (df) of 23.19(5), p Value of <0.001. Scalar invariance has χ2 (df) of 75.46(44), p Value of <0.01, CFI of 0.86, RMSEA of 0.05, SRMR of 0.10, AIC of 4591.62, ssBIC of 4605.90, and Nested models test χ2 (df) of 6.98(1), p Value of <0.01. Partial scalar invariance has χ2 (df) of 60.80(40), p Value of 0.02, CFI of 0.91, RMSEA of 0.04, SRMR of 0.10, AIC of 4585.41, ssBIC of 4602.40, and Nested models test χ2 (df) of 6.98(1), p Value of <0.01.
Notes: CFI = comparative fit index, TLI = Tucker-Lewis index, RMSEA = root mean square error approximation, SRMR = standardizedroot mean square residual, AIC = Akaike Information Criterion, ssBIC = sample size-adjusted Bayesian information Criterion. The test for partial scalar invariance depicts a test in which we allowed all equality constraints on the intercepts to be free with the exception of the smallest one, as suggested by modification indices. Imposing only this one equality constraint continued to lead to a significant decrement in model fit across both the acceptability and appropriateness models. Therefore, partial scalar invariance was not supported.
Appropriateness
Parallel analysis of the five appropriateness items suggested a one factor solution for both sub-samples 1 across study teams. This one factor solution yielded strong factor loadings (range = 0.39–0.74) in CombinADO and in IMARA-SA (range = 0.44–0.59), with one exception for item 6 (0.20).
Regarding the single factor measurement models, the CFA for IMARA-SA sub-sample 2 provided an excellent fit to the data (χ2 = 3.28(5), p = 0.66, CFI = 1.00, RMSEA = 0.00, 90% CI [0.00, 0.07], SRMR = 0.02). The initial single factor measurement model for CombinADO sub-sample 2 provided an acceptable fit to the data (χ2 = 8.80(5), p = 0.12, CFI = 0.97, RMSEA = 0.06, 90% CI [0.00, 0.13], SRMR = 0.04).
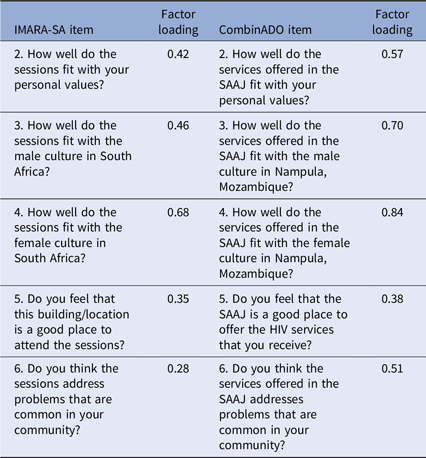
When testing measurement invariance, the configural confirmatory two factor model (one factor for each study team) for the five-item measure provided an acceptable fit to the data (Table 4). A nested model test supported equivalence of the factor loadings across study teams. Constraining all indicator intercept variances to be equal across study teams led to a significant decrement in model fit. Partial scalar invariance was not supported. The final model (imposing metric invariance) provided an acceptable fit to the data. Factor loadings for the appropriateness measure CFA are reported in Table 5. In summary, results supported a consistent one factor structure of five items from the appropriateness measure across IMARA-SA and CombinADO sub-samples 2.
Standardized factor loadings for the appropriateness confirmatory factor model imposing metric invariance across IMARA-SA and CombinADO

Table 5. Long description
A table comparing factor loadings for IMARA-SA and CombinADO items across five questions. The table has two columns for factor loadings, one for IMARA-SA and one for CombinADO, and five rows for different questions. Row 1: IMARA-SA item 2, Factor loading 0.42, CombinADO item 2, Factor loading 0.57. Row 2: IMARA-SA item 3, Factor loading 0.46, CombinADO item 3, Factor loading 0.70. Row 3: IMARA-SA item 4, Factor loading 0.68, CombinADO item 4, Factor loading 0.84. Row 4: IMARA-SA item 5, Factor loading 0.35, CombinADO item 5, Factor loading 0.38. Row 5: IMARA-SA item 6, Factor loading 0.28, CombinADO item 6, Factor loading 0.51.
Notes: SAAJ = Serviços Amigos dos Adolescentes e Jovens, the Adolescent and Youth Friendly Services clinic. All factor loadings were significant at p < .0001. Exact item content administered in IMARA-SA on top and exact item content administered in CombinADO on bottom within each row.
Feasibility
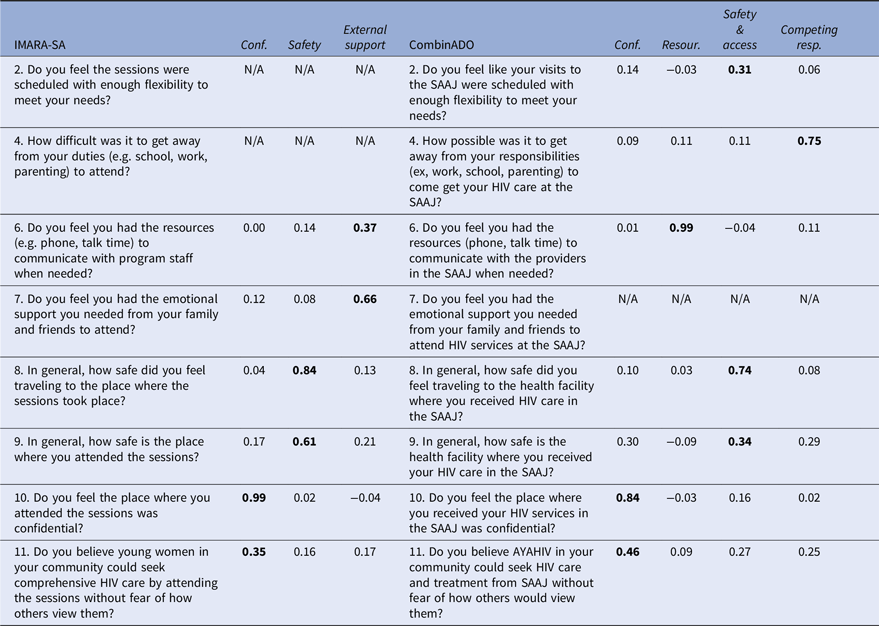
Results from parallel analysis for the eight mhIST feasibility items were inconsistent across studies. For CombinADO sub-sample 2, parallel analysis initially suggested a four-factor solution. Upon examination of the standardized factor loadings, item 7 had weak loadings across all four factors (all loadings < 0.30). Thus, we removed this item and re-ran parallel analysis on the remaining seven items. Results suggested a four-factor solution. The primary factor was represented by items 10 and 11. Item 6 uniquely loaded onto the secondary factor, representing resources. Items 2, 8, and 9 all had moderate to strong loadings on the third factor, representing safety and access. Finally, item 4 uniquely loaded onto the fourth factor, representing competing responsibilities. For IMARA-SA sub-sample 1, parallel analysis initially suggested a three-factor solution in which the primary factor had strong loadings from items 8 (0.89) and 9 (0.61), the secondary factor had one strong loading from item 6 (0.99), and the tertiary factor had strong loadings from items 10 (0.66) and 11 (0.50). Item 7 had weak cross-loadings onto the secondary (0.25) and tertiary (0.20) factors. Items 2 and 4 did not provide moderate or strong loadings on any factor (all loadings < 0.20). Therefore, we removed these items and estimated a PFA with items 6–11. Parallel analysis indicated a three-factor solution in which the primary factor seemed to confidentiality while items assessing “safety” loaded onto the second factor and items assessing external support loaded distinctly onto the third factor (Table 6). We could not discern a pattern of loadings that was consistent across IMARA-SA and CombinADO. Therefore, we did not proceed to CFA and testing measurement invariance across groups.
Factor loadings for the feasibility exploratory factor models across IMARA-SA and Combinado sub-samples 1

Table 6. Long description
A table comparing factor loadings for feasibility exploratory factor models across IMARA-SA and CombinADO sub-samples. The table has 11 rows and 7 columns. The columns are labeled as IMARA-SA, Conf., Safety, External support, CombinADO, Conf., Resour., Safety & access, and Competing resp. The rows are labeled with questions related to the feasibility of the models. Each cell contains a numerical value representing the factor loading for the corresponding question and sub-sample. Notable trends include high loadings for items related to safety and confidentiality in both sub-samples.
Notes: SAAJ = Serviços Amigos dos Adolescentes e Jovens, the Adolescent and Youth Friendly Services clinic for CombinADO. Conf = Confidentiality, Feas = Feasibility, Resour = Resources, Resp = Responsibilities. Items 2 and 4 did not load onto any factors (all loadings < .20) in IMARA-SA and were therefore removed from exploratory factor analysis for the IMARA-SA sample. Item loadings > .30 are bolded for ease of interpretation. Exact item content administered in IMARA-SA on top and exact item content administered in CombinADO on bottom within each set of rows with the same numerical notation.
Reliability
The seven-item acceptability measure showed acceptable internal consistency for CombinADO (Cronbach’s α = 0.77) and questionable internal consistency for IMARA-SA (Cronbach’s α = 0.64). The five-item appropriateness measure showed acceptable internal consistency in the CombinADO sample (Cronbach’s α = 0.73) and poor internal consistency for IMARA-SA (Cronbach’s α = 0.53).
The five-item general feasibility factor demonstrated poor internal consistency for CombinADO (Cronbach’s α = 0.57). Internal consistency could not be computed for the second factor (confidentiality) since it comprised only one item. Internal consistency for the two-item external support factor was unacceptable (Cronbach’s α = 0.40). In IMARA-SA, internal consistency was unacceptable for the two-item external support factor (Cronbach’s α = 0.43) and poor for the two-item confidentiality factor (Cronbach’s α = 0.52). Internal consistency was questionable for the two-item safety factor (Cronbach’s α = 0.61).
Correlations among scaled scores
Correlations among all scaled scores for the factors across IMARA-SA and CombinADO are in Table 2. The second and fourth factors for feasibility in CombinADO comprised only one item each; therefore, a scaled score was not computed and the raw data from these items were used. For IMARA-SA, acceptability was moderately positively correlated with appropriateness. Acceptability and appropriateness were also positively correlated with the feasibility factors of safety, confidentiality, and external support but at smaller magnitude. Intercorrelations among the feasibility factors were all positive but small in magnitude. For CombinADO, acceptability and appropriateness were strongly positively correlated. Acceptability and appropriateness were positively related to the primary factors for feasibility, confidentiality and safety and access, and these correlations were moderate in magnitude. Correlations between acceptability and appropriateness and the remaining feasibility items assessing resources and competing responsibilities were smaller in magnitude. Confidentiality and safety were moderately positively related. The remaining intercorrelations between the feasibility factors/items were relatively weak.
Discussion
This study evaluated the psychometric properties (i.e., dimensionality, measurement invariance, and reliability) of shortened versions of three mhIST implementation outcome measures – acceptability, appropriateness, and feasibility – collected from youth in two PATC3H consortium projects. To our knowledge, this is only the second psychometric analysis of the mhIST after Aldridge et al. [Reference Aldridge, Kemp and Bass16]. Analyses of nearly 900 youth in South Africa and Mozambique revealed a seven-item measure of acceptability and a five-item measure of appropriateness, each loading onto a single factor and demonstrating metric invariance across two independent samples. Support for metric invariance of the one-factor acceptability and appropriateness measures provides strong evidence that participants interpreted the meaning of these constructs similarly across independent samples. The acceptability measure showed acceptable and borderline acceptable internal consistencies across the samples. The appropriateness measure showed acceptable internal consistency for CombinADO but poor internal consistency for IMARA-SA. The scaled scores of appropriateness and acceptability were positively correlated within the two samples, consistent with theoretical expectations. The magnitude of the correlation was somewhat stronger for CombinADO than IMARA-SA. We were unable to identify a single measure of feasibility because the factors did not hang together well and there was inconsistency in the dimensionality of the data across the two samples. Taken together, our results strengthen the evidence base for the mhIST and indicate areas for future research to refine the measure.
Our findings – particularly for the acceptability measure – contribute to the literature on short, pragmatic tools to assess implementation outcomes in resource-constrained settings, a priority for implementation science [Reference Rabin, Purcell and Naveed1, Reference Martinez, Lewis and Weiner7, Reference Khadjesari, Boufkhed and Vitoratou10, Reference Donenberg, Merrill and Obiezu-Umeh12, Reference Glasgow and Riley15]. In their psychometric assessment of the mhIST, Aldridge et al. found that the full-length acceptability, appropriateness, and feasibility scales were multidimensional [Reference Aldridge, Kemp and Bass16]. In contrast, our findings provide preliminary evidence that shortened measures of these measures was well-represented by a unidimensional structure. Further, the pattern of inter-correlations between our implementation outcome measures suggested that acceptability and appropriateness are related constructs while remaining empirically distinguishable from the feasibility domains identified in the factor analyses. Acceptability and appropriateness demonstrated generally moderate positive associations with each other and somewhat weaker associations with feasibility-related factors, suggesting that these implementation outcomes are related and also conceptually distinct.
A notable benefit of the brief measures is the practical insights they provide: each item addresses a distinct facet of the respective implementation outcome, enhancing their usefulness. These features may help address limitations of the Acceptability of Intervention Measure (AIM), Intervention Appropriateness Measure (IAM), and Feasibility of Intervention Measure (FIM) [Reference Weiner, Lewis and Stanick5], which are increasingly used, including in LMICs [Reference Gresh, Mambulasa and Ngutwa29,Reference Zanoni, Archary and Sibaya30]; while the brevity of these tools is a strength, their items are worded similarly and may not capture the nuance or breadth of each outcome. Another benefit of the acceptability and appropriateness measures is their pragmatism. Prior work has emphasized the importance of minimizing respondent burden, particularly when assessing multiple implementation outcomes concurrently [Reference Khadjesari, Boufkhed and Vitoratou10]. The shortened mhIST measures may be particularly well-suited for under-resources settings, offering a feasible alternative to the original 13-item acceptability and 15-item appropriateness scales [Reference Lewis, Fischer, Weiner, Stanick, Kim and Martinez6].
While we found a consistent one-factor structure and metric invariance across samples for the appropriateness measure, reliability differed for IMARA-SA and CombinADO. One possibility is that the scale was too short to reliably capture appropriateness. A greater number of items may improve internal consistency reliability by more fully representing the construct domain and increasing shared variance among items, ultimately yielding a more stable and precise assessment. Alternatively, the especially poor reliability observed in IMARA-SA may reflect a unique response style for South African AGYW. Indeed, IMARA-SA participants tended to respond more positively across all measures, thereby reducing variability in response distributions (i.e., resulting in a restricted range). Measurement invariance analyses support this interpretation: while metric invariance was achieved, scalar invariance was not, suggesting participants interpreted the constructs consistently across projects but endorsed different items – potentially due to bias, response style, or cultural differences [Reference Stevanovic, Jafari and Knez27]. Indeed, given that scalar invariance was not supported, latent means cannot be compared across these two groups and more research is needed to explore whether this scale is suitable for cross-cultural comparisons. Given that only six appropriateness measures were identified in a recent systematic review of existing implementation outcome measures (which was the fewest number of measures across eight implementation outcomes explored) [Reference Mettert, Lewis, Dorsey, Halko and Weiner9], our findings contribute valuable evidence for a brief, pragmatic, and generalizable measure of appropriateness. However, due to the unique characteristics of one of our samples, future work must be done to replicate our results and further explore the reliability of this shortened appropriateness measure.
Results from our exploratory factor analysis failed to yield a consistent factor structure for the brief feasibility measure across independent samples. Additionally, the pattern of relatively weak inter-correlations of the feasibility factors produced from this factor analysis across both samples suggests limited coherence among the dimensions identified in the exploratory factor analyses and further underscores challenges in representing feasibility as a single underlying construct using the brief measure. Several possible explanations may account for the failure to find a consistent factor structure of the feasibility measure in the current study. First, it may be that our brief scale contained too few items to adequately represent the underlying construct of feasibility and support stable factor estimation. It would be useful for future research aiming to develop a brief feasibility measure from mhIST to administer the full 15-item scale and further investigate item dimensionality. Aldridge et al. found a two-factor structure for the full feasibility scale [Reference Aldridge, Kemp and Bass16], suggesting the items may reflect separate dimensions with some demonstrating better reliability and validity than others. Second, it may be that feasibility reflects a more multidimensional or formative construct in comparison to a reflective construct. While we used a reflective approach to conceptualize this construct, consistent with past research in this area [Reference Weiner, Lewis and Stanick5, Reference Aldridge, Kemp and Bass16], it may be fruitful for future studies to explore formative models, especially when measuring feasibility. Finally, the mhIST creators also note that individual items may serve as meaningful indicators of implementation outcomes even where they do not load onto a factor [Reference Aldridge, Kemp and Bass16]. Where the goal is to identify specific feasibility barriers, use of individual items might therefore be appropriate. For example, the item “How safe did you feel traveling to the place where the sessions took place?” can provide useful context about location-related feasibility. Taken together, future investigators may wish to either administer the full mhIST feasibility scale or selectively use individual items to capture context-specific feasibility constraints.
Limitations of our study must be recognized. Despite a large sample size, data drew from only two countries in Southern Africa, limiting generalizability. Data were derived from two HIV-related studies – one focused on prevention and one focused on treatment – and thus the samples may have differed with respect to HIV status and related experiences. Recall bias may be a limitation given the differing recall periods: IMARA-SA participants were exposed to the intervention right before completing implementation measures, whereas CombinADO participants could have been exposed at any point(s) during 12 months of implementation prior to completing the measures. Additionally, IMARA-SA participants demonstrated a tendency toward positively skewed responses, resulting in modest skewness, kurtosis, and restricted range. This response pattern may have contributed to the lack of scalar invariance observed for the acceptability and appropriateness factors across samples, although other sources of between-sample differences cannot be ruled out; accordingly, future research using independent samples is needed to further evaluate this factor structure and its measurement invariance. Furthermore, to reduce measurement burden, the full mhIST scales were not collected in the IMARA-SA and Combinado studies. Thus, we were unable to compare the brief measures to the full-length mhIST versions to determine if the complete scales might yield different psychometric values in these populations.
Finally, evidence regarding validity was limited to correlations among a relatively narrow set of implementation outcomes. Although the observed pattern of correlations was generally consistent with theoretical expectations regarding relationships among implementation outcomes, our study did not include additional measures that would allow us to provide a formal test of convergent, discriminant and predictive validity. Future work should evaluate these brief measures within a broader nomological network by examining associations with other implementation outcomes (e.g., AIM, IAM, and FIM), and downstream outcomes (e.g., adoption, effectiveness, sustainability).
Conclusions
Our findings provide preliminary support for brief, unidimensional mhIST measures of acceptability and appropriateness with consistent one-factor structures across two independent youth samples in South Africa and Mozambique. These one-factor structures for acceptability and appropriateness demonstrated metric, but not scalar, measurement invariance, indicating that the items relate to the underlying construct similarly across groups, but the samples demonstrated systematic differences in response styles. Additionally, differences in the reliability of the appropriateness measure across samples and our inability to identify a consistent factor structure for the brief feasibility measure provide areas for future research. Together, our findings help fill notable gaps in the literature on the psychometric properties of implementation outcomes instruments that can be practically used in under-resourced settings.
Supplementary material
The supplementary material for this article can be found at https://doi.org/10.1017/cts.2026.10842.
Acknowledgments
We wish to thank the study participants from the IMARA-SA and CombinADO studies for contributing to this study. We thank all IMARA-SA staff and the Desmond Tutu HIV Centre as well as all CombinADO study sites and staff working in the Serviços Amigos dos Adolescentes e Jovens for their central roles in making these studies possible. We also thank the Center for Dissemination and Implementation Science at the University of Illinois Chicago (CDIS-UIC) for its support with carrying out this study. Clinical trial registration numbers for these studies are NCT04758390 (IMARA-SA) and NCT04930367 (CombinADO). Support in logistical and operational coordination, regulatory infrastructure, and monitoring of non-registrational trials, data systems infrastructure and website administration was provided by Westat Inc.; Contract #75N94023D00001 Task Order #3 75N94023F00003. ChatCPT (OpenAI) was used to support clarity of wording in certain parts of the manuscript. The authors reviewed and approved all content.
Author contributions
Katherine G. Merrill: Conceptualization, Data curation, Methodology, Visualization, Writing – original draft, Writing – review & editing; Katie Paige: Conceptualization, Data curation, Formal analysis, Methodology, Visualization, Writing – original draft, Writing – review & editing; Kristin M. Beima-Sofie: Conceptualization, Methodology, Visualization, Writing – review & editing; Lisa R. Hirschhorn: Conceptualization, Methodology, Visualization, Writing – review & editing; Erin Emerson: Conceptualization, Data curation, Visualization, Writing – review & editing; Allison Zerbe: Data curation, Visualization, Writing – original draft, Writing – review & editing; Amanda Fournier: Data curation, Writing – review & editing; Chisom Obiezu-Umeh: Methodology, Writing – review & editing; Ucheoma Nwaozuru: Methodology, Writing – review & editing; Geri Donenberg: Conceptualization, Funding acquisition, Methodology, Visualization, Writing – review & editing.
Funding statement
Research reported in this publication was supported by the Eunice Kennedy Shriver National Institute of Child Health and Human Development of the National Institutes of Health under grant number(s) UH3HD096875 (IMARA-SA), UH3HD096926 (CombinADO), UH3HD096906 (DISC), UH3HD096920 (ICARE), and UH3HD096929 (ITEST). The content is solely the responsibility of the authors and does not necessarily represent the official views of the NIH.
Competing interests
The authors declare that they have no conflicts of interests.


 Open access

