Introduction: recession, austerity and welfare reform in the UK
From 2008 to 2012 the UK economy experienced a mixture of negative growth and two recessions, with periods of modest economic growth or occasional contraction in between (see BBC, 2013). The global financial crisis and subsequent national fiscal tightening are seen to have emerged from a period of a debt-fuelled economy as a result of rising living costs and stagnating wages (Harvey, Reference Harvey2011). The complex, non-transparent mortgage-based securities which funded booming property markets in some countries were part of a so-called ‘New Financial Architecture’ which involved perverse incentives and excessive risk taking in the financial sector (Crotty, Reference Crotty2009).
At the same time, the UK was deemed to have a structural deficit in its public finances, to which a response was announced by the Coalition Government in its 2010 Comprehensive Spending Review (CSR), and which has been described as a mixture of random cuts and strategic measures (Niemietz, Reference Niemietz2011) over the period 2010–11 to 2014–15, with a third of the reductions in public spending coming from the welfare budget (Elliott and Wintour, Reference Elliott and Wintour2010).
The move to reduce welfare expenditure includes steps to incentivise people into employment through sanctions and rewards within the benefits system, and comes against the backcloth of declining public sympathy for welfare spending and welfare recipients. There is a view that generous benefits are a deterrent to employment seeking (Clery, Reference Clery, Park, Clery, Curtice, Phillips and Utting2012), and research has also reported that the social stigma attached to benefit claiming in the UK is now quite common, supported by media coverage which focusses on a lack of reciprocity and effort on the part of claimants (Baumberg et al., Reference Baumberg, Bell, Gaffney, Deacon, Hood and Sage2012, Briant et al., Reference Briant, Watson and Philo2013), although the most recent British Social Attitudes survey provided some evidence to suggest this trend is being reversed (Pearce and Taylor, Reference Pearce, Taylor, Park, Bryson, Clery, Curtice and Phillips2013). There is also a high level of public support for the idea of a benefit cap; this being one of the main reforms to limit the total of benefits paid to any one household (Marshall, Reference Marshall2013).
In this article, we are interested in the possibility that as a result of the effects of the economic downturn on employment and earnings, austerity measures in relation to public services, reductions in household incomes due to welfare reforms and a pejorative public discourse, low-income households may feel under increasing financial and other pressures with consequences for the mental health and wellbeing of low-income householders and communities.
Household impacts of welfare reforms
There has been much analysis of the impacts of the proposed reforms and the measures contained in the Welfare Reform Act 2012. The effects of the reforms have been studied from three perspectives: Will the reforms, taken together, reduce public spending? Do the reforms increase work incentives as intended? What are the impacts upon household incomes and poverty?
It is the third of these questions which is relevant here. Studies have identified four broad groups of people as being most adversely affected. Families of different types are affected in different ways. Lone parents are said to lose out in the long run from the reforms and the introduction of universal credit (Brewer et al., Reference Brewer, Browne and Wenchao2011). Families with children will see a larger drop in their incomes than other groups, with lower income families losing the most (Jenkins et al., Reference Jenkins, Brandolini, Micklewright and Nolan2011, cited in Nuffield Trust, 2012; CPAG, 2012). Those in work part time and on low incomes are another group particularly affected by reforms, which put lower limits on various payments and reduced entitlements in order to encourage people towards full-time work. Those in particular housing circumstances will also be impacted. There are expected to be housing affordability problems for large families due to the benefits cap. The other major concern is that a combination of changes to housing benefit regulations, including changes to housing benefit rates, non-dependent charge up-rating and the under-occupancy charge, will make many parts of the country unaffordable for lower income groups, forcing households to search for cheaper or smaller accommodation elsewhere, which may impact mental health and wellbeing (Shelter, 2011). Lastly, one of the main concerns has been the cumulative impact of benefit cuts on disabled people, plus reductions in several services upon which they rely (White, Reference White2013). The effects of the various reforms are said to include isolation and deterioration in the mental health of disabled people and an increased burden and loss of income for their carers (Wood, Reference Wood2012). The devolved administrations, in areas with high dependency on out-of-work benefits, are particularly concerned about the loss of income to those receiving sickness and disability benefits (Scottish Parliament, 2013; Welsh Government, 2013).
The effects of recession, austerity and welfare reforms on deprived areas
Deprived areas may be particularly affected by the economic downturn, austerity measures and welfare reforms. First, people in deprived areas are often in the most vulnerable employment circumstances and thus most likely to suffer from the employment effects of the recession (for example, fewer working hours, lower wages, lay-offs), with consequently less income in the local economy as a result.
Second, the effects of cuts to local services may be felt particularly by low-income groups and those in deprived areas who depend on a large number of public services yet have less ability than others to replace public services with other arrangements. Research has suggested there could be a cascading impact, with cuts to services being greatest (in absolute and relative terms) in the most deprived authorities (Hastings et al., Reference Hastings, Bailey, Besemer, Bramley, Gannon and Watkins2013). Within authorities the cumulative effects of service reductions would be most acute in deprived neighbourhoods least able to cope with less support (Hastings et al., Reference Hastings, Bramley, Bailey and Watkins2012). Very few authorities were planning to protect services to deprived neighbourhoods as a priority (ibid.).
Third, research has confirmed that the most deprived authorities in Britain will also be hit hardest by welfare reforms (Beatty and Fothergill, Reference Beatty and Fothergill2013), representing a significant loss of income to local economies, with consequent effects upon local business, services and communities which would be far less able to support and assist their own members where most local people face these kinds of income losses. Within Scotland, Glasgow (where our research is conducted) will face the biggest loss of welfare income under the reforms, largely due to changes to incapacity benefits for the long-term sick of working-age (Welfare Reform Committee, 2013).
The double-whammy? Poor people in poor areas
Having less to spend and facing rising costs puts pressures on households, but the experience of that pressure and the ability to cope might also be influenced by the presence of other factors that can make life even more difficult for people in deprived areas. According to recent research into the effects of the recession on deprived communities in Scotland, this can include the withdrawal of local services and amenities, having neighbours who are also in financial difficulty and less able or inclined to help and who collectively have less money to spend locally, and seeing the regeneration process slow down and the environment deteriorate so that feelings of decline, abandonment, helplessness and uncertainty are exacerbated (Milne and Rankine, Reference Milne and Rankine2013).
On the other hand, studies of social norm effects have found that the negative effects of experiences such as unemployment on psychological health, and of bankruptcy on social stigma, are reduced where the local unemployment rate is higher and where the reference group bankruptcy rate is higher respectively (Fay et al., Reference Fay, Hurst and White2002; Clark, Reference Clark2003). Thus, it might be that the effects of affordability problems on mental health for people in deprived areas are lessened by the fact that neighbours also have problems. But this depends upon the impacts of financial problems being partly a product of shame or stigma rather than due to material deprivation and the psychological pressure to meet household needs out of the available budget, which we examine here through use of financial difficulty measures, rather than unemployment or bankruptcy.
The health impacts of the economic crisis
Based on past recessions, the Institute of Health Equity (IHE) predicts that the current economic downturn will lead to a widening of health inequalities by socioeconomic group and area, including ‘an increase in mental health problems, including depression, and possibly lower levels of wellbeing’ (UCL IHE, 2012: 7). Evidence from the current recession includes a rise in suicides of nearly a fifth in Greece (Kentkelenis et al., Reference Kentikelenis, Karanikolos, Papanicolas, Basu, McKee and Stuckler2011), a rise in suicides attributed to unemployment, particularly among men, in England (Barr et al., Reference Barr, Taylor-Robinson, Scott-Samuel, McKee and Stuckler2012) and a near doubling of mental disorders in Spain (Gili et al., Reference Gili, Roca, Basu, McKee and Stuckler2012). In Iceland, Gudmunstdottir (Reference Gudmundsdottir2013) found that while income and unemployment did not affect happiness, financial difficulties did.
Recently, health researchers have also declared that ‘Policy decisions about how to respond to economic crises have pronounced and unintended effects on public health’, and complained that ‘public health voices have been largely absent from the debate about how to respond’ (Karanikolos et al., Reference Karanikolos, Mladovsky, Cylus, Thomson, Basu, Stuckler, Mackenbach and McKee2013: 1329). This followed research which showed ‘the additional threats to mental health [from] unemployment, loss of income, and growing household debt . . . can be mitigated by social welfare and family support programmes’ (Karanikolos et al., Reference Karanikolos, Mladovsky, Cylus, Thomson, Basu, Stuckler, Mackenbach and McKee2013: 1327; see also, Stuckler et al., Reference Stuckler, Basu, Suhrcke, Coutts and McKee2009, Reference Stuckler, Basu and McKee2010; Wahlbeck and McDaid, Reference Wahlbeck and McDaid2012). This highlights the importance of studying the combined impacts of the economic downturn, austerity, and welfare reform upon the lives and wellbeing of low-income households and deprived communities, the worst of which may be yet to come due to welfare reforms.
Studying the effects of financial difficulty in deprived communities
As we have seen, there is reason to be concerned at this time about the wellbeing of those who live in the most deprived communities in the UK, who will face increased financial pressures from a number of directions at once. Past evidence suggests that such financial pressures will be reflected in increased psychological health problems (Bridges and Disney, Reference Bridges and Disney2010; Gathergood, Reference Gathergood2012), perhaps even more so when household budgeting difficulties coincide with cut-backs in public services upon which low-income groups depend.
Public health researchers have decried the lack of research into the health impacts of the economic downturn and austerity, with what little evidence there is coming from other European countries and covering the first year or two of the recession, looking at the consequences of unemployment and large debts (rather than financial or budgeting difficulties more generally) and focussing mostly on mortality and suicide. Thus, we wished to use a longitudinal data-set that spans the pre-recession period and three years of the economic downturn to examine the changing incidence of financial difficulty and its association with mental health and wellbeing among households living in deprived communities in the UK, and to present a baseline of financial difficulty before the full effect of austerity measures are realised.
Research aims and objectives
The aim of this research was to examine changing patterns of financial difficulty and mental health and wellbeing among at-risk groups in deprived communities, from the pre-recession into the recession period. The research questions we sought to answer were:
1. How prevalent within the study communities are those groups at risk from the negative effects of the economic downturn and welfare reform? Has the presence of different groups changed over time?
2. How prevalent are affordability difficulties within the study communities, and has this changed over time? How do affordability difficulties vary between different at-risk groups?
3. Are differences in the experience of financial difficulties associated with differences in mental health and wellbeing? Are changes in financial difficulty over time associated with changes in mental health and wellbeing?
Study communities and data source
Our analysis is based on three waves of a household survey conducted across fifteen communities in Glasgow. All of the communities lie within the 15 per cent most deprived in Scotland (Walsh, Reference Walsh2008). The survey has a repeat cross-sectional design with a nested longitudinal cohort (Egan et al., Reference Egan, Kearns and Mason2010), and was conducted in 2006 (W1), 2008 (W2) and 2011 (W3). A stratified random sample of domestic addresses was used in Waves 1 and 2. The Wave 3 sample frame then compiled all addresses visited at Wave 1 and Wave 2, including both previous and new occupants. In six areas where extensive demolition was taking place, all occupied dwellings were selected for interview at each wave. The surveys achieved response rates of 50.3 per cent (n = 6,003), 47.5 per cent (n = 4,869) and 45.4 per cent (n = 4,270) respectively. We exclude non-British citizens (mainly asylum seekers and refugees). Given that their welfare entitlements are different to other citizens, they are not likely to be affected in the same way by austerity and also because we found differences in how this group had answered questions related to financial difficulty, possibly due to not having direct responsibility for housing costs. Therefore, the effective sample size for cross-sectional analyses in this paper are: 2006: n = 5,082; 2008: n = 3,922; 2011: n = 3,340. Cross-sectional analyses are weighted by age, sex, tenure and study area for the appropriate study communities and survey year. Retrospective matching of names and addresses was used to identify the longitudinal cases embedded in the surveys where we had interviewed the same householder on more than one occasion. Through this data linkage three longitudinal samples were defined, for separate analyses, as follows: Waves 1–2: 840; Waves 2–3: 1,021; Waves 1–3: 936. This data source gave us a good basis to assess the presence of groups at risk from recession and austerity, and their experience of financial difficulty and changing mental health during the financial crisis, for deprived communities in Glasgow.
Identifying at-risk groups
Although it is expected that the effects of austerity measures and public service cuts will be experienced across the population, it is likely that certain groups will be more at risk, due to specific targeted reforms. We have identified groups most at risk for two reasons. Firstly, as a baseline for examining how those falling into at-risk groups experience forthcoming benefit and service changes, and, secondly, to understand how those most likely to be affected by welfare reforms and austerity are already experiencing financial difficulty relative to the wider population. We reviewed recent commentaries on the impacts of the economic downturn and welfare reforms in order to decide which groups might be most at risk from specific welfare reforms and which would be identifiable within our data. We identified sixteen at-risk groups divided into three broad categories: housing groups, household groups and employment groups. The groups are not mutually exclusive since groups are of interest with respect to different reform issues. We have taken a broad view of the household rather than focussing solely on the head of household or survey respondent given that many of the reforms affect household budgets and because we cannot be sure how household finances are structured.
Measures of financial difficulty
To assess their level of financial difficulty, respondents were asked ‘How often do you find it difficult to meet the cost of the following things?: rent or mortgage; repairs, maintenance or factor chargesFootnote 1 for the home; gas, electricity or other fuel bills; food; council tax; clothes and shoes’ (Wave 3 only). Response categories were: very often, quite often, occasionally, never − there are some inconsistencies, particularly in the case of housing costs items (rent/mortgage, repairs and council tax) as to whether responses were coded as ‘never’ or ‘not applicable/don't know/missing’ and so we have combined these responses for all items to ensure consistency between items and over time in our estimates of affordability difficulty. However, this means our estimates may be low for these items. For some analyses, we derive a binary measure of those who do and those who do not report affordability difficulty for each item. We examine each of these items as separate variables and do not seek to represent an underlying level of financial difficulty.
Measures of mental health and wellbeing
We examine the relationship between financial difficulty and two measures of mental health and wellbeing.
1 Self-reported, long-term mental health problems. Respondents were asked if they had a problem of stress, anxiety or depression lasting twelve months or more, excluding temporary conditions. At Wave 1, this question was worded slightly differently, referring to ‘a psychological or emotional condition’ lasting twelve months or more, which resulted in low levels of reported mental health, perhaps due to stigma in reporting psychological conditions Therefore, the wording was changed from Wave 2 in order to incorporate a broader range of mental health issues. Although this inevitably resulted in greater levels of reported mental health problems, we still include data from all waves here as we are exploring relationships between affordability and mental health, rather than reporting the prevalence of mental health problems per se.
2 SF-12 Mental Health. At all waves, the short-form general health questionnaire (SF-12v2) was administered to respondents. The form asks about physical and mental health problems over the past four weeks. From the answers to the twelve questions, a mental health score is computed ranging from 0 to 100, with higher scores indicating better mental health (Ware et al., Reference Ware, Koninski, Turner-Bowker and Gandek2005).
Analyses
We begin by analysing the prevalence of each of the at-risk groups at each survey wave noting any trends over time in the presence of each group in the cross-sectional samples. Although our interpretation of results is based mainly on observations of the frequencies in Table 1, we estimated a simple binary logistic regression model for the prevalence of each at-risk group, using the survey wave as an explanatory variable in order to test the change over time.
Identification and prevalence of at-risk groups

Notes: Weighted by age group, sex, tenure and study area.
* and ** indicates wave is significant predictor of being in at-risk group (baseline = Wave 1) based on a series of binary logistic regression where being in a group or not is the outcome variable and the wave is a predictor. Significant results indicate that the prevalence is significantly different at that wave to other waves *(p < 0.01), **(p < 0.05).
We then look at the aggregate patterns of reported frequency of affordability difficulty for each of the six expenditure items at each of the three time periods, also in the cross-sectional samples. For each item we used an ordinal regression model to examine the effect of the survey wave on the frequency of affordability difficulty. The three longitudinal samples are also used to examine changes in reported affordability on a case-by-case basis: changes in response for each of the five items are classified as either no change (ties), increased affordability difficulty (negative ranks) or decreased difficulty (positive ranks), and tested using Wilcoxon signed rank tests. The cross-sectional analysis is then disaggregated at each survey wave, for each expenditure item, by the sixteen at-risk groups, comparing reported affordability difficulties for the group in question with the sample as a whole. Analysis of affordability among at-risk groups is based on observation of the frequencies and is not tested statistically.
We investigate the relationship between financial difficulty and mental wellbeing firstly by testing prevalence of reported mental health problems between those who do and do not report affordability difficulties for each expenditure item at each survey wave, using chi-square statistics. The second longitudinal sample (2008–11, with consistent wording of the mental health question) is then used to estimate self reported mental health at Wave 3, controlling for a mental health problem at Wave 2 using a binary logistic regression model for each item of affordability difficulty. Explanatory variables are derived according to a three-fold classification of changes in affordability problems by item: increased difficulty, no change, decreased difficulty.
Turning to the mental health scale, we report independent t-test results for the difference in the SF-12 score between those who do and do not report affordability difficulties for each item, at each wave. In order to see if there is a relationship between mental health and cumulative financial problems, we also compute the mean and 95 per cent confidence intervals of the SF-12 mental health score for respondents with different numbers of affordability difficulties and report Pearson's correlation. This analysis is repeated for each of the cross-sectional samples to see if the relationship pattern is stable over time.
We then use the three longitudinal samples to examine changes in mean SF-12 scores according to changes in reported affordability difficulties for each expenditure item. This amounts to fifteen tests of the relationship between changing financial problems and changing mental health scores. As with the previous longitudinal analysis, we divide respondents, for each item, into three affordability change groups, reporting the mean and 95 per cent confidence intervals of the SF-12 score for each change. We carry out further descriptive examination of affordability dynamics by looking at all nine possible movements between three affordability difficulty categories (never, occasional and frequent, i.e. ‘very often’ or ‘quite often’), for each expenditure item, and their associations with the mean change in SF-12 scores, again in each of the three longitudinal samples.
Results
Results are presented in three sections, addressing each of our research questions.
At-risk groups
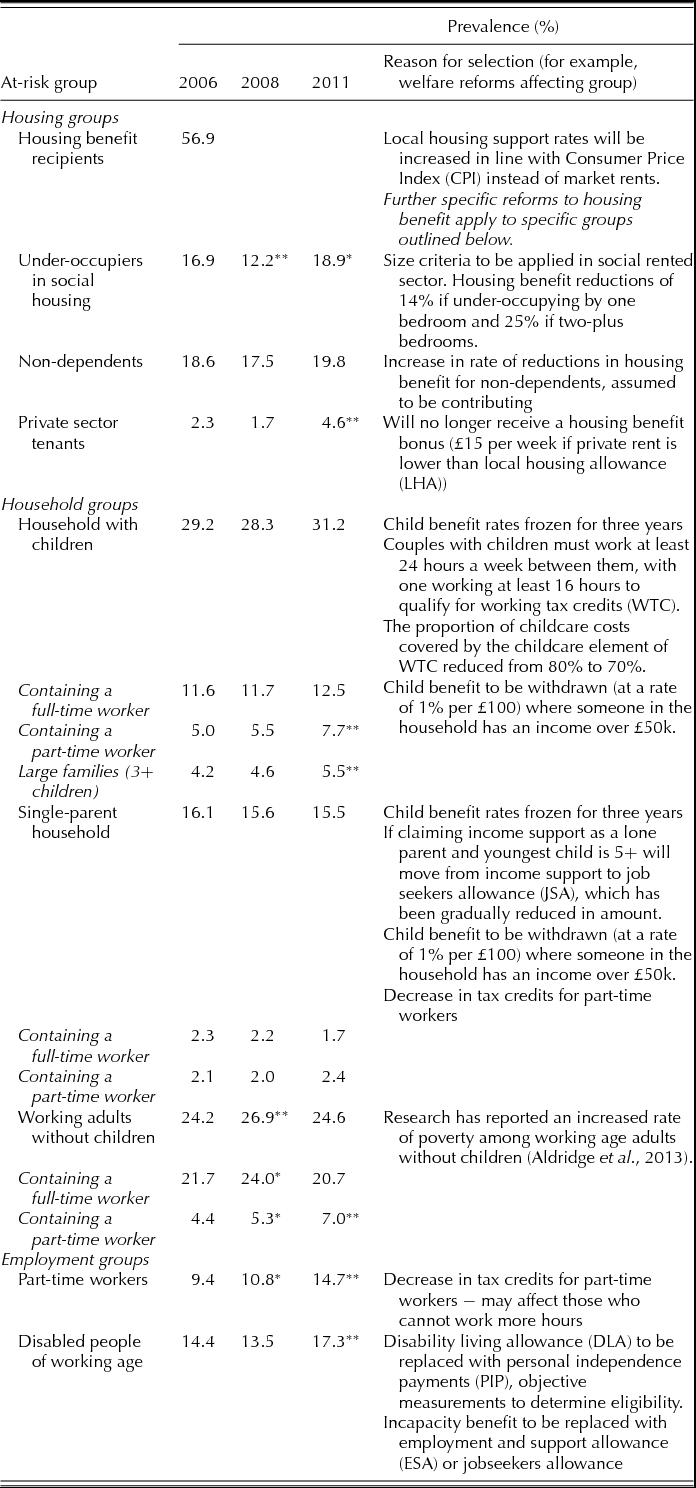
We identified at-risk groups across three broad categories, based on the types of welfare reform affecting them. Housing groups are affected by changes to Housing Benefit regulations. Household groups, defined by their structure, are affected mostly by changes to financial support arrangements for children and by tax credits for working households. Employment groups are affected either by tax credit changes or by reforms to disability benefits to encourage employment. The reasons for including the group, as well as their prevalence in each survey wave, are shown in Table 1.
Those in receipt of housing benefit form by far the largest at-risk group within the study communities, although these data are only available for Wave 1 (57 per cent). Within this, all three groups at risk from particular housing benefit reforms have been increasing over time. Both households with non-dependent adults and those under-occupying, based on national guidelines, represent almost a fifth of the sample at Wave 3. National Housing Federation statistics suggest that 14,448 households in Glasgow will be affected by the under-occupancy charge (this comprises 5 per cent of all households and 14 per cent of those in social housing).Footnote 2 Although the actual figures affected will be lower as not all of those at risk will be in receipt of housing benefit, our estimate for 2011 is higher than this, with 631 respondents estimated to be ‘under-occupants’, under the age of sixty-five and in social housing, comprising 19 per cent of the whole sample (including 5 per cent under-occupying by two or more bedrooms), and 27 per cent of all those in social housing. At Wave 1, 66 per cent of those we identified as being at risk of the under-occupancy charge were in receipt of housing benefit. Applying this rate to the 2011 data would mean that 12.4 per cent of all households and 18 per cent of socially rented households in our study areas will be affected by the charge. However, this can only be taken as indicative, given that we do not know whether respondents receive housing benefit after Wave 1.
The proportion of households with eligible non-dependents has fluctuated over time, but approached 20 per cent by 2011, possibly because financial difficulties during the recession have made it more difficult for young adults to leave home. Those in private rented accommodation constitute a small but growing proportion of the sample, comprising a significantly higher proportion, at 4.6 per cent, in 2011. This mirrors a recent trend in the city, accelerated since 2008 (Freeke, Reference Freeke2012), possibly reflecting an increased transfer of owner occupied housing to private renting during the downturn in the housing market.
Families with children form the largest at-risk household group, comprising around a third of the sample at each wave. A large proportion of family households do not contain anyone working and they are thus unlikely to be affected by changes to in-work benefits and tax credit arrangements. They will, however, be affected by the freezing of child benefit and, in the case of single parents, by the shift from income support to job seekers allowance.
Amongst the employment groups, there has been a significant and consistent rise in the presence of households with part-time workers, from 9.4 per cent in 2006 to 14.7 per cent in 2011, and this rise is echoed in sub-groups of part-time workers both with and without children. One effect of the recession therefore appears to be a rise in part-time working among low-income households, and in the case of single parents in particular this seems to be outweighed by a reduction in full-time working. Since the recession in 2008, there has also been a significant increase in the number of households in the sample which contain a disabled person of working age, from 13.5 per cent in 2008 to 17.3 per cent in 2011. This may reflect either a rise in ill health or a tendency during a recession for people in weak labour market positions to define themselves as long-term sick or disabled.
Affordability difficulties
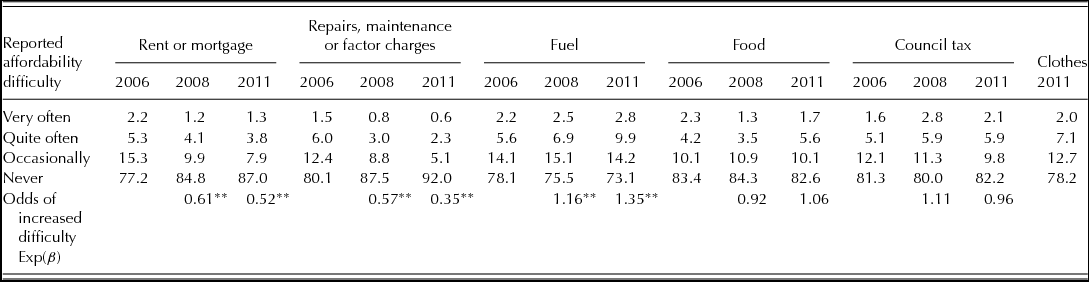
In this section, we present descriptive statistics for the six items of financial difficulty and then examine these over time and among groups. Table 2 shows the cross-sectional pattern of responses to financial difficulty measures at each of the three waves. Observation of the descriptive data indicates that the proportion of respondents who say they experience some level of affordability difficulty for an item has generally remained static or fallen over time.
Percentage of sample reporting affordability difficulties by item at each survey wave
Notes: Weighted by age group, sex, tenure and study area.
**Indicates the frequency of affordability difficulty is significantly different (p < 0.05) to other waves (baseline = Wave 1) based on ordinal regression for each item of where reported affordability difficulty is the outcome and wave is the predictor. Co-efficient above 0 indicates more likely to report more frequent difficulty at particular wave; co-efficient below 0 less frequent difficulty.
It can be seen that for all three housing-related items (rent/mortgage, repairs and council tax) respondents at Wave 2 and Wave 3 were less likely to report an increased level of difficulty, compared with Wave 1 (odds below 1). In the case of fuel affordability, the odds of reporting a higher frequency of difficulty are greater at Wave 2 and Wave 3. The picture is less clear for food affordability. It is important to note that over 60 per cent of the survey respondents never reported experiencing any difficulty with any of the six items at all three waves.
Fuel bills are the exception, with affordability difficulties steadily rising over time to reach 27 per cent of households in 2011. Moreover, this rise has been in the group experiencing frequent (quite often or very often) difficulties. Clothes are the only other item where over a fifth of respondents reported affordability difficulties in 2011, perhaps indicating the pressures upon discretionary budget items during the recession. Housing costs appear more affordable for these population groups over time, so that by 2011 less than one in ten people had difficulty paying for repair and maintenance costs and one in eight had difficulty paying their rent or mortgage.
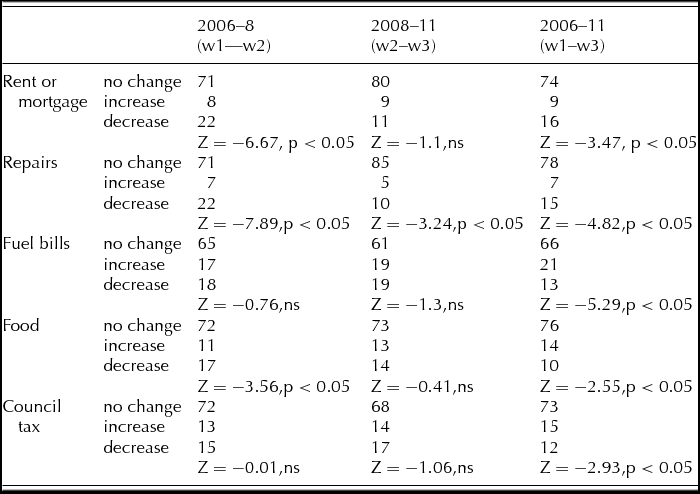
Given the high levels of indebtedness among low-income households (Bryan et al., Reference Bryan, Taylor and Veliziotis2010), it is perhaps surprising that such a high proportion of respondents report never experiencing affordability difficulties. However, it is likely that those in the most financial difficulty may not be directly responsible for rent (if they are in receipt of housing benefit) or repairs (if they are in social housing) and may receive council tax relief. This could explain the low rates of difficulty. There is a higher rate of difficulty for food and fuel, although this is still lower than might be expected. However, given that these are essential household costs it would be expected that they are prioritised and therefore people may not perceive that they struggle as much as they might with more discretionary items. A recent Organisation for Economic Co-operation and Development (OECD) report (OECD, 2014) suggested 8.1 per cent (compared with 9.8 per cent pre-crisis) of the UK population reported not having enough money for food, considerably lower than the 17.4 per cent of our sample in 2011 and 16.6 per cent pre-crisis. Additionally, as outlined above we included non-response and inapplicable as never struggling due to coding inconsistencies. While this is a source of potential under-estimation, the change in rates of those reporting some difficulty should, at least, remain relative, even if the estimates themselves are low. As explained in the methods section, we used the Wilcoxon signed rank test on the matched longitudinal data to assess whether there was a significant difference between the affordability difficulties reported by respondents between the two waves. Table 3 summarises the proportion reporting change and shows the Wilcoxon signed rank test for differences in difficulty between the two time points. The descriptive longitudinal evidence (Table 3) confirms the position regarding housing costs (rent/mortgage and repairs) with more people reporting decreased affordability difficulties over time than reported an increase, in all three longitudinal samples. All but one of these changes is statistically significant. For both fuel and food, the position appears to have changed over time: between 2008 and 2011 more people reported an increase in affordability difficulties for these items than reported a decrease (different to 2006–08).
Percentage of longitudinal sample reporting change in affordability difficulty by Item and Wilcoxon signed rank tests
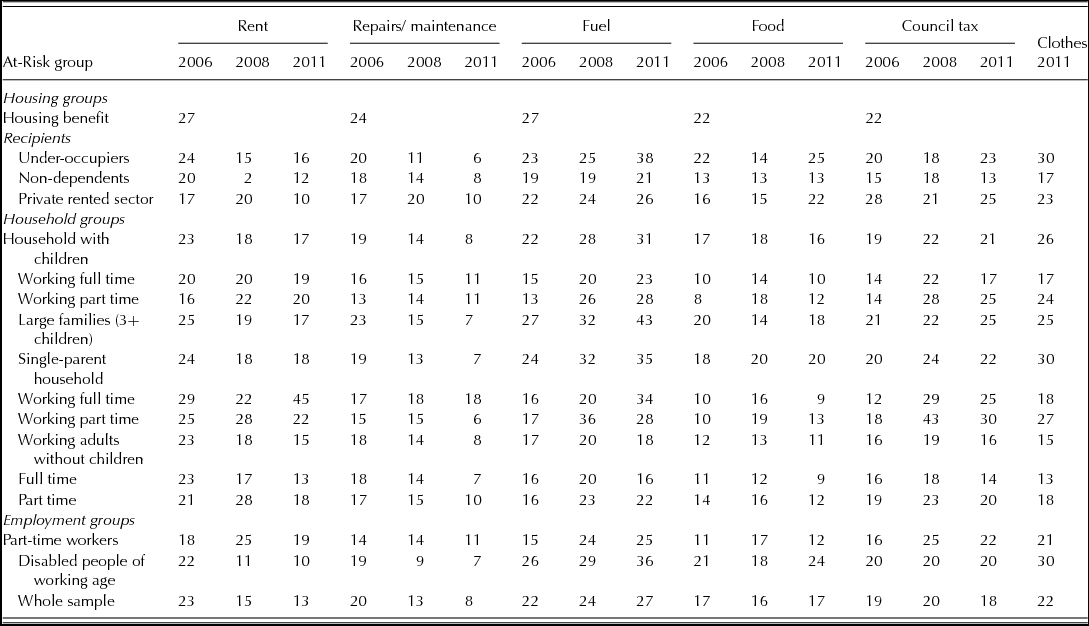
Lastly, we look at how the rates of affordability difficulty vary between at-risk groups, at change within the groups over time (Table 4) and at how the groups compare to each other in the final wave in 2011. Interpretation in this section is based on observation of the frequencies in Table 4.
Percentage of respondents reporting occasional or frequent affordability difficulties per item by at-risk group, at each survey wave
Notes: Weighted by age group, sex, tenure and study area.
Almost two in five disabled adults, under-occupiers and large families were struggling to pay for fuel in 2011, as were around a third of families, in general higher than among the sample as a whole (27 per cent). A third of disabled adults, single-parent families and under-occupiers were also having difficulty affording clothes in 2011. A third of single parents who were working part time were having difficulty paying for council tax.
Table 4 also shows a number of groups for whom affordability difficulties have got worse from 2006 to 2011 against a backdrop of decreased difficulty or no change in the sample as a whole. Families where an adult works and households with part-time workers experienced an increased rate of difficulty affording council tax. Households with disabled adults reported an increasing rate of difficulty affording food over time, whereas large families reported a declining rate of difficulty affording food. Families with adults working reported an increased rate of affordability difficulties for rent/mortgage payments.
Financial difficulty and mental wellbeing
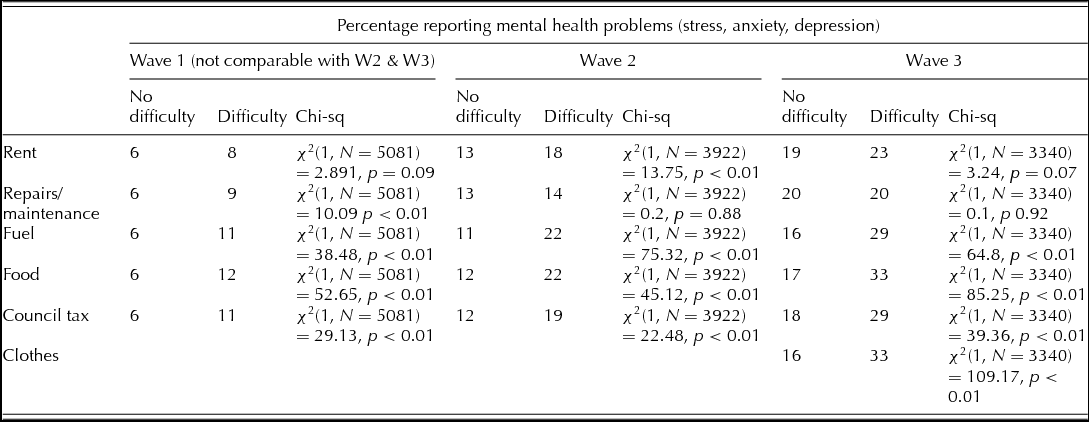
Focussing only on Wave 2 and Wave 3, observation of the cross-sectional evidence indicates that mental health problems (stress, anxiety and depression) have been increasing over time, both for those with and without affordability difficulties (Table 5).
Self-reported mental health problems and affordability difficulties by item at each survey wave
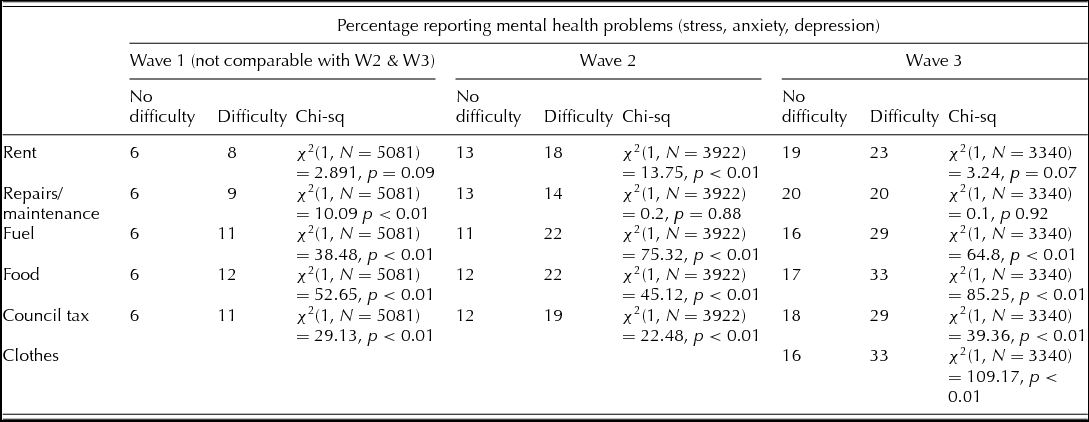
Notes: Weighted by age group, sex, tenure and study area.
Chi-square tests for differences in distribution of reported affordability difficulties for each item among those with self-reported mental health problems at each wave.
In addition to the increase overall, there is a significant difference in the rate of self-reported mental health problems among those who do and do not have financial difficulties, for food, council tax and fuel at all waves. The differences are also significant for repairs at Wave 1, rent at Wave 2 and clothes at Wave 3. Furthermore, the frequencies suggest that the gap in prevalence of mental health problems between those who do and do not report financial difficulties has been rising over time
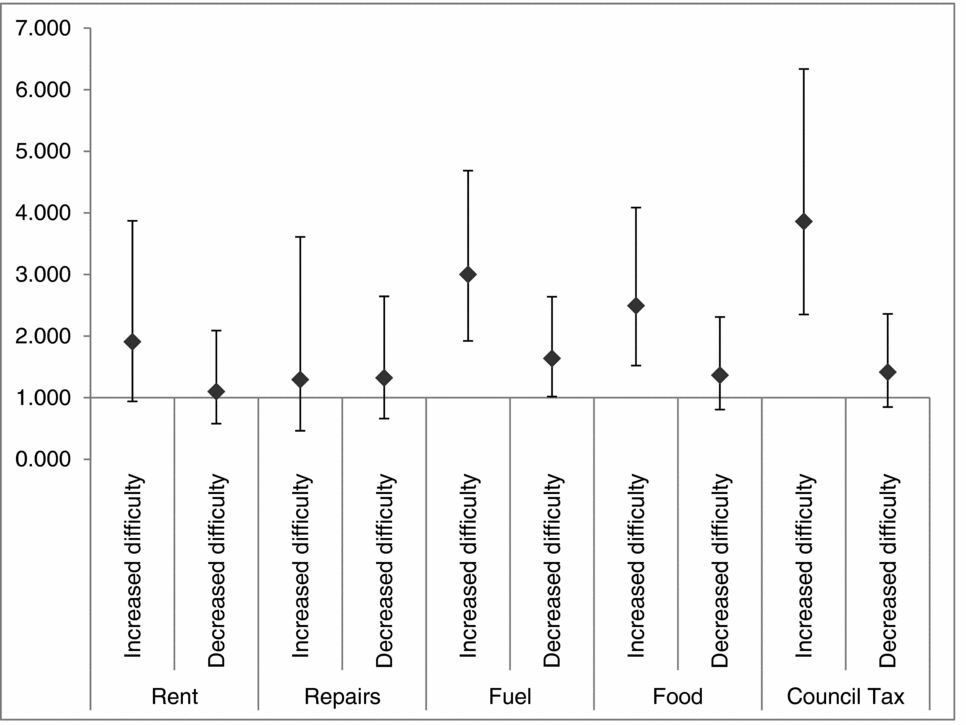
Using our 2008–11 longitudinal sample (Waves 2 and 3 only, given the change in question wording from Wave 1), Figure 1 shows the odds of reporting a mental health problem at Wave 3 by change in affordability difficulty for each item, relative to no change in affordability. For each item, those with increased affordability difficulties are more likely to report a new mental health problem than others. Where the confidence intervals do not cross 1, the odds are significant. Therefore, increased difficulty affording fuel, food and council tax are significantly associated with a mental health problem at Wave 3, controlling for an existing condition at Wave 2, compared with those who report a decreased difficulty or no change.
Odds of reporting a mental health problem at Wave 3 (controlling for mental health problems at Wave 2) by change in difficulty affording items, relative to no change (longitudinal sample)
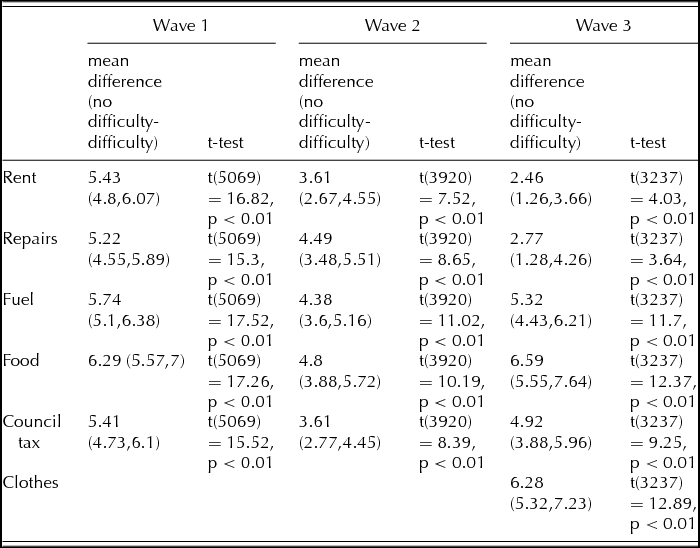
With regard to SF-12, we found significant differences (Table 6) in the mean SF-12 score between those who did and did not report financial difficulty, at all waves for all items. In many cases the mean difference is substantial when compared to the standard deviation of the SF-12 measure across our sample (sd = 10.72).
Mean difference in SF-12 for those who do and do not report difficulty affording each item at each wave
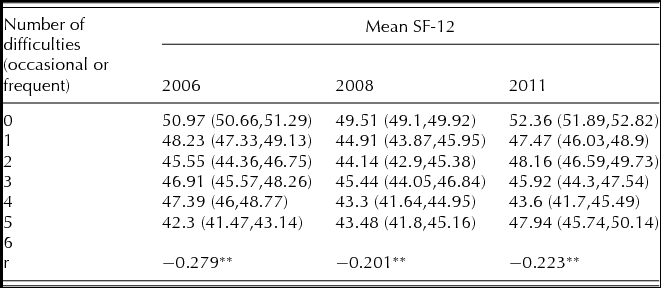
The evidence from the three survey waves is consistent in showing that mental health scores decline as the number of affordability difficulties a household faces goes up (Table 7), with the sharpest drop occurring between those reporting no difficulties and those reporting one. However, it is also worth noting that the point at which the SF-12 scores decline the most after this drops over time, from between four and five affordability difficulties at Wave 1, to between three and four difficulties at Wave 2 (not significant), to between two and three difficulties at Wave 3. This suggests that the greatest impact of multiple financial problems upon mental health occurs earlier as the economic downturn proceeds.
Mean SF-12 mental health scores by number of affordability difficulties
Note: ** p < 0.01.
There is also a clear relationship in the longitudinal samples between changes in financial difficulties and changes in SF-12 mental health scores as shown in Figure 2. Where the error bars do not cross zero we can be confident that the mean change in SF-12 is significantly different from 0 at the 95 per cent confidence level. In all cases, respondents who experienced an increase in the frequency of affordability difficulty for an item had a mean decrease in their SF-12 score. Decreased frequency of affordability difficulty is associated with an increase in the SF-12 score, significant for all items at all wave pairs. Respondents who experienced no change in frequency of affordability difficulty had a mean decrease in SF-12 between Wave 1 and Wave 2, but a mean increase at other time periods. Many of the changes in the SF-12 scores exceed half a standard deviation (sd = 10.72) for the variable, indicating that the effects of changes in affordability for mental health can be substantial.
Mean change in SF-12 mental health scores according to change in affordability difficulties (longitudinal samples)
We also examined affordability dynamics in more detail by looking at more specific changes in responses over time. This revealed that in the case of rent, fuel and council tax (the latter with one exception), those who move from never to occasional difficulties in each of the three longitudinal samples consistently reported a decline in SF12 scores, suggesting that the initial move into affordability difficulties may be detrimental to mental health more than any other dynamic (also consistent with the results in Table 7). Conversely, for every item in each of the three longitudinal samples bar one exception (i.e. in twenty-nine out of thirty instances), those who report decreased difficulty such that they move to never having affordability problems (from either occasional or frequent problems) also report an increase in mean SF12 scores. This supports the cross-sectional evidence in Table 7 and suggests that moving people out of affordability difficulties may be good for their mental health.
Limitations
Although we cannot be certain of the direction of causality, the evidence strongly indicates that financial difficulties do contribute to worse mental health, even if the reverse is also true, namely that those with worse mental health are more likely to get into financial difficulties. Moreover, other research has shown two things of relevance to issues of causality. First, that although selection effects are present, in that those with psychological problems are more likely to get into debt, they do not fully explain the relationship between debt and psychological health. Secondly, ‘self-reported data on payment difficulties are not severely affected by a perception bias’ in that a respondent's mental health may impact on their perception of problem debts and so makes the latter data unreliable (Gathergood, Reference Gathergood2012; 1104).
Our measures of change in financial difficulty are potentially imprecise due to their categorical nature, especially for longitudinal analysis where derived changes in frequency of difficulty are sensitive to small changes in categorical response. Future studies should seek to develop more robust measures of financial difficulty.
Discussion
In considering the effects of the economic downturn, austerity measures and welfare reform, we have shown the importance of looking in particular at-risk groups within deprived areas and at specific aspects of household expenditure and affordability. Whilst past studies have shown that deprived areas will lose significant amounts of aggregate income through welfare reforms (Beatty and Fothergill, Reference Beatty and Fothergill2013), and that few steps were being taken to protect services in these areas (Hastings et al., Reference Hastings, Bramley, Bailey and Watkins2012), our findings indicate that high levels of financial difficulty represent another significant problem in deprived areas, making the need for support services greater, not less.
We found that by 2011, around (and in few cases over) a third of particular household groups in deprived areas faced difficulty paying for regular expenditure items. This was most often the case for fuel, council tax and clothes/shoes, as experienced by households with disabled adults, those under-occupying their homes, families with part-time workers and private sector tenants. What is more, we also found that substantial numbers of all households in deprived areas have faced increasing affordability difficulties over the recession period 2008 to 2011: one in five households in the case of fuel bills; one in seven for council tax and for food. The results help to identify particular areas and groups where service providers could target help and guidance to people to cope with budget difficulties. For example, social housing providers and energy companies could seek to assist households with disabled adults and under-occupying households, where almost two in five face difficulties with fuel costs. There is also a need to assist the same household types, plus single-parent families, and those in the private sector, where over one in five of each group face difficulties paying for food. Relying on the expansion of charitable food banks (Blackwood, Reference Blackwood2012) without state support or organisation appears an inadequate policy response.
We have also sought to respond to the criticism that the health effects of the recession and policy responses have been insufficiently studied (Stuckler et al., Reference Stuckler, Basu, Suhrcke, Coutts and McKee2009; Karanikolos et al., Reference Karanikolos, Mladovsky, Cylus, Thomson, Basu, Stuckler, Mackenbach and McKee2013). We have shown rising mental health problems in deprived communities over the entire period (2006–11), consistent with a national increase in depressive symptoms (McManus, Reference McManus, Rutherford, Sharp and Bromley2012), although contrary to the national trend of little or no change in mental wellbeing, anxiety or suicide during the recession. We also found a consistent pattern during the recession (2008–11) whereby increased affordability difficulty for any of the items of expenditure was associated with declining mental health. This does not appear to support the idea of a social norm effect whereby the psychological impact of such difficulties is lessened in a context of similar peer group problems (Clark, Reference Clark2003), although we cannot test this robustly.
Our analysis supports the case for expanding support and welfare services to deprived communities as a mental health response (Knapp, Reference Knapp2012; Wahlbeck and McDaid Reference Wahlbeck and McDaid2012), although the prevention and eradication of affordability difficulties would be better than seeking to mitigate (Karanikolos et al., Reference Karanikolos, Mladovsky, Cylus, Thomson, Basu, Stuckler, Mackenbach and McKee2013) their effects. The case for prevention and eradication is strengthened by our analysis of affordability dynamics, where the results suggest that preventing someone from experiencing an affordability difficulty for the first time would avert the biggest associated drop in mental health, and, conversely, helping someone to remove an affordability difficulty altogether would bring the biggest associated increase in mental health.
The research indicates once again the complexity of policy interactions in deprived areas (CCRS and MTL Consultants, 2005). In this case, the combined effects of the economic downturn, austerity measures, and welfare reforms are impacting upon household budgets and psychological health in ways which may mean that many residents in deprived areas will fail to benefit from the Government's agenda to raise general wellbeing among the population (Stratton, Reference Stratton2010; Office for National Statistics, 2011). Furthermore, the adverse effects of financial difficulty upon psychological health in deprived communities may negate the potential gains to mental wellbeing that might otherwise flow from regeneration programmes in such areas (Bond et al., Reference Bond, Kearns, Mason, Tannahill, Egan and Whitley2012). This would be a potentially important unintended consequence of public policy, since enhanced mental wellbeing and feelings of empowerment are seen as key regeneration outcomes and means to enabling the sustainable transformation of people's lives in deprived areas (Beck et al., Reference Beck, Hanlon, Tannahill, Crawford, Ogilvie and Kearns2010; Kearns et al., Reference Kearns, Whitley, Bond and Tannahill2012).
Over the next few years the prospects for people living in deprived areas do not look good. The Institute of Fiscal Studies (IFS) reported that the first recession hit the incomes of middle and higher income groups the most and that lower income families fared less badly, which might concur with our finding that, typically, seven out of ten people in deprived areas experienced no change over 2006–11 in affordability difficulty for any particular expenditure item. However, the IFS also concluded that lower income groups will be hit relatively hard in the post-recession period of fiscal consolidation and welfare reform (Brewer et al., Reference Brewer, Browne, Hood, Joyce and Sibieta2013). Furthermore, the Trades Union Congress (TUC) has warned that between 2010 and 2015 families with children and with an adult working in the public sector will experience a growth in poverty due to changes to tax credits, benefit reforms and the freeze on public sector pay (TUC, 2013). Thus, the prospects for deprived communities such as those we have studied are of concern. Many of those in deprived areas will be working in the public sector and/or in receipt of housing benefit (57 per cent in our case), or other welfare benefits due to be cut: in 2011 we found almost one in five households to be under-occupying their homes or to contain non-dependent adults, two of the groups most targeted by the reforms.
However, evidence such as ours on the effects of recession, austerity and welfare reforms on affordability difficulties and the mental health consequences for people in deprived communities could support the kind of counter-narrative to the austerity hegemony that others have called for (Farnsworth and Irving, Reference Farnsworth and Irving2012). A policy aim to protect and enhance mental wellbeing for all could be allied to the concept of one nation politics, from either the right or left of the political spectrum (Wheeler, Reference Wheeler2012), to plot a different course through the economic downturn and beyond.
Acknowledgements
This research was conducted as part of the Glasgow Community Health and Wellbeing (GoWell) Research and Learning Programme (www.gowellonline.com). GoWell is a collaborative partnership between the Glasgow Centre for Population Health, the University of Glasgow and the MRC/CSO Social & Public Health Sciences Unit. GoWell is sponsored by Glasgow Housing Association (Wheatley Group), the Scottish Government, NHS Health Scotland and NHS Greater Glasgow & Clyde.