Introduction
During the Cold War, prominent American thinkers at universities and defense think tanks focused on a set of urgent questions. Could the United States and the Soviet Union ensure that nuclear weapons would never be used in a general war? Could nuclear weapons be used for more limited purposes, including diplomacy or coercion? The idea of “stability” became the cornerstone of their approach. They believed that by protecting nuclear weapons for use in retaliation (for example, by putting them on missiles in underground silos and submarines stalking the oceans), nuclear deterrence between the superpowers would be stabilized, and a cataclysmic thermonuclear war would be avoided.
The thinker who most deserves credit for the stability idea is Thomas Schelling, an economist who retooled as a nuclear strategist in the late 1950s and became one of the most influential analysts of the nuclear age. In 1958 Schelling introduced stability in a classic paper, “The Reciprocal Fear of Surprise Attack” (hereafter abbreviated as “Reciprocal Fear”), printed by the defense think tank RAND Corporation and later included as a chapter of his seminal 1960 book The Strategy of Conflict.Footnote 1 The paper described a predicament in which two adversaries, each desiring to avoid war, grow increasingly tempted to attack one another for fear of being attacked first. Stability indicated the likelihood that no such attack would occur. For Schelling, stability measured the capacity of deterrence to hold under pressure, resisting disturbances that might otherwise cause its breakdown. “Mutual deterrence is considered the more stable,” he would write in 1961, “the less susceptible it is to political and technological events, information and misinformation, accidents, alarms, and mischief, that might upset it.”Footnote 2
Schelling is perhaps best remembered as a game theorist, and nuclear strategy is often said to have been cast in game theory's mold. “The exemplary methodology for the formal strategists was provided by game theory,” writes Lawrence Freedman in his canonical history, and Schelling was “the exemplary formal strategist.”Footnote 3 For many defense intellectuals, a famous game known as the prisoner's dilemma (PD) seemed to encapsulate the superpower nuclear standoff. In the game's usual narrative, two prisoners under separate interrogation face a choice between confessing and not confessing to a crime. A light sentence results for both if the prisoners remain silent, and a harsher sentence results if they both confess; but a still harsher sentence awaits the prisoner who keeps mum while the other confesses. According to a definition of “rationality” in which strategic actors minimize their individual losses, the prisoners are obliged to confess, paradoxically producing greater collective harm than mutual cooperation, in the form of joint silence, would have yielded.Footnote 4 In the PD's nuclear rendition, the rational obligation to confess becomes the obligation to attack. Each adversary understands that its rival must strike to mitigate the risk of being struck first, so both feel compelled to strike.
As fascinating recent scholarship has demonstrated, the stark and stripped-down vision of rational behavior represented by the PD and similar games—rationality as an algorithm for private advantage—spread from military settings to numerous fields, including neoliberal economics and political theory, psychology, and evolutionary biology.Footnote 5 Schelling himself applied a rational-actor approach to a host of problems, from patterns of residential segregation to smoking addiction. His own career traces a line connecting nuclear strategy to the ascendance of rationality throughout the Cold War academy.Footnote 6
Yet something crucial is missing from this story. Of all of Schelling's nuclear ideas, perhaps none was more important than stability. The history of arms-control debates after 1960 could be told largely as a set of arguments over policies that were praised or criticized for their allegedly stabilizing or destabilizing effects. Even Albert Wohlstetter, the superhawk RAND strategist who saw in Soviet statements and actions a constant threat to launch the first strike, argued in a classic essay published soon after Schelling's “Reciprocal Fear” that the United States, through a costly and ongoing effort, could steer nuclear deterrence into a stable state.Footnote 7 The catch is that, in Schelling's formulation, the idea didn't come from game theory. After all, in a strictly PD world, nuclear war is all but inevitable. But Schelling did not think that nuclear war was inevitable. Nor did anyone who accepted the idea of strategic stability. Their claim was that deterrence could be stabilized—strengthened against dynamic pressures to attack, including crises, mishaps, and misunderstandings.Footnote 8
This essay traces stability's genealogy to a source surprisingly distant from the study of games, rationality, and strategy. Aided by an interview and correspondence I carried out with Schelling before his death in 2016, I revisit the long-forgotten intellectual context in which he was trained and formed as a thinker. In the 1940s Schelling began his career not as a game theorist but as a Keynesian macroeconomist, constructing formal models of the national economic system. In the community in which Schelling was socialized as an economist, stability was both an ideological precept and a routine modeling practice. In his early career Schelling learned and refined a set of special mathematical and graphical techniques for analyzing the stability of interactions between aggregate variables in the economic system, in particular the national income, a measure of overall economic activity and the central variable in Keynes's theory of the economy. When Schelling came to nuclear strategy more than a decade later, he conjured a model of nuclear deterrence whose structure and stability mirrored that of the Keynesian models of his youth, right down to the math.
Reading Schelling's work in the context of his training, and putting his practice under the microscope, brings into sharp focus what he actually did in 1958. It also clarifies the degree to which nuclear historiography has featured a persistent trope. The trope debuted in the 1960s when several commentators argued that game theory was an important (and nefarious) instrument in the hands of the Cold War defense intellectuals, and partly responsible, somehow, for the worsening arms race. Schelling, who did take an interest in game theory and had used simple payoff matrices in some of his work, was identified as a chief perpetrator. He was, in Irving Louis Horowitz's words, one of the “new civilian militarists” who “inhabit a world of nightmarish intellectual ‘play’,” insouciantly applying logic puzzles to matters of nuclear life and death.Footnote 9 In 2005 Schelling was awarded the Nobel Memorial Prize in Economics “for having enhanced our understanding of conflict and cooperation through game-theory analysis.”Footnote 10 The pejorative coloring had faded, but the game-theorist label had stuck.
This was a curious outcome, not least because Schelling himself repeatedly qualified or denied game theory's role in nuclear strategy and in his own work. Reviewing Anatol Rapoport's Strategy and Conscience in 1964, Schelling condensed the book's two arguments like so: “strategic thinking is bad” and “game theory is to blame.” He disagreed with the first claim and found the second especially unpersuasive: “The game-theory hypothesis was not a bad guess,” he wrote, “but a wrong one.” His judgment was unchanged four decades later: “I do not believe that any theoretical contributions to security studies has been the least dependent on ‘game theory’.” Post-Nobel, Schelling told an interviewer that the award had “surprised and somewhat perplexed” him. “The two of my publications to which the [Nobel] award committee gave the most emphasis,” he wrote in another essay, “I had published before I knew any game theory.” “I must,” he added elsewhere, “have been doing game theory without knowing it.”Footnote 11 A few scholars have endorsed Schelling's skepticism. Martin Shubik, a game-theory pioneer who reviewed The Strategy of Conflict in 1961, wrote that “although the formal structure of [game theory] could have been of considerable assistance to the type of analysis presented by Schelling, there is little evidence that it has been used.” Barry O'Neill, a leading game theorist and international-relations scholar, calls the notion that game theory shaped nuclear strategy a “myth.” “This myth has been important in the history of strategic studies,” he writes, “but game theory itself has not.”Footnote 12 Still, the trope persists.
To be clear, Schelling's “Reciprocal Fear” does employ elementary game-theory apparatus, including the payoff matrix. It describes, in the broad spirit of game theory, an interaction between two agents who strive to satisfy a maxim of individual rationality, and it begins with (but does not derive stability from) a model that is genuinely game-theoretic. In later years, Schelling's informal theory of bargaining, coordination, and focal points became extremely important for game theorists when they took up these ideas and formalized them.Footnote 13 Perhaps this is what Schelling had in mind when he described himself as “a user of (elementary) game theory,” but “not (or only somewhat) a producer.”Footnote 14 The claim here isn't that nuclear strategy and game theory had nothing to do with each other. But a certain vigilance is helpful in the company of a powerful trope. We cannot understand where strategic stability came from, or why Schelling and others found the idea so attractive, by assuming that it flowed somehow from the study of noncooperative games, or that it was embedded in a transcendent “logic.”
What I find fascinating about Schelling's nuclear model-making in the late 1950s is that he treated deterrence as a kind of system. Keynesian models were not “strategic”; they didn't involve rational calculation or individual choice. Keynesian models were about the dynamic interactions between aggregate variables like national income and consumption. To my mind, the system analogy helps to account for Schelling's profound confidence in deterrence's durability. For him, deterrence was robust not because nuclear adversaries were perfectly strategic and rational, but because their system of interaction was fundamentally stable.
Schelling was aware of other modeling traditions in economics and he drew on them in crafting his surprise-attack model. He borrowed, in particular, a key assumption from a classic market model known as the Cournot duopoly to specify how the adversaries would behave. Yet the main part of Schelling's effort—the model's dynamic adjustment, and his analysis of its stability—betrayed distinctively Keynesian roots. This makes historical sense, according to a large body of work in the field of science studies. In this literature, formal theory is an embodied, skill-laden practice, and training is an intensely formative experience. Thinkers hone skills within pedagogical communities and adapt hard-won techniques to new settings and new problems. They use the tools they know how to use, and they may not respect the smooth boundaries drawn by later convention.Footnote 15 Schelling worked on Keynesian models of national income (not the duopoly) as a young researcher. In graduate school he analyzed stability, again and again, using specifically Keynesian techniques and terminology. Those same techniques and terms resurfaced in “Reciprocal Fear”—and this is what it means to say that the origins of strategic stability are Keynesian.
The history of stability raises an old question about the relationship between ideas and nuclear weapons policy. Did strategic theory guide strategic policy during the Cold War?Footnote 16 Strategists and historians of strategy have often assumed that stability was an eminently policy-relevant idea, virtually synonymous with an invulnerable nuclear force designed for retaliatory (rather than preemptive) use: the “secure second strike.” Thus the international-security scholar Robert Jervis writes that instability results from the fact that “large arsenals do not produce security if both sides’ forces are vulnerable, in which case the world will be terribly dangerous even if no one wants to start a war.” Schelling, says Jervis, was first among analysts who crystallized the idea with “a single-shot Prisoner's Dilemma” and allied “game-theoretic formulations” of surprise attack. The historian of strategy Marc Trachtenberg writes similarly, “The stability doctrine developed in a fairly natural way out of the body of thought that had been concerned primarily with strategic vulnerability.”Footnote 17 Stability was a natural and inevitable idea, dictated by the very logic of rational nuclear deterrence; stability is an objective condition achieved when nuclear forces are structured a certain way.
This essay calls these propositions into serious doubt. Stability did not fall from the clouds of rational choice, nor was it etched into the warheads and silos. It came from Thomas Schelling, a trained Keynesian who crafted a model of deterrence suited to the techniques he knew best. When he introduced stability in 1958, he was not only a dabbler in game theory but a neophyte nuclear strategist, almost totally unfamiliar with the requirements of a secure second strike. Other strategists took his concept and applied it to basing and targeting proposals worked out years earlier, stapling the idea onto policies already decided. Foremost among stability's early adopters was Albert Wohlstetter, the most prominent strategist to argue that stable deterrence required that nuclear forces be made lastingly invulnerable to attack. Stability was not found but chosen by its thinkers: first by Schelling, who sourced it from his own intellectual biography, and then by Wohlstetter and others, who saw in stability a tidy, technical concept to rationalize their policy preferences. Nuclear thinkers fastened onto Schelling's idea even as they forgot (if they had ever known) the details of his model.Footnote 18
The essay is organized as follows. The next section provides context for Schelling's emerging view in the late 1950s that inadvertent (not deliberate) war was the central problem of nuclear deterrence. The third section reconstructs Schelling's analysis in “Reciprocal Fear” to show how he built his model of inadvertent surprise attack and analyzed its stability. The fourth explores Schelling's Keynesian practice and discusses important similarities between his Keynesian and surprise-attack models. Drawing on materials from Wohlstetter's personal archive, the fifth section shows how Schelling's stability idea was incorporated within the theory of deterrence. Finally, I revisit another of Schelling's classic ideas: “the threat that leaves something to chance,” the core of his theory of nuclear coercion. Schelling's idea of risky threats has always been interpreted as game-theoretic. With the account developed here, it will become clear that for Schelling a risky threat was more like a shock to a stable system, akin to the macroeconomic shocks he had modeled in the 1940s.
The problem of surprise attack
During the Cold War, most analysts regarded deterrence as a matter of calculation and decision. Deterrence, wrote William Kaufmann in 1954, involves “a special kind of forecast: a forecast about the costs and risks that will be run under certain conditions, and the advantages that will be gained if those conditions are avoided.”Footnote 19 Thomas Schelling saw things differently. Since the costs of a nuclear war lavishly outweighed any imagined benefits, the superpowers, he reasoned, were unlikely to choose a nuclear exchange. But they might stumble into one accidentally. The crux of the problem of superpower deterrence wasn't deliberation; it was inadvertence. To formulate this idea, Schelling began with the notion that a general war would commence with a sudden and massive nuclear strike—the so-called problem of surprise attack.
Since 1945, commentators had often described nuclear weapons as inherently suitable for surprise attacks. It was not until the mid-1950s, however, that many analysts and policymakers, including President Dwight Eisenhower, began to regard surprise as the decisive factor in an imagined World War III. In Eisenhower's “atoms for peace” speech to the United Nations in December 1953, for example, he warned that even vast nuclear superiority was “no preventive, of itself, against the fearful material damage and toll of human lives that would be inflicted by surprise aggression.”Footnote 20 “Multiply the effect of Pearl Harbor,” Eisenhower remarked in a press conference in early 1954, “which was a defeat for the United States because it was a surprise attack, and the role of surprise becomes apparent.”Footnote 21
The 1950s saw some of the first, faltering attempts to negotiate bilateral safeguards against surprise attack. For the Air Force and its brain trust, however, the more serious approach was to strengthen deterrence through early warning and credible, prompt retaliation. A group led by Albert Wohlstetter at the Air Force-funded RAND Corporation completed a series of studies on the vulnerability of US nuclear bases at home and overseas. In a culminating RAND report, labeled R-290 and issued in September 1956, Wohlstetter observed that preventing a Soviet surprise attack “requires protected airpower.”Footnote 22 Sheltering and dispersal of bomber aircraft would be crucial, but the best way to protect the forces of the Strategic Air Command (SAC), Wohlstetter argued, was through speedy response, getting SAC planes airborne within minutes of an initial alarm. A panel appointed by the National Security Council (NSC) in 1957, known colloquially as the Gaither Committee, recommended a SAC “‘alert’ status of 7 to 22 minutes, depending on the location of bases.”Footnote 23 By October of 1957, before the ink had dried on the Gaither report, SAC commander Thomas Power was already placing up to a third of his bomber force on fifteen-minute alert.Footnote 24
Rather than solve the problem of surprise attack, however, the SAC alert created the disturbing new possibility of retaliation by mistake. In R-290, Wohlstetter had recommended a special procedure for calling off an attack, known as “fail-safe,” according to which bombers launched in response to an early warning would proceed to target only after flying to a predesignated point and receiving a special order. “Unfortunately,” wrote Wohlstetter, “responding to ambiguous evidence means responding to false alarms. However, if SAC does not respond to false alarms, there is no guarantee that it will respond to an actual enemy attack.”Footnote 25 SAC implemented the plan. In April 1958, when Thomas Power briefed the NSC on the fail-safe procedure, Secretary of State John Foster Dulles immediately recognized its dangers. Might, asked Dulles, the Soviets “be uncertain whether these flights portended a real attack on the Soviet Union or not? Being thus uncertain, the Soviets might start their deliveries of nuclear weapons against the United States even though no actual attack by the United States on the Soviet Union was intended.”Footnote 26
Soviet officials found the SAC alert at least as troubling. In an interview with Hearst Newspapers in November 1957, Nikita Khrushchev described “the possibility of a mental blackout when the pilot may take the slightest signal as a signal for action and fly to the target that he had been instructed to fly to. Under such conditions a war may start purely by chance, since retaliatory action would be taken immediately.”Footnote 27 In an April 1958 press conference in Moscow, Soviet foreign minister Andrei Gromyko produced an even more vivid script for accidental Armageddon. Gromyko and his colleagues had read a United Press report claiming that in several instances, SAC bombers had been launched on retaliatory missions in response to meteorites and other “objects, flying in seeming formation” (i.e. birds) fluorescing on the radarscopes of the Distant Early Warning Line.Footnote 28 Imagine, Gromyko said, if the Soviets also happened to alert their bombers just as a mistakenly launched SAC fleet approached Soviet airspace. Then “the two air fleets sighting each other somewhere over the Arctic wastes would draw the natural conclusion that an enemy attack had indeed taken place, and mankind would find itself plunged into the vortex of an atomic war.”Footnote 29
Thomas Schelling, who immersed himself in the study of deterrence in early 1958, gathered these separate threads and wove them together: the idea that surprise offered the only advantage in general nuclear war, that early warning would enable a quick reaction, and that hyper-alert forces and false warnings may provoke a mistaken attack. As Gromyko made his speech, Schelling was in London on sabbatical from the economics department at Yale. He was in the midst of a remarkable career shift. A 1956 article on the theory of bargaining, and one the following year on bargaining and limited war, had caught the attention of analysts at RAND, who invited Schelling to spend the summer of 1957 as a visiting consultant.Footnote 30 He was not affiliated with Wohlstetter's group at that time, and it remains unclear what persuaded him to take surprise attack as his subject after touching down in London the following winter.Footnote 31 Some motivation was likely provided by the anxious national discussion then underway in Britain. A string of mishaps involving crippled planes and wayward bombs had sparked an ongoing debate in Parliament and the press about nuclear accidents, unintentional nuclear war, and the risks of basing of SAC aircraft on British soil.Footnote 32
Most strategic theorists had assumed that the purpose of deterrence was to prevent a deliberate war. In Schelling's view, the age of intercontinental bombers, missiles, and warning systems presented the harder case of preventing a war that neither side wanted. No one desired thermonuclear war, Schelling thought, but if war were to happen, each side might perceive an advantage to starting it. Moreover, each would believe that its rival perceived the situation similarly. A dangerous dynamic might evolve in which both sides would feel tempted to attack in order to beat the attack of the enemy, especially during a crisis. In a tense atmosphere of mistrust, an accident or misunderstanding might send the superpowers over the edge.
Deterrence, Schelling explained in a later essay, “is usually said [to be] aimed at the rational calculator in full control of his faculties and his forces; accidents may trigger war in spite of deterrence. But it is really better to consider accidental war as the deterrence problem, not a separate one.”Footnote 33 The outbreak or aversion of nuclear war would not be decided by a cool-headed cost–benefit calculation. It would be the outcome of a dynamic, autonomous process, unfolding beyond the complete, conscious control of the adversaries. In the new paper Schelling wrote between February and April 1958, he modeled this process, and called it the reciprocal fear of surprise attack.
The reciprocal fear of surprise attack
The Prussian military theorist Carl von Clausewitz described war as “nothing but a duel [Zweikampf] on a larger scale.”Footnote 34 Schelling began “Reciprocal Fear” with Zweikampf in the suburbs. Schelling-as-homeowner, gun in hand, creeps downstairs in the middle of the night to find a burglar similarly armed. “Even if he'd prefer just to leave quietly,” Schelling wrote, “and I'd like him to, there is danger that he may think I want to shoot, and shoot first. Worse, there is danger that he may think that I think he wants to shoot. Or he may think that I think he wants to shoot. Or he may think that I think he thinks I want to shoot. And so on.” Does the encounter end with shots fired?Footnote 35 In Clausewitzian style, Schelling expanded this domestic duel to superpower scale. Suppose, he continued, that there is “no ‘fundamental’ basis for an attack by either side”—that “the gains from even successful surprise are less desired than no war at all.” Suppose, too, that each side knows that if war occurs, it is better to be first than to be slow on the draw. Each side, wondering what the other may be planning, grows nervous and somewhat more prepared to attack. Yet each also knows that its rival, in the grip of identical thoughts, must also have become more fearful and more prepared to strike. It seems reasonable to make another cautionary increase in alertness and attack-readiness; but again, the same worry has certainly occurred to the other side. “It looks,” Schelling went on,
as though a modest temptation on each side to sneak in a first blow—a temptation too small by itself to motivate an attack—might become compounded through a process of interacting expectations, with … successive cycles of “He thinks we think he thinks we think … he thinks we think he'll attack; so he thinks we shall; so he will; so we must.”Footnote 36
Schelling began by trying to model the situation with a simple game. During his visit to RAND the previous summer, colleagues there had suggested a new monograph, R. Duncan Luce and Howard Raiffa's Games and Decisions, and Schelling spent, by his own estimate, perhaps a hundred hours reading it.Footnote 37 In the surprise-attack game he devised, two players confronted a choice between two moves—attack or withhold—yielding four possible game outcomes: both could attack, one could attack while the other withheld (and vice versa), and both could withhold. According to the payoffs Schelling set for the game, it was better to strike first than to be struck first, but the best outcome was to avoid war altogether. Schelling was not, however, interested in whether either player would decide to attack. He was interested in the possibility that the adversaries’ interacting expectations would cause them to grow more likely to attack. To that end, he assigned each player a probability of “irrational” (that is, inadvertent) attack—attack against one's better judgment—whose value could range between 0 and 1. Each player then calculated an expected payoff for the game, weighting the value of each alternative outcome according to the attack probabilities of both sides. Schelling could then see whether the two attack probabilities would interlock, driving one another other upward in an escalatory spiral.
To his disappointment, he found that they would not. Depending on the payoff assigned to a first strike, Schelling found certain critical values for the respective attack probabilities above which neither player could afford not to strike. If either attack probability exceeded its critical value, the game became a prisoner's dilemma, leading both players to strike. But if both probabilities started below these critical values, neither player would ever choose to strike. In either case, the game had failed to produce the dynamics Schelling had described in words. “We do not get any kind of regular ‘multiplier’ effect out of this [game model],” he wrote.
The probabilities of the two sides do not interact to yield a higher probability, except when they yield certainty. That is, the outcome of this game, starting with finite probabilities of “irrational” attack on both sides, is not an enlargement of those probabilities by the fear of surprise attack; it is either joint attack or no attack. That is, it is a pair of decisions, not a pair of probabilities about behavior.Footnote 38
This would not do. Instead of an escalation of the attack probabilities, the game produced decision: attack or don't. Schelling had wanted shades of gray; the game produced black and white. So he abandoned the game and tried something else.Footnote 39
As Schelling worked on his paper, Andrei Gromyko held his press conference in Moscow and spoke of nuclear war beginning with an erroneous radar signal.Footnote 40 To be effective, a warning system had to be sensitive. “But a warning system is not infallible,” Schelling wrote in the second half of “Reciprocal Fear.” “A warning system may err in either way: it may cause us to identify an attacking plane as a seagull, and do nothing, or it may cause us to identify a seagull as an attacking plane, and provoke our inadvertent attack on the enemy.”Footnote 41 False warning and mistaken retaliation were the crucial elements of Schelling's second model.
Schelling defined a new variable to connect false warning to mistaken attack. The “reliability” of each side's warning system, R, was the probability that the system would accurately identify an incoming strike. The better the warning system at spotting real attacks, however, the more likely it was to issue false positives, interpreting a bird as a plane and prompting a mistaken retaliation. Schelling therefore made each adversary's probability of inadvertent attack—denoted with the variable B—a strictly increasing function of its warning-system reliability. You can improve the sensitivity of your warning system so that you'll never be caught by surprise, but then you'll be more likely to fight a war by mistake.
How would the adversaries behave in the model? The first of three options Schelling considered (and the only one he explored in analytical depth) was something he called “dynamic adjustment.” Each side, he said, would continually observe the current values of the other side's warning-system reliability and attack probability, then adjust its own values according to a “behavior equation,” which it determined by minimizing its expected loss from the interaction. In this sense, both adversaries were perfectly rational. Yet neither adversary would ever reach a decision about whether to strike or not. Each adversary “responds to an estimate of the probability of being attacked not by an overt decision to act or abstain,” Schelling explained, “but by adjusting the likelihood that he may mistakenly attack.”Footnote 42
Then Schelling inserted a small but important mathematical detail. Each side, he said, would minimize its losses only with respect to the variable it could control—that is, with respect to its own attack probability (not with respect to its adversary's probability). This allowed Schelling to specify the entanglement between the attack probabilities that had eluded the previous model. Because each probability variable adjusted according to its own behavior equation, two separate relationships held simultaneously between the two attack probability variables: one relationship “desired” by the first side, the other “desired” by the second. The two probabilities would push and pull one another, each constantly adjusting in an attempt to satisfy its own behavior equation given the instantaneous value of its counterpart in the system. The fact that each adversary minimized losses only with respect to its own attack probability meant that neither anticipated rational behavior on the part of its rival. Instead, each made the (continually thwarted) assumption that its adversary's probability would remain constant. The second model, said Schelling, was one in which each side reacted “parametrically” to its environment. Neither imagined that it played against a strategic and rational opponent. Having stripped decision and anticipation out, Schelling had converted his game-theoretic model into a mechanical system of dynamic adjustment.Footnote 43
The question was whether the two sides’ attack probabilities would settle down or race upward toward certain nuclear war. Would deterrence hold or disintegrate? Schelling moved quickly. “We can express each player's optimum value of [B] as a function of the other's,” he wrote, “solve the two equations, and deduce the stability conditions for the equilibrium.”Footnote 44 First he derived the behavior equations—messy, coupled equations—and then cut through them with apparent ease. In a short passage of virtuoso math, he produced an exact condition for the equilibrium of the system, and the stability of this equilibrium.
Pause for a moment over these terms, “equilibrium” and “stability.” Equilibrium is the solution itself: the actual values of the two attack probabilities that jointly satisfy their respective behavior equations. Stability is a quality of the equilibrium: the tendency of the equilibrium solution to persist over time, correcting disturbances away from it. A stable equilibrium is self-restoring; an unstable equilibrium is one in which disturbances are self-aggravating. Think of a pencil balancing vertically on a flat surface. It is in equilibrium while it remains balanced, yet the slightest bump knocks it over. The equilibrium is quite unstable. Now think of a smoothly curved dish resting on its rounded side. If nudged, it wobbles and returns to its original position. The equilibrium is stable.
In the dynamic-adjustment model, stability meant the ability of the two attack probabilities to stick, and stay stuck, at mutual solution values.Footnote 45 With astonishing compression, Schelling described a test of this stability. Call the two adversaries “R” and “C,” and label their respective probabilities of inadvertent attack B r and B c.Footnote 46 According to Schelling,
A stable equilibrium requires that player R's (dB r / dB c) and C's (dB c / dB r) should have a product less than 1, i.e., that with B r measured vertically and B c horizontally, C's curve should intersect R's from below. The general “multiplier” expression relating changes in the B’s and R’s [i.e. the attack probability and warning-system reliability] to shifts in the functions … contains 1 minus this product in the denominator.Footnote 47
And that was all. If the idea of stability in nuclear strategy has a genesis moment, this is it.
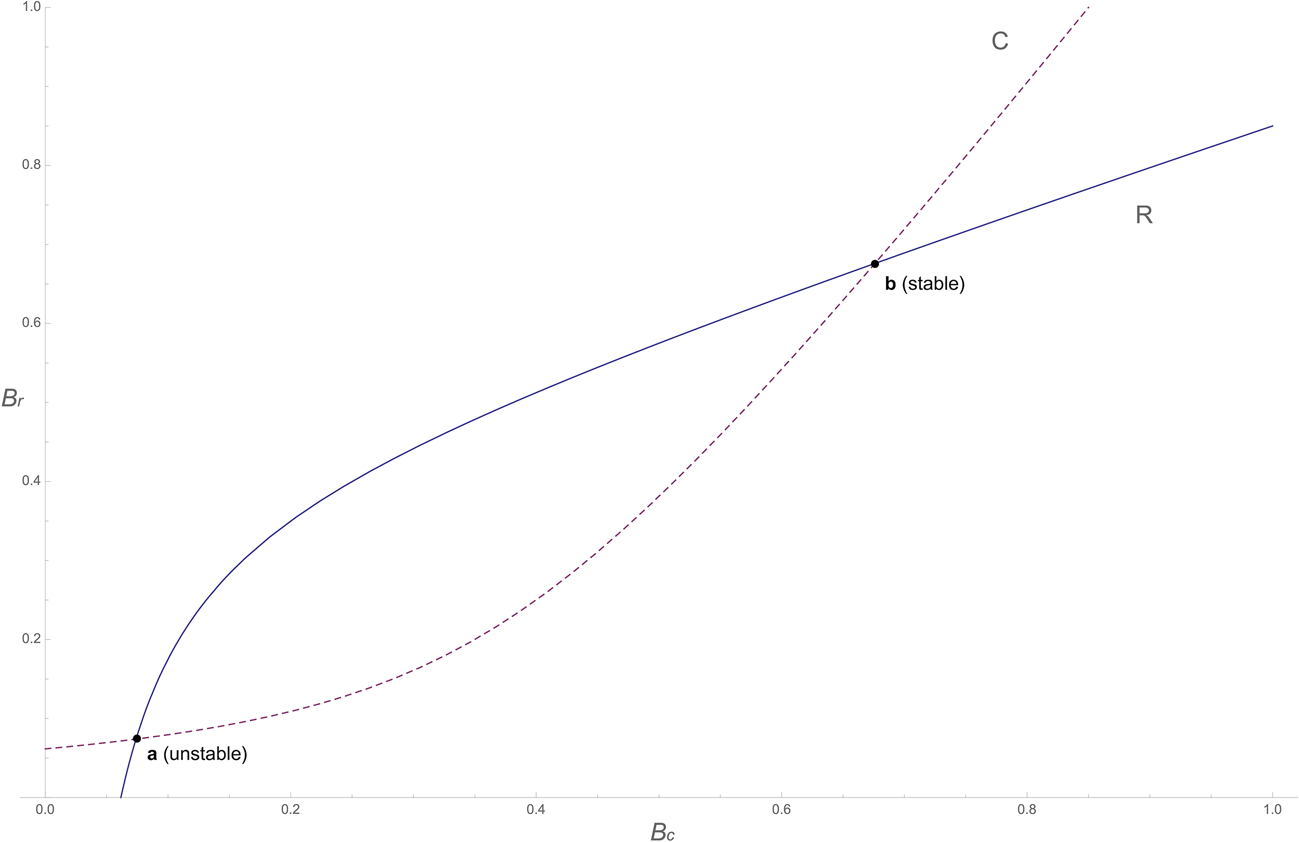
An enormous amount of information is contained in this brief passage (a more detailed technical discussion can be found in the appendix below). For now, note that Schelling invites us to picture a graph—one he did not draw in the paper. The graph measures side C's attack probability (B c) along the horizontal axis. Side R's attack probability (B r) is measured along the vertical axis. Two curves—one for side C, one for side R—show how each side's attack probability is governed by its behavior equation. Schelling instructs us that possible equilibria of the dynamic system are found where these two curves intersect. For an intersection to represent a stable equilibrium, says Schelling, “C's curve should intersect R's from below” at that point. In other words, to the left of the intersection, C's curve should fall below R's curve, and to the right it should rise above.
To explore Schelling's analysis, I solved Schelling's equations (assuming a simple form for the dependence of each side's attack probability on its warning-system reliability) and plotted the resulting curves in Figure 1. At two points on the graph, the two sides’ behavior equations are satisfied simultaneously: the intersections, or equilibrium points, a and b. At only one of these points, however, does the system come to a resting place capable of persisting over time: at b, the point of stable equilibrium.
A sample graph based on a graph briefly described, but not drawn, by Thomas Schelling in “The Reciprocal Fear of Surprise Attack.” The graph shows how each adversary adjusts its attack probability as a function of its rival's attack probability. Side C's behavior equation is represented by the dashed line; side R's is represented by the solid line. There are two solutions, or equilibria, of the system, where the lines intersect. The first intersection, at a, does not satisfy Schelling's stability condition (namely that C's curve should intersect R's from below). The equilibrium at a is therefore unstable and will not persist. The second intersection, at b, does satisfy the stability condition. Provided the system starts above and to the right of point a, it dynamically settles at point b. When the relationship between attack probability and warning-system reliability is more complicated than assumed for this example, additional stable and unstable equilibria are possible.
Why didn't Schelling draw an illustrative graph in the paper, or explain the stability condition in more detail? It is impossible to know with certainty. When I asked him, he remembered using “a lot of pencil and paper” to work through the analysis, but he could no longer recall why he did not include a graph.Footnote 48 Perhaps it simply didn't occur to him to try out sample functions, or time was short, or he didn't have access to plotting equipment in London. Maybe he assumed that his readers—the strategists of RAND's economics division, where the paper was printed in the spring—would follow the analysis without a graph.
Schelling considered two additional behavior hypotheses in “Reciprocal Fear,” describing these respectively as a noncooperative and a cooperative game. The noncooperative game was single-shot; the players simultaneously set their attack probabilities once, all in one go, neither knowing what value the other had set. This game, Schelling asserted, had an equilibrium “where the parametric-behavior [i.e. the dynamic-adjustment] hypothesis yielded a stable equilibrium.”Footnote 49 How so? Schelling didn't say. The implication seemed to be that both players would first imagine the dynamic-adjustment model, carry out Schelling's stability analysis, realize that the stable equilibrium was a point from which neither would unilaterally depart—and then jointly select it. In other words, the result of the noncooperative game was based on the stability analysis of the paper's previous section. In the cooperative game, the players would try to reduce the probability of war by, for example, negotiating to lower the sensitivity of their warning systems. Schelling could find no obvious solution here; bargains between the players, he noted, were “not in all cases stabilizing.”Footnote 50 Stability seemed harder to grasp under this behavior hypothesis.
The quibble, however, mattered less than the paper's bright new idea. Whether nuclear thinkers pondered Schelling's mathematics or not, the lesson they took from “Reciprocal Fear” was the promise of “stability”: deliverance from the incentive to strike first.
Stability as macroeconomic analogy
“The analogies keep tumbling out of his mind,” the decision theorist Howard Raiffa once said of Schelling's method, “as if he has an almost endless tabulation of concrete examples in his personal micro-micro computer and each new thought automatically triggers a search routine.”Footnote 51 A preternatural gift for analogy is part of the Schelling legend, and it has been easy to assume that stability—an idea he revisited throughout his career—was simply his favorite among the many analogies he selected from a realm of pure abstraction.Footnote 52 Of course, stability was an analogy. Its roots lay in eighteenth-century mechanics, where it soon found application in astronomy, hydrodynamics, and thermodynamics.Footnote 53 It had arrived in economics by the late nineteenth century, brought there most famously by Alfred Marshall, who had been trained as a mathematical physicist at Cambridge, and whose classic 1890 treatise Principles of Economics used mechanical metaphors to conceptualize stability in the balance between supply and demand. In the twentieth century, stability concepts bloomed across the social and systems sciences, from population ecology to sociology and cybernetics.Footnote 54
There was, however, something distinctive about the kind of stability that Schelling described: the bilateral stability of mutual adjustments between variables in a dynamic system. This was the sort of stability that Keynesian macroeconomists isolated in their models of national income and effective demand in the 1930s and 1940s. The resemblance was no accident. Schelling had not burst upon the world fully formed, after all. He had begun his professional life as a Keynesian mathematical modeler. The model of surprise attack he built in 1958 shared the same dynamic adjustment—and the same stability—as the models on which he'd worked as a young macroeconomist.
Like most formal thinkers, Schelling was trained, and his training left an indelible mark. As an undergraduate at the University of California, Berkeley, and then as a doctoral student at Harvard, Schelling learned to see the economy as a system of dynamic adjustment whose essential property was stability. He was a follower of the English economist John Maynard Keynes, who had published his landmark theory of the economy a few years before Schelling began his formal training. Keynes did not produce explicit mathematical models, but his many followers did. Economists of the “Keynesian revolution” thrilled to the sense that finally, in the wake of the Great Depression, they possessed a precise understanding of why the economy cycled, and how governments could reverse downturns and encourage growth. “In those days,” Schelling said of his education in the 1940s, “almost everyone was a Keynesian.”Footnote 55
Schelling studied Keynesian models in his dissertation and first book (National Income Behavior, published in 1951) and in every article he turned out in the 1940s.Footnote 56 Each of the models he constructed in this period was a system of dynamic adjustment, featuring “behavior equations” governing the movement of macroeconomic quantities: levels of consumption, investment, saving, government expenditure, taxes, price levels, employment, and so on. A central variable, the “national income,” measured the overall activity of the system.Footnote 57 The task of the modeler, Schelling explained in his dissertation-turned-book, was to “make explicit the adjustment process which is implicit in the behavior equations.”Footnote 58 It is no easy feat to grasp the simultaneous mutual adjustments of a system of many variables, so Keynesian modelers reduced this complexity by narrowing attention to pairs of variables and behavior equations, holding the others fixed.Footnote 59 In Schelling's models, these were typically the national income and a quantity Keynes called the “effective demand,” equal to the sum of consumption and capital investment.
As a young economist, Schelling was tutored in the techniques of stability. His earliest guides were William Fellner, his undergraduate mentor at Berkeley; Arthur Smithies, his supervisor during a year at the Fiscal Division of the US Bureau of the Budget; and Alvin Hansen, an expert on fiscal policy known by some as the “American Keynes,” and the closest thing to a thesis adviser Schelling had during his years at Harvard from 1946 onward.Footnote 60 Paul Samuelson, a previous student of Hansen's, presented a detailed discussion of static and dynamic stability in his magisterial Foundations of Economic Analysis, published in 1947. Schelling, who later described the book as “utterly absorbing, just what I was ready for,” immersed himself in Samuelson's mathematical approach to macroeconomics.Footnote 61
Among Schelling's modeling tools, one of the most important was a graph, whose crossing lines revealed states of stable and unstable equilibrium. By reducing the number of dynamic variables to two, the whole model—the entire economic system—could be summarized on a plot with the variables measured along orthogonal axes. This technique, too, was not original to Schelling. All of his teachers had drawn graphs before him. Samuelson had published the first national income graph in 1939, using it to investigate a quintessential Keynesian model he had devised with Hansen, known as the “multiplier–accelerator.”Footnote 62
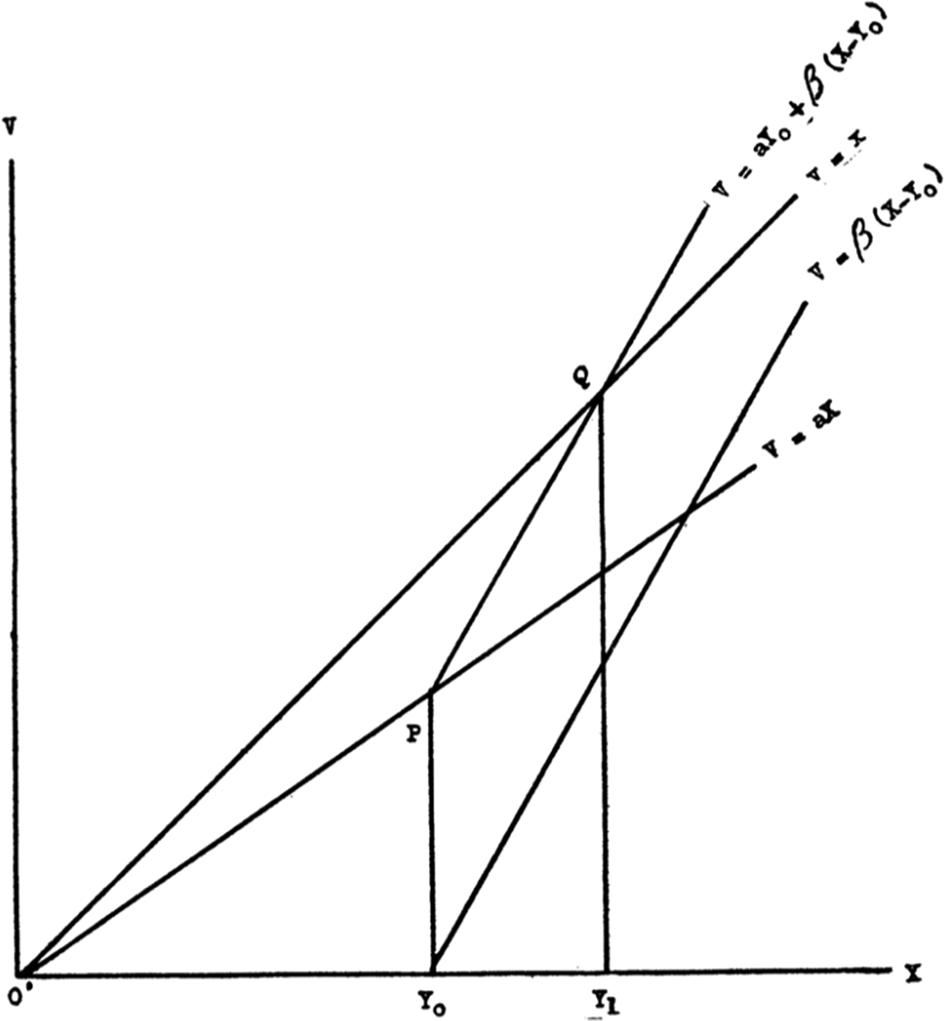
Schelling published his own national income graph for the first time in 1947, shown in Figure 2. It was conventional to draw the national income along one axis and the effective demand along the other. The solution to the model was found where the line representing the behavior equation for national income intersected the line representing the behavior equation for effective demand, stable provided the line measured by the horizontal axis cut the vertically measured line from below. “A solution is ‘stable,’ or the equilibrium it represents is ‘stable’,” wrote Schelling in 1951, “if deviations of the variables from their solution values lead to adjustment back to those solution values.”Footnote 63 In 1947 Schelling graphed a much-discussed model of perpetual economic growth (the “Harrod–Domar model”) and judged it unrealistic because the model required that the national-income line cut the aggregate demand line from above. “Clearly,” Schelling wrote, “the usual stability requirement is absent. Since the equilibrium—if equilibrium we consider it—is unstable, it is virtually irrelevant.”Footnote 64
Thomas Schelling's first published national income graph, from 1947. The behavior equation for the national income, measured along the horizontal axis, is given by the line v = x (the “forty-five-degree line” in Keynesian parlance). The effective demand required by the Harrod–Domar model, measured along the vertical axis, is given by the line v = ay o + β(x–y o). The equilibrium of the model is at Q, where the two lines intersect. Because the national-income line cuts the effective demand line from above (rather than below), the equilibrium is unstable. Schelling concluded that the model was therefore unviable. © American Economic Association; reproduced with permission of the American Economic Review. T. C. Schelling, “Capital Growth and Equilibrium,” American Economic Review 37/5 (1947), 864–76, at 874.
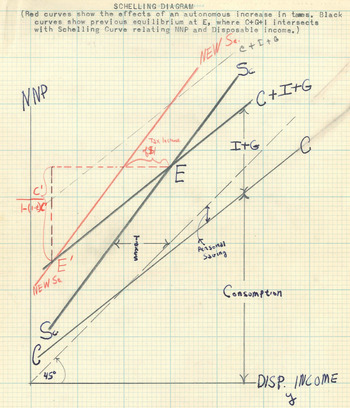
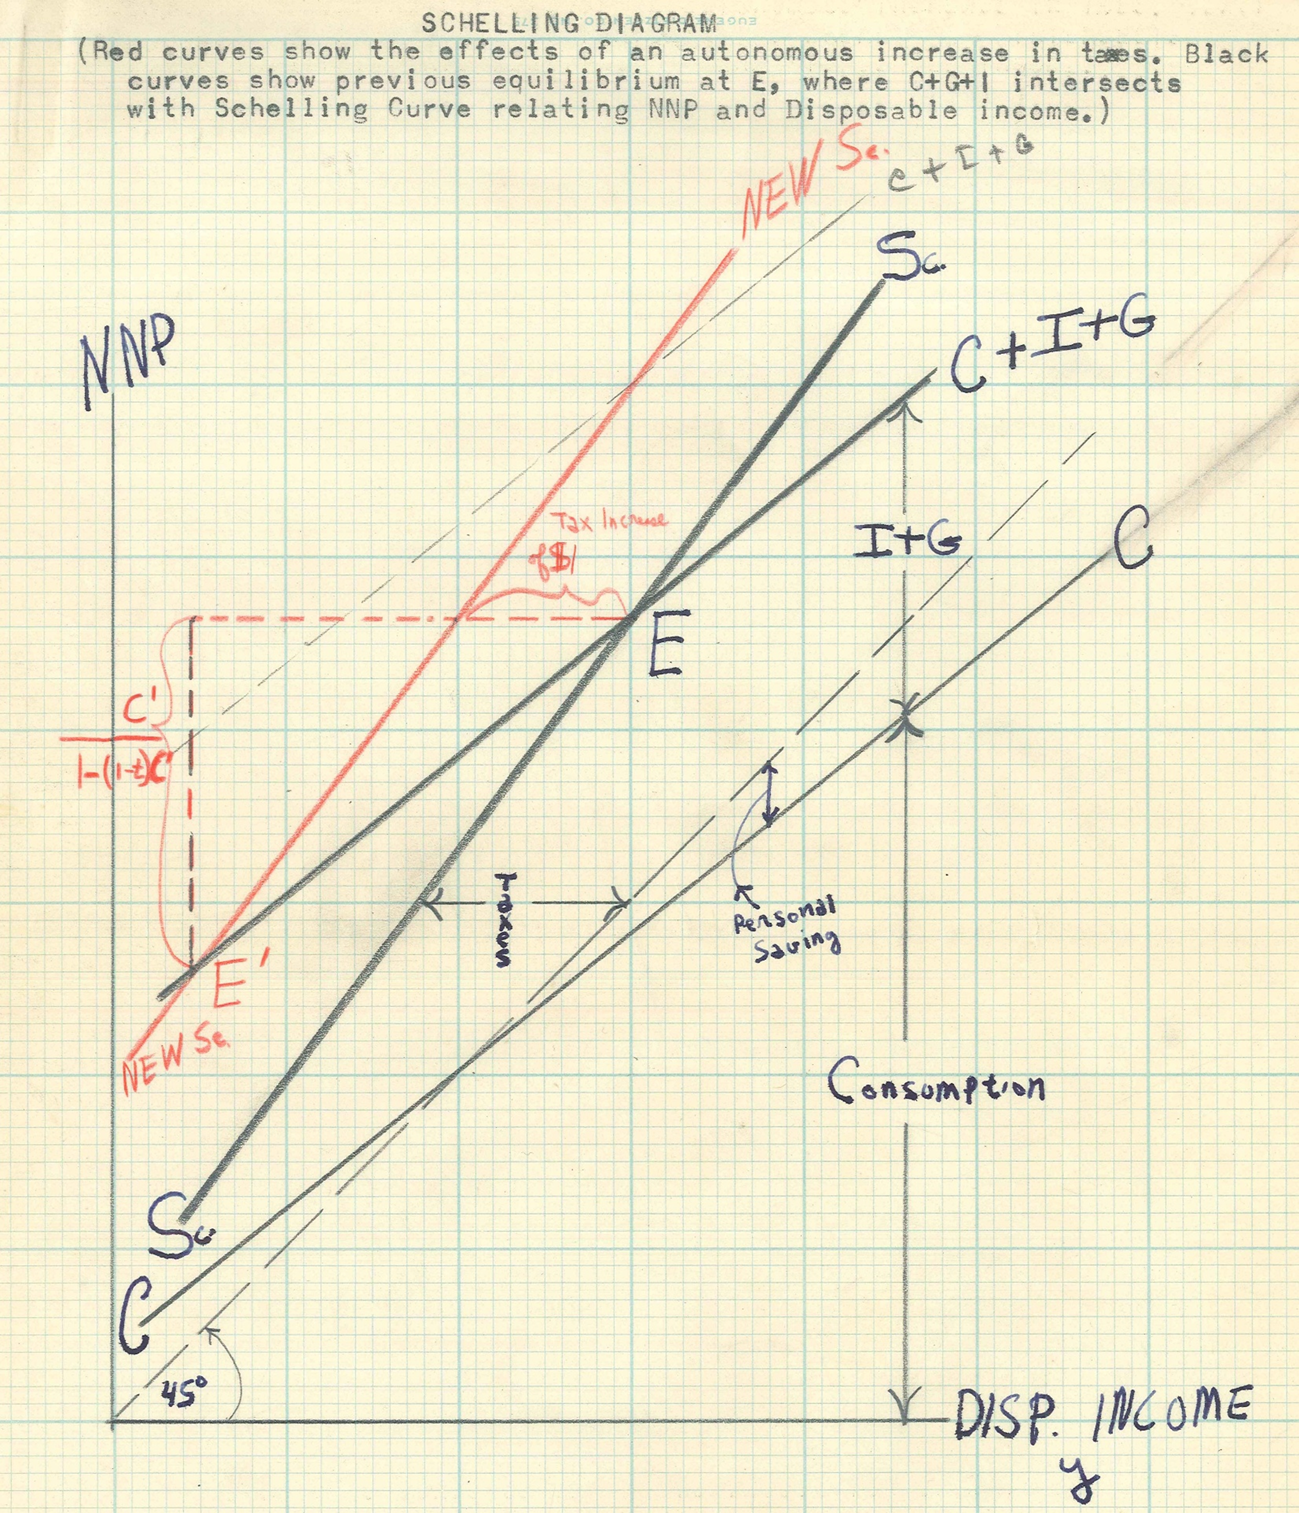
No mere user of the graphs, Schelling was an innovator of the form, refashioning the technique to novel ends. In just his second year of graduate school, he invented a version of the graph to investigate the effect of a tax increase on the national income. Paul Samuelson found the graph nifty enough to name it the “Schelling diagram.” Figure 3 shows a hand-drawn Schelling diagram in a letter from Samuelson to Alvin Hansen, probably based on a version Schelling himself had published in 1948.Footnote 65 The vertical axis measures the national income (Samuelson calls it “net national product”), and the horizontal axis measures “disposable income,” which is the national income adjusted by a constant rate of taxation. The system's equilibrium (labeled E) is found at the intersection between the line representing the effective demand and the “Schelling curve” (labeled Sc), which represents disposable income. We know the equilibrium is stable because the Schelling curve, measured by the horizontal axis, cuts the vertically measured effective-demand curve from below.
Paul Samuelson's hand-drawn “Schelling diagram” (undated, but almost certainly from 1948). The effect of a tax increase was to shift the Schelling curve leftward by the amount of the increase (i.e. to the line Samuelson has labeled New Sc), with the new equilibrium at the new intersection, labeled E′. This greatly simplified an otherwise tricky algebraic calculation. Exclaimed Samuelson to Hansen: “A pretty good diagram!” Reproduced with permission of the Harvard University Archives. Paul Samuelson to Alvin Hansen, 20 May (likely 1948), box “Correspondence ca. 1920–1975, L–Z, 2 of 2,” folder “Samuelson, Paul,” Alvin Harvey Hansen Papers, Harvard University Archives, Cambridge, MA.
For a mid-century Keynesian like Schelling, stability was more than a modeling aid. It was an article of faith, anchored in a conviction that the economy was a smoothly operating machine whose downward fluctuations could be tamed by the government's fine-tuned fiscal adjustments. The Keynesian stimulus mechanism was known as the “multiplier,” a mathematical formula dictating that an increase in investment would raise the national income by an amount greater than the increase in investment. It turns out that the stability of the system is guaranteed if the multiplier is larger than 1 but not infinite—a property that Keynes, in his 1936 General Theory, had referred to as the “first condition of stability.”Footnote 66 To Schelling, and to everyone in his circle, the very fact that the economy could persist at a roughly constant level of activity meant that it was fundamentally stable. For this reason, any macroeconomic model failing to exhibit stability could safely be discarded.Footnote 67
And so we return, finally, to 1958. To obtain the behavior equations, recall that Schelling stipulated “parametric behavior” on the part of the adversaries. Each adversary, adjusting its own attack probability, assumed that the other's attack probability would remain constant. A similar assumption arises in the Cournot duopoly, a classic nineteenth-century model of market competition in which two producers sell versions of the same product. Each producer changes its output while projecting constant output on the part of its rival. Schelling would surely have learned much about the duopoly from his teacher William Fellner, who had written a 1949 book on simple market structures.Footnote 68
But then Schelling would also have known Fellner's warning that the Cournot assumptions were incoherent, rendering the duopoly intrinsically unstable. Fellner had explained that reaction curves telling each seller how to adjust its output or price as a function of its rival's output or price could be used to identify the duopoly's equilibria and stability. But the equilibria were spurious, said Fellner, because the curves were themselves unstable—obtained on the shaky premise that each seller would adjust while wrongly projecting non-adjustment on the part of its rival. Continual disagreement between expectation and experience would induce “doubts [that] constitute a disturbance against which the system is thoroughly unstable.”Footnote 69 Fellner's knowledge of stability was shaped by his own macroeconomic practice. In 1944, years before writing about the duopoly, he had used crossed national income and effective demand curves to assess the dynamic stability of the economy's response to an injection of investment.Footnote 70
In 1958, Schelling used a duopoly-type assumption to get the behavior equations. But when he proposed that the adversaries’ attack probabilities adjusted dynamically along stable behavior curves, and when he used the multiplier to declare the system stable as a whole, he took leave of the duopoly and reached for his Keynesian toolkit. Here is Schelling the Keynesian in 1946: “The original assumption of a stable system, in which all relationships are consistent with each other and with a positive level of national income, restricts the values of [parameters in the model], otherwise the system is ‘explosive’—i.e., without a finite multiplier.” And Schelling the strategist in “Reciprocal Fear,” a dozen years later: “We get a simple dynamic ‘multiplier’ system, stable or explosive depending on the parameter values and shape of the [attack probability] function.”Footnote 71 A coincidence? More like an echo.
Nuclear strategy stabilized
Ask a security studies expert where the idea of stability came from, and they will tell you that it came from the insight that it is better to catch your enemy's weapons on the ground than it is to be struck first by those same weapons. Such a situation is unstable because, during a crisis, the temptation to attack might overwhelm the normal restraints of deterrence. Protecting retaliatory forces (the “secure second strike”) tranquilizes such first-strike incentives by eliminating the hope of launching a surprise attack that will not be met by a punishing second strike. The result is the opposite condition: stability. Robert Jervis, voicing a standard interpretation, assigns credit for the discovery as follows: “Albert Wohlstetter argued that the balance of terror was delicate (i.e., that a first strike could have major advantages). Building on this reasoning, Thomas Schelling explained that one of the greatest dangers of war was ‘the reciprocal fear of surprise attack.’”Footnote 72
Consider, though, that Schelling wrote “Reciprocal Fear” several months before Wohlstetter wrote his classic essay “The Delicate Balance of Terror.” Consider that Schelling wrote his paper in London, thousands of miles from Wohlstetter and the RAND Corporation (with no evidence to suggest that he had seen report R-290 or the Gaither Committee report). Consider too that a close reading of “Reciprocal Fear” reveals that Schelling, when he wrote it, was unfamiliar with the idea of the secure second strike. His paper was innocent of the RAND consensus on invulnerability, early warning, the distinction between first and second strikes, and the role of targeting.Footnote 73 A small detail, perhaps, but consider its implications. If the secure second strike is stability, as strategic folklore would have it, then to formulate one idea was to formulate the other. But since Schelling clearly introduced stability with little or no knowledge of the secure second strike, that cannot be right. The question changes—no longer how Schelling and Wohlstetter discovered stability in the secure second strike, but instead, how did the secure second strike become “stabilizing”?
In July 1958, Soviet officials agreed to Eisenhower's proposal for an East–West “conference of experts” on surprise attack, to be held in Geneva that autumn.Footnote 74 RAND was asked to supply background papers and to partially staff the American delegation to the conference. Wohlstetter helped direct RAND's efforts, taking the opportunity to summarize his views in a new essay, “The Delicate Balance of Terror,” printed by RAND at the end of 1958. The paper distilled proposals Wohlstetter had been advancing for years, describing in rich detail the operational requirements of a secure second strike, including the dispersal, concealment, and protection of nuclear forces.Footnote 75 He and his RAND colleagues had been recommending such policies for much of the 1950s. What was new for Wohlstetter was the conceptual packaging in which he now wrapped them: equilibrium and stability.
We can trace, at the level of line edits, how stability arrived in Wohlstetter's picture of deterrence. “Delicate Balance” had grown out of a series of talks Wohlstetter gave in 1957 and 1958, in which he developed his argument that the possession of nuclear weapons did not by itself guarantee the deterrence of a general war between the United States and the Soviet Union. Deterrence would require a difficult, costly investment in strategic forces and their protection. To a group of military visitors at RAND in November 1957, for example, Wohlstetter remarked that he and his RAND associates rejected “the widespread view that there is, in [Winston] Churchill's words, a balance of terror—simply because both East and West have nuclear weapons.”Footnote 76
Immediately after Schelling's “Reciprocal Fear” made the rounds at RAND in the spring of 1958, a new term appeared in Wohlstetter's speaking notes. In May 1958 (the month after the first draft of Schelling's paper was distributed), in a lecture at the Council on Foreign Relations, Wohlstetter now reported that his studies had discredited the common “optimism on the stability of the balance of terror.”Footnote 77 Over the summer, Wohlstetter began to rework his notes into the first complete draft of his new paper. In September he penciled a crucial addition into a typescript of the manuscript. “The balance is unstable,” he began—and then stopped, and struck out the word “unstable.” He tried again: “The balance is not automatic, because thermonuclear weapons give an enormous advantage to the aggressor. It takes great ingenuity and realism to devise a stable equilibrium.”Footnote 78 Deterrence was not automatic—this much had been clear to him for years. But a new thought had crystallized: deterrence could be steered, with effort, into a stable equilibrium. Deterrence could be stabilized with a secure second strike. Wohlstetter had borrowed Schelling's idea, abstracted it away from Schelling's model, and blended it with his own. The final version of Wohlstetter's paper was printed by RAND at the end of 1958 and published, in slightly condensed form, by Foreign Affairs in early 1959, where it became perhaps the single most famous essay in the history of nuclear strategy.Footnote 79
Schelling had arrived at RAND in late summer 1958 for a yearlong sabbatical.Footnote 80 Previously unversed in RAND's strategic lingo, he was a quick study. He now began to borrow key ideas from Wohlstetter, especially the distinction between first and second strikes and the notion that weapons needed protecting. By December, on the heels of Wohlstetter's “Delicate Balance,” Schelling had produced a new paper in which he too argued that a secure second strike would produce stability (a claim he had not made—had been unequipped to make—in his earlier paper). “It is not the ‘balance’—the sheer equality or symmetry in the situation—that constitutes ‘mutual deterrence’,” Schelling now wrote. “It is the stability of the balance … The situation is stable when either side can destroy the other whether it strikes first or second—that is, when neither in striking first can destroy the other's ability to strike back.”Footnote 81 In an elegant line, Schelling had equated stability and the secure second strike, smudging the original distinction between the two ideas. He, like everyone else, eventually forgot that they had ever been separate.Footnote 82
Analysts at RAND and elsewhere took up the formula. William Kaufmann had not mentioned stability in his essay on “the requirements of deterrence” in 1954, yet in the fall of 1958 suddenly Kaufmann was arguing for more survivable nuclear forces on the grounds that deterrence had “become essentially unstable.”Footnote 83 Bernard Brodie had never mentioned stability in his pathbreaking essays in The Absolute Weapon in 1946; but in 1959 he now quoted Schelling's definition of stability-as-secure-second-strike.Footnote 84 In 1960 Henry Kissinger, who had said nothing of the stability of deterrence in his previous studies of limited nuclear war, now urged that nuclear weapons be protected to “define a stable equilibrium between the opposing retaliatory forces.”Footnote 85 The conflation between stability and the secure second strike was complete. An idea that had had nothing to do with nuclear weapons had arrived, by a series of haphazard steps, at the center of nuclear discourse. Stability and the secure second strike were not synonymous—until they were.
Shock to the system
In the late 1950s, strategic analysts began to perceive a credibility problem for the declared nuclear policy of the United States. The threat of massive retaliation, meeting conventional Soviet aggression with a thermonuclear response, seemed increasingly suicidal given that the Soviets could (or would soon be able to) reply with their own thermonuclear-tipped missiles. Would Washington really sacrifice American cities because Soviet tanks had rolled over the West German border?
In early 1959, during his sabbatical year at RAND, Schelling devised what he regarded as a more credible threat: the threat to lose control, taking deliberate steps to raise the risk of an inadvertent general nuclear war. As Schelling explained to Bernard Brodie, the US could coerce the Soviet Union “not by threatening to launch general war in cold blood after some enormous blatant provocation, but [by threatening] to get ourselves and them somewhat dangerously involved so that even prudence on our part and prudence on their part cannot guarantee that they can save themselves at the last moment.”Footnote 86 A nuclear threatener in full command of itself might waver at the moment of truth. The laws of chance would not.
Where did Schelling get this incredible idea? Predictably, the most common answer has been game theory—specifically the game of chicken, in which two oncoming automobile drivers dare one another to swerve from their mutual collision course.Footnote 87 But Schelling didn't work with a game-theoretic formulation of chicken, and the matrix for the game was developed only in the mid-1960s, years after Schelling formulated the idea of risky threats.Footnote 88 Others have said that risky threats—because they must be interpreted perfectly by the threatened party and executed coldly by the threatener—demand a breathtaking confidence in the rationality of states and their leaders.Footnote 89
A different interpretation emerges from our reconstruction here. In a new paper titled “Randomization of Threats and Promises,” Schelling formulated the idea of a “probabilistic threat.”Footnote 90 A probabilistic threat is a threat such that, if the threatened party disobeys the threatener's demand, there is a chance that the threatener will carry out the punishment. Probabilistic threats divide the indivisible. No one can threaten to fire half a bullet, but one can threaten to flip a coin, pulling the trigger if the coin lands heads, holstering the gun on tails. A large threat was rendered more credible, thought Schelling, by fractionating it into smaller, probabilistically weighted units. To be sure, the notion of “randomizing” a threat calls to mind the “mixed strategy” of game theory, in which players randomize their moves over available choices. Yet Schelling went beyond this idea, mapping probabilistic threats onto the same system of interlocking probabilities he had recently defined in “Reciprocal Fear.”
Suppose, said Schelling, that the threatener might deliver punishment not only if the threatened side failed to comply but even if it did comply. Suppose too that punishment were costly to both parties, hurting threatener and threatened side alike. Such a threat was not only probabilistic but risky. To build this idea, Schelling defined two probabilities. The first was the chance of intentional punishment (following a failure of compliance); the second, an increasing function of the first, was the chance of accidental punishment (in spite of compliance).Footnote 91 These were precisely the roles that warning-system reliability and the probability of inadvertent attack had played in “Reciprocal Fear.” In that paper, reliability had measured the chance of intentional punishment (retaliating on purpose), and the probability of inadvertent attack had measured the chance of accidental punishment (retaliating by mistake).
Schelling's “Randomization” paper lacked a sense of dynamics. In a subsequent (and more famous) paper, “The Threat That Leaves Something to Chance,” he applied his risky-threat idea, sans mathematics, to the confrontation with the Soviets, now making the dynamics explicit. “Suppose the Russians observe that whenever they undertake aggressive action tension rises and this country gets into a sensitive condition of readiness for quick action,” he wrote. “May they not perceive that the risk of all-out war, then, depends on their own behavior, rising when they aggress and intimidate, falling when they relax their pressure against other countries?” A challenge to the status quo by one side (always the Soviets in Schelling's scenarios) would provoke an automatic and threatening adjustment by the other. More dramatically, a threatener (always the Americans) could purposefully elevate the risk of total war through “actions that … leave everyone just a little less sure that the war can be kept under control.”Footnote 92
The threat that left something to chance inhabited the same model world Schelling had constructed in 1958. A risky threat was a coercive manipulation of the system of dynamically adjusting inadvertent attack probabilities. Again, echoes from Schelling's Keynesian past reverberated. Back in 1949, he had argued that the government, by forcing a sudden inflation in prices, could drive the economy from a stagnant state of underemployment into one of full employment. To make his case, he developed a dynamic-adjustment model exhibiting bilateral stability in the relationship between two variables: unemployment and “price flexibility” (the rate of decline of aggregate wage and price levels). A shock was delivered in the form of a sudden price increase—a planned inflation—which immediately pulled the system out of equilibrium and briefly sent the economy into an even more desperate condition. Unemployment would initially skyrocket. “A cumulative interaction sets in,” Schelling wrote, “a ‘multiplier effect’ which finds [unemployment] pushing its own function value ahead at a faster rate than [unemployment] itself can adjust for some distance.” Ultimately the system would rebound to a new stable equilibrium, only this time at zero unemployment. “What we are talking about is a ‘cold turkey’ remedy, as opposed to a gradual tapering off,” Schelling concluded: full employment, the holy grail of Keynesian economics, delivered by shock therapy.Footnote 93
A risky threat operates along similar lines in a world where deterrence is a system like that depicted in Figure 1. In its most acute form, a risky threat is a discontinuous manipulation of the probability of inadvertent war—a shock to the system of attack probabilities.Footnote 94 Risky threats were dangerous to the extent that they involved a greater chance of war. But in Schelling's world, risky threats were safe in a deeper sense. The system was stable. You could bend it, but it wouldn't break.
In 1961, Schelling was invited to float his risky-threat idea at the highest levels of decision making. In June that year, Nikita Khrushchev handed John F. Kennedy an ultimatum demanding that the Western powers vacate West Berlin.Footnote 95 Nuclear weapons loomed over the Kennedy administration's deliberations that summer. Kennedy's national security adviser McGeorge Bundy approached outside consultants, including Schelling, for advice on the role of nuclear weapons in Berlin. In early July, Schelling submitted a classified paper, “Nuclear Strategy in the Berlin Crisis,” which Bundy included in a packet of weekend reading to accompany Kennedy to Hyannis Port later that month.Footnote 96 “The important thing in limited nuclear war is to impress the Soviet leadership with the risk of general war—a war that may occur whether we or they intend it or not,” Schelling wrote. If Kennedy were considering the nuclear option, then Schelling's recommendation was for a “selective and threatening use” of nuclear weapons to manipulate, in the most vivid way imaginable, the risk of a total cataclysm, and to use that risk to coerce the Soviets into backing down.Footnote 97
By what feat of conviction had Schelling asserted that thermonuclear detonations could be used as a tool of deterrence—that an H bomb could be used “selectively” to end the Berlin crisis? Some scholars have derided Schelling's counsel to Kennedy in 1961 as so much rationalistic make-believe.Footnote 98 We may all doubt the wisdom of the advice, but we should be clear about the foundation of Schelling's confidence. It wasn't superhuman rationality that fortified him. It was the belief of a Keynesian fine-tuner that a stable system could withstand a shock.
Conclusion
It is a peculiar fact that Schelling never—not in his writing, nor in his communication with me—recognized any relationship between macroeconomic stability and the stability of deterrence. He could see no connection between the two ideas, as though his move into nuclear strategy had entailed a complete break with his past.Footnote 99 It is difficult to know why, although it must be said that memory is fickle. It seems plausible that Schelling's understanding of events drifted, over the years, to match the fables generated by his considerable fame. Typical is the economist Robert Solow, who describes Schelling's doctoral dissertation as “an elaborately detailed and worked-out education in static income determination … having none of the later Schelling's tendency to see things from an angle no one had ever tried before.” Only after his pivot to bargaining and game theory, says Solow, did Schelling shed his mortal skin and become “The Later Schelling.”Footnote 100 In that case it would stand to reason that strategic stability, the handiwork of the post-metamorphosis Schelling, had nothing to do with Schelling the Keynesian.
The finding of this article is that strategic stability did have much to do with Schelling's Keynesian past. He formulated stability by way of analogy with Keynesian macroeconomic models. None of the mathematical appliances in “Reciprocal Fear” had been dictated by some Olympian “logic” or the mandates of strategic rationality, nor did they have anything to do with the “secure second strike.” To appreciate this is to realize that the idea of stability in nuclear strategy was not discovered, but made.
Analogy is directional, proceeding from an object about which knowledge is trusted to an object about which knowledge is sought. In that case we should ask not only about strategic stability's target but also about its source. What fate greeted stability in Keynesian macroeconomics? In the 1970s a crisis visited the modeling tradition in which Schelling had been raised. Stagnant employment coupled with abnormally high inflation (“stagflation”) rebutted the Keynesian models, like Schelling's shock model from 1949, that had insisted on a correlation between levels of inflation and employment. Here in unpleasant reality was the correlation in reverse. At the outset of the crisis, some modelers held tightly to inflationary policies as a check on unemployment. This, according to one widely noted postmortem critique of Keynesian methods, was “econometric failure on a grand scale.”Footnote 101 The president of the American Economic Association assessed the wreckage the following decade, concluding that “basic principles of economics have suffered inordinate confusion.” “To put matters bluntly,” he wrote, “many of us have literally not known what we are talking about.”Footnote 102 Even statistics on the national income, the bedrock of mid-century Keynesian models, were found to have been defined in conformity with the theory purporting to explain their behavior.Footnote 103
Some may deny that these trials for Keynesian modeling have anything to do with the status of stability. Why should it matter if some of the macroeconomic variables and relationships that Schelling once took for granted turned out to be poorly defined or unreliably measured? Surely stability itself, defined abstractly, is unthreatened by such foibles. Maybe—but the point really is that stability came to strategy through a formal model, and models of the kind Schelling developed in the 1940s proved, in the end, unable to catch hold of an unruly world. Is the economy like physics? Is nuclear deterrence like the economy? The philosopher of science R. B. Braithwaite put it well: “The price of the employment of models is eternal vigilance.”Footnote 104
Decades after its introduction, stability lives on in nuclear analysis. Even recent efforts to move beyond the orthodoxies of Cold War strategic thought continue to uphold stability as a yardstick with which to measure nuclear policies. The authors of the Department of Defense 2010 Nuclear Posture Review Report admonish policymakers to abandon “Cold War thinking,” then describe the key criterion of an arms-reduction treaty as “supporting strategic stability through an assured second-strike capability.”Footnote 105 Another pair of analysts claim that an ongoing technological revolution makes nuclear disarmament “increasingly dubious as a recipe for deterrence stability today” because forces can be targeted with pinpoint accuracy.Footnote 106 All of these authors position themselves as nuclear revisionists, laying aside an outdated conceptual architecture. Yet they share with their Cold War predecessors the belief that stability is the objective condition promised by the proper design, deployment, and protection of nuclear weapons.
Is it? Maybe stability has been a useful idea, encouraging policies that actually have made preemptive strikes less likely. But perhaps stability's main purpose, as much today as during the Cold War, has been to provide confidence to those who would claim intellectual mastery over weapons that shatter cities. This much seems certain: stability was the artifact of a model, created for a different purpose in another field, in an era before nuclear danger.
Appendix
This appendix explains in greater detail Thomas Schelling's stability analysis in “The Reciprocal Fear of Surprise Attack.” Here is how he describes the stability test:
A stable equilibrium requires that player R's (dB r / dB c) and C's (dB c / dB r) should have a product less than 1, i.e., that with B r measured vertically and B c horizontally, C's curve should intersect R's from below. The general “multiplier” expression relating changes in the B’s and R’s to shifts in the functions … contains 1 minus this product [of derivatives] in the denominator
(i.e. the multiplier expression is  ${1 \over {1-\left( {{{dB_r} \over {dB_c}}} \right)\left( {{{dB_c} \over {dB_r}}} \right)}}$).Footnote 107
Schelling states two equivalent criteria for stability. The first is the multiplier condition. Macroeconomists interpreted the multiplier in different ways.Footnote 108 Here we will follow Schelling's undergraduate mentor, William Fellner, and interpret the multiplier as a measure of the cumulative amount of change in one variable induced by a sudden shift in its counterpart variable. We assume these two variables comprise a system of dynamic adjustment, and that both initially satisfy their respective behavior equations (i.e. that the system begins in equilibrium). In the case of Schelling's model in “Reciprocal Fear,” the variables in question are the respective probabilities of inadvertent attack of sides R and C, B r and B c. Assuming the initial shift in one side's attack probability is relatively small, the cumulative amount of change induced in the other attack probability variable is proportional to a geometric sum: 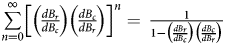 $\mathop \sum \limits_{n = 0}^\infty \left[ {\left( {{{dB_r} \over {dB_c}}} \right)\left( {{{dB_c} \over {dB_r}}} \right)} \right]^n\; = \; {1 \over {1-\left( {{{dB_r} \over {dB_c}}} \right)\left( {{{dB_c} \over {dB_r}}} \right)}}$.Footnote 109
If the product of derivatives,  $\left( {{{dB_r} \over {dB_c}}} \right)\left( {{{dB_c} \over {dB_r}}} \right)$, is less than 1, then the geometric sum converges. (The product is always positive because Schelling requires the attack probabilities to be increasing functions of warning-system reliability.) In that case the cumulative change in one variable induced by the shift in its counterpart is finite. This means that the system, following the initial shift, will eventually stop adjusting (i.e. it returns to equilibrium). However, if the product
 $\left( {{{dB_r} \over {dB_c}}} \right)\left( {{{dB_c} \over {dB_r}}} \right)$ is equal to or greater than 1, then the geometric sum diverges: the cumulative induced change in the second variable is infinite. This means that the system, once pushed from equilibrium, will never stop adjusting, drifting forever away. That is why Schelling says that stability—the tendency of the system to return to equilibrium—requires that the product of derivatives be less than 1 (equivalently, that the multiplier be finite). Note, too, that this requirement is only possible because B r and B c obey independent behavior equations. If a one-to-one relationship held between these variables, then the product of their respective derivatives would be equal to 1 everywhere.
The second stability criterion is the intersection condition. According to Schelling, on a graph with C's attack probability measured along the horizontal axis and R's along the vertical, a stable equilibrium is found where “C's curve intersects R's from below.” Note that this condition—stable where C's curve intersects R's from below, unstable where it intersects from above—holds only if C's and R's curves are increasing with respect to each other.
To create Figure 1, I first solved Schelling's equations to yield the two attack probability curves. Schelling derives the following behavior equation determining how side R adjusts its warning-system reliability (and therefore its attack probability) as a function of side C's reliability and attack probability:  ${{dP_r} \over {dR_r}} = {{P_ch\lpar {1-P_r} \rpar } \over {\lpar {1-P_c} \rpar \lsqb {1-h\lpar {1-R_c} \rpar } \rsqb -P_ch\lpar {1-R_r} \rpar }}$ (a small typo in “Reciprocal Fear” has been corrected here), where P r = A r + B r – A rB r is the total probability of attack for side R, A r is a constant “exogenous” attack probability independent of the warning-system reliability, B r = f(R r) is side R's attack probability function, R r is its warning-system reliability, and the parameter h is the value of a successful surprise attack (–h is awarded to the side that is attacked first). The value of joint attack is 0 and the value of joint withholding is 1, and we assume 0 < h < 1, so that it is worse to be struck first than to strike first, but best to avoid war altogether. An analogous equation holds for side C (with all the subscript r’s replaced with c’s), and side C is assumed to have its own attack probability function, B c = ϕ(R c).
To generate illustrative curves, I set A c = A r = 0 and chose a simple linear form for the two attack probability functions: B r = aR r + b and B c = αR c + β. I then solved the equations for B r and B c as implicit functions of one another, and arbitrarily selected the following values for the parameters: a = α = 0.3; b = β = 0.4; and h = 0.4. On the graph, one curve shows how C's attack probability adjusts as a function of R's, and the other shows how R's adjusts in response to C's. A pair of probability values (B c, B r) satisfying both behavior equations simultaneously is a “solution” or “equilibrium” of the system. This is where the curves intersect. Of the two equilibria shown on the graph, only one (at b) is stable, because C's curve intersects R's from below there.
Some patience is required to see why the intersection condition implies stability. The easiest approach is to imagine that the system begins in a state at neither a nor b, and then ask how things evolve. We can represent this state by an imaginary point p on the graph, corresponding to the values taken by B c and B r at that point. Side C's attack probability, B c, is measured along the horizontal axis. So if B c increases, p slides to the right; if it decreases, p slides to the left. Notice that if p were located exactly on C's curve, C's behavior equation would be completely satisfied; from C's perspective, there would be no reason to adjust its attack probability. But if p were located away from C's curve, C would respond by adjusting B c in order to move p to the left or right—whichever direction slides it toward C's curve. The same goes for R. If p does not lie on R's curve, R adjusts B r to slide p (in this case up or down) to move p toward its curve. Now suppose p lies somewhere in the middle of the graph, between the two curves. C wants to pull p to the right, and R wants to pull it upward. Thus p slides northeast until it reaches point b, where both curves are satisfied simultaneously. Once there, it moves no further. The reader can confirm for herself that point a exerts no such attraction. If the system happens to reside exactly at a, then it may stay there, but only as long as it remains impeccably undisturbed.
Note that because R r and R c are probabilities varying between 0 and 1, for the parameter values I chose in this example, B r and B c each are restricted to a range between 0.4 and 0.7. This range includes the stable equilibrium at b but not the unstable equilibrium at a. We could imagine a different set of parameter values for which the B variables are restricted to a range including no equilibrium or only an unstable equilibrium, in which case additional rules are necessary to specify the system's behavior. If the attack probability variables adjust to satisfy their behavior curves even where the curves extend to inaccessible regions of the graph, then presumably the variables migrate to stable equilibria at the boundaries of their allowed ranges. In any case, the system's exact behavior depends on the relative adjustment rates of the attack probabilities. Schelling did not include rates of adjustment in his model in “Reciprocal Fear,” nor did he in most of his Keynesian models. His most explicit discussion of rates of dynamic adjustment is found in his 1949 article on unemployment and price flexibility, and in his 1951 dissertation-turned-book.
Acknowledgments
For helpful conversation and feedback, I wish to thank Nathan Ballantyne, Målfrid Braut-Hegghammer, Lynn Eden, Philippe Fontaine, Francis Gavin, Michael Gordin, Catherine Herfeld, Christian Joas, David Kaiser, Kärin Nickelsen, Benoît Pelopidas, and Stefan Zieme. This essay benefited from discussion at the Society for the History of Recent Social Science at the London School of Economics, the Interdisciplinary Laboratory Bild-Wissen-Gestaltung at Humboldt-Universität zu Berlin, the History of Science Seminar at Ludwig-Maximilians-Universität München, the Department of Political Science at the University of Oslo, and sessions of the History of Science Society Annual Meeting and the Society for Historians of American Foreign Relations. Research was supported by the Max Planck Institute for the History of Science and a Stanton Foundation Nuclear Security Postdoctoral Fellowship at the Center for International Security and Cooperation, Stanford University. I would like to thank Angus Burgin, the editors of Modern Intellectual History, and three anonymous reviewers for their valuable input on an earlier version. Finally, I am grateful to the late Thomas Schelling, who patiently answered my questions by email, shared his thoughts in a conversation in October 2014, and insisted that he pay for lunch.