Introduction
Although health is generally believed to improve with higher wealth at low levels of development (e.g. Preston, Reference Preston1975; Marmot, Reference Marmot2004), research on HIV in sub-Saharan Africa has shown otherwise. Whereas researchers and advocates have frequently advanced poverty as a social determinant that can help to explain sub-Saharan Africa's disproportionate burden of HIV infection (e.g. Fenton, Reference Fenton2004; Coovadia & Hadingham, Reference Coovadia and Hadingham2005; Stillwaggon, Reference Stillwaggon2006), recent evidence from population surveys suggests that HIV infection is higher among wealthier individuals (Shelton et al., Reference Shelton, Cassell and Adetunji2005; LaChaud, Reference LaChaud2007; Mishra et al., Reference Mishra, Assche, Greener, Vaessen, Hong and Ghys2007a, Reference Mishra, Bignami, Greener, Vaessen and Hongb; Msisha et al., Reference Msisha, Kapiga, Earls and Subramanian2008a, Reference Msisha, Kapiga, Earls and Subramanianb; Forston, Reference Forston2008). Furthermore, the wealthiest countries in Africa have been shown to have the highest HIV prevalence rates and fastest increasing epidemics (UNAIDS, 2006; Fox, Reference Fox2010). Researchers have suggested that, in African settings, higher levels of wealth and economic development may facilitate access to more sexual partners, which can explain the positive association between wealth and HIV infection (Hunter, Reference Hunter2002; LeClerc-Madlala, Reference LeClerc-Madlala2004; Luke, Reference Luke2005; Smith, Reference Smith2007).
More nuanced studies taking a longitudinal approach suggest a dynamic process whereby wealth initially increases risk for HIV acquisition and later becomes protective (Hargreaves et al., Reference Hargreaves, Bonell, Boler, Boccia, Birdthistle and Fletcher2008; Parkhurst, Reference Parkhurst2010). This ‘inverse equity hypothesis’ suggests that wealthier individuals, who are better equipped to inculcate new knowledge about HIV transmission and have greater access to preventive and curative health technologies, will reduce their risk more quickly, generating social gradients in health that disproportionately affect the poor (Hargreaves, Reference Hargreaves2011). For instance, in a review of studies on the relationship between education and HIV in sub-Saharan Africa, Hargreaves et al. (Reference Hargreaves, Bonell, Boler, Boccia, Birdthistle and Fletcher2008) find that HIV infection rates have been shifting over the last two decades towards higher prevalence among the least educated in sub-Saharan Africa. Likewise, re-analysing the relationship between wealth and HIV using countries at different stages in the epidemic and available prospective data from Demographic and Health Surveys, Parkhurst (Reference Parkhurst2010) shows that in higher-income countries, rates of HIV infection do not increase with wealth and that the relationship between wealth and HIV infection can change over time in a given setting with HIV declining among wealthier individuals and increasing among poorer individuals. However, although Demographic and Health Surveys hold the promise of being able to assess the relationship between wealth and HIV prospectively, they are limited by the fact that these surveys are being collected 30 years into the epidemic and thus are unable to assess how present day social gradients in HIV infection have formed over time. Furthermore, previous research on the relationship between HIV and wealth has been conducted only at the country level, which has the potential to mask important differences across wealthy and poor areas within countries. In addition, the relationship between wealth and HIV infection has only been examined separately at either the individual level or at the aggregate level (level of economic development), even though the relationship between wealth and HIV may vary depending on the level of economic development of an area.
Other researchers have theorized that inequalities in wealth within countries may be more accurate in predicting their HIV infection levels than absolute wealth. In addition to being the wealthiest countries in Africa, Southern African countries – the countries with the highest HIV infection rates and the fastest growing epidemics – are some of the most unequal countries in the world economically (Fox, Reference Fox2010). Correlational studies at the country level have found a significant association between economic inequality and HIV prevalence (Over, Reference Over, Ainsworth, Fransen and Over1999; Drain et al., Reference Drain, Smith, Hughes, Halperin and Holmes2004; Talbott, Reference Talbott2007). In explaining the relationship between inequality and HIV infection, Barnett et al. (Reference Barnett, Whiteside and Decosas2000) theorize that inequality works through reduced social cohesion to affect epidemic dynamics since countries with low social cohesion are almost invariably unequal, known as the Jaipur paradigm. They theorize that the shape of the epidemic curve in a country will depend on both the degree of social cohesion in a society and a society's overall level of wealth. In wealthy countries with high levels of social cohesion (e.g. Sweden, UK, France), HIV infection rates will be low and poor countries with high social cohesion will experience slow-growing epidemics (e.g. Senegal). Countries with both low wealth and low social cohesion will have slow-growing but severe epidemics (e.g. Uganda). Their model anticipates the fastest growing epidemics occurring in countries with higher wealth but low social cohesion – factors characteristic of the Southern African region. Barnett & Whiteside do not theorize how exactly low social cohesion translates into higher HIV infection levels. Other researchers have observed that in countries with greater socioeconomic inequality HIV infection may be higher among poorer individuals, whereas in more equal countries, wealthier individuals have a higher likelihood of being infected. Reviewing 36 studies, Wojcicki (Reference Wojcicki2005) finds that in wealthier sub-Saharan African countries, where inequalities in wealth are wider, studies suggest that greater wealth may decrease risk for HIV infection, whereas in poorer countries, where inequalities in wealth are narrower, studies indicate that poorer individuals have a higher risk of HIV infection (Wojcicki, Reference Wojcicki2005). These observations about the relationship between socioeconomic inequality and HIV outcomes have not been systematically tested across countries at varying stages of economic development, nor within countries to see whether the differences observed across countries also hold within countries.
Prior studies have also failed adequately to assess the mechanisms by which economic inequality or absolute wealth may influence HIV infection. Yet, the relationship between the social determinants of health and health outcomes is incomplete without an understanding of the mechanisms that link these distal determinants to more proximal determinants. Existing qualitative studies suggest that wealth inequality may increase patterns of sexual concurrency (i.e. having two or more sexual partners overlapping in time), which has been shown to be a risk factor for HIV in Africa that potentially explains the rapidly increasing rates of infection (Epstein, Reference Epstein2007). Inequality has been theorized to increase concurrency through several possible mechanisms. First, wealth differentials may create opportunities for informal transactional sex (sex with the mutual expectation of provision of monetary or material benefits) between relatively wealthier men and relatively poorer women (e.g. Heise & Elias, Reference Heise and Elias1995; Gilbert & Walker, Reference Gilbert and Walker2002). This is the most commonly cited explanation but focuses on unequal economic relationships between men and women rather than economic differentials in society. Otherwise, transactional sex may be premised on economic inequality in society in two ways. On the one hand, declining living standards associated with, for instance, structural adjustment programmes, increase relative deprivation, especially among women, leading to an increase in patterns of transactional sex as desperately poor women exchange sex to meet their basic survival needs (Schoepf et al., Reference Schoepf, Schoepf, Millen, Kim, Millen, Irwin and Gershman2000; Poku, Reference Poku2002). On the other hand, rising living standards among a few, while many remain desperately poor, can also generate relative deprivation and lead to pressures for transactional sex as upwardly mobile women seek out wealthy male ‘sugar-daddys’ who can provide them with ‘cars, cash and cell phones’, to satisfy their growing consumer urges (LeClerc-Madlala, Reference LeClerc-Madlala2004; Luke, Reference Luke2005; Smith, Reference Smith2007). When this transactional sex takes the form of multiple, overlapping partnerships, concurrent in time, this can substantially increase the rate of spread of HIV infection (Morris, Reference Morris1997).
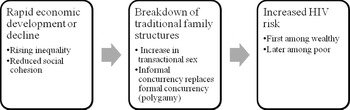
Alternatively, sexual networks may change in higher inequality settings. In wealthier, urban settings, where inequalities in wealth are wider, researchers suggest that there has been a decline in formalized polygamous unions but a rise in informal concurrent sexual partnerships, including the maintenance of secondary households that are not codified within the bonds of marriage (Parikh, Reference Parikh2007; Hunter, Reference Hunter2010). The exact mechanisms leading to the breakdown of polygamous unions is unclear. Ethnographic research on the increasing prevalence of companionate marriage (marriages premised on love and companionship rather than obligation) suggests that both economic transformations in developing countries and ideational change have affected marriage and informal partnering patterns (Hirsch & Wardlow, Reference Hirsch and Wardlow2006; Parikh, Reference Parikh2007; Smith, Reference Smith2007). These informal networks may be riskier than formal concurrency, where sexual networks are more likely to be overlapping rather than discreet and non-overlapping. Relatedly, economic migration, fuelled by unequal economic circumstances, constitutes another mechanism through which economic inequality may increase informal sexual network structures that promote concurrency (Hunter, Reference Hunter2007). Although archetypally economic migration is thought to encourage male migrants to take on non-marital partners, more recent research has found that both women who migrate to urban centres, and women who remain behind in rural areas while their partners migrate, take on informal, long-term partners (Lurie et al., Reference Lurie, Williams, Zuma, Mkaya-Mwamburi, Garnett and Sweat2003). Thus, rising relative deprivation resulting in a breakdown of social cohesion and traditional family structures can help explain why HIV infection might be higher in more unequal settings (see Fig. 1). No previous empirical studies with population data have explicitly tested the relationship between sexual concurrency and the positive association between wealth and HIV or inequality and HIV infection.
Theoretical model: relationship between development and HIV risk.

The current study sought to address several gaps in the literature. First, whereas most studies have focused either on the individual-level relationship between wealth and HIV infection or on the aggregate relationship between economic development and HIV prevalence, this analysis examines both relationships simultaneously using multi-level analysis. In addition, the study considers the distribution of economic resources and how this conditions HIV risk above and beyond absolute wealth. Furthermore, whereas other studies have used data representative of the country as a whole, which may mask important variations within countries, this study disaggregates within countries to explore variations between wealthier and poorer regions and urban and rural settings separately. Specifically, the study uses regional-level data from sixteen African countries to examine the relationship between regional inequality, regional and individual wealth, and individual HIV infection, adjusted for individual- and country-level effects. The study also evaluates how the relationship between HIV infection and individual wealth varies between wealthier and poorer regions and between rural and urban areas within regions. Finally, the study explores possible behavioural and biological mechanisms by which economic inequality may influence HIV infection, with a special focus on concurrent sexual partnerships. This work can add to our understanding of HIV infection patterns by assessing the impact of socioeconomic variables at different levels of analysis across a range of high-, medium- and low-prevalence countries in sub-Saharan Africa and by exploring how social factors contribute to HIV infection in sub-Saharan Africa. Findings from the study can assist in informing the ongoing debate over whether poverty or wealth is a more prominent factor contributing to the spread of HIV in developing countries. Additionally, the analysis extends previous work in explicitly examining the mechanisms that potentially link distal social variables to proximal HIV infection. This approach is in keeping with a proximal determinants framework, which calls for the use of multi-level models to assess simultaneously individual- and community-level factors associated with HIV infection using conceptual frameworks to guide the analysis (Bärnighausen & Tanser, Reference Bärnighausen and Tanser2009).
As with prior studies, this study has certain limitations. Owing to the lack of long-run longitudinal data dating back to the beginning of the epidemic, the study is unable to directly assess how wealth gradients in HIV infection have changed over time – specifically whether HIV initially affected wealthier individuals more and has increasingly descended the social gradient. Instead, the study examines countries at various levels of economic development and at different stages in the epidemic in order to test how social gradients vary among countries with different background characteristics. Also, by looking at epidemic patterns within countries, the study can assess how living in settings with different levels of wealth and wealth distribution conditions risk for HIV infection. The study hypotheses are as follows:
1. Individuals living in more unequal settings will have a higher odds of infection, controlling for absolute wealth.
2. In wealthier settings, HIV should be higher among poorer individuals whereas in poor settings HIV should be higher among poor individuals.
3. Individuals who are relatively poor (neither the wealthiest nor the poorest) should have the highest odds of infection.
Methods
Data source
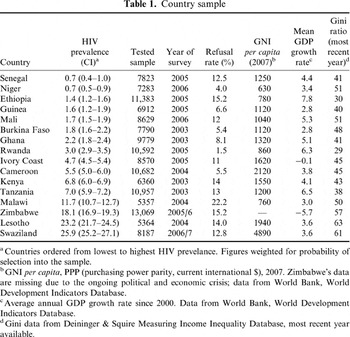
This research draws on multi-national data from DHS with linked individual HIV test results from sixteen sub-Saharan African countries (see Table 1 for sample summary). The DHS are an international series of nationally representative household surveys conducted in middle- and lower-income countries (Fisher & Way, Reference Fisher and Way1988; Mishra et al., Reference Mishra, Vaessen, Boerma, Arnold, Way and Barrere2006). In recent years, the DHS programme has become a major source of data on HIV infection in many countries.
Country sample

a Countries ordered from lowest to highest HIV prevelance. Figures weighted for probability of selection into the sample.
b GNI per capita, PPP (purchasing power parity, current international $), 2007. Zimbabwe's data are missing due to the ongoing political and economic crisis; data from World Bank, World Development Indicators Database.
c Average annual GDP growth rate since 2000. Data from World Bank, World Development Indicators Database.
d Gini data from Deininger & Squire Measuring Income Inequality Database, most recent year available.
This study uses a multi-level framework to model HIV serostatus at individual, regional and national levels of analysis. Utilizing multi-stage cluster sampling techniques, DHS sample sizes and sampling procedures are adjusted to ensure statistically meaningful estimates can be reached for each region and for both urban and rural populations (Mishra et al., Reference Mishra, Vaessen, Boerma, Arnold, Way and Barrere2006), which are easily adaptable to a multi-level approach to data analysis (Gelman & Hill, Reference Gelman and Hill2007). Sample sizes within the sixteen countries vary depending on the size of the country's population, the number of administrative units and other factors.
Currently, approximately 24 countries have collected biomarkers for HIV. This study includes sixteen of these 24 countries, representing high-, medium- and low-prevalence countries in West, East and Southern Africa (Table 1). There is a relatively close correspondence between the level of economic development and the sub-regions in sub-Saharan Africa, with low-prevalence West African countries being relatively poor compared with higher prevalence countries, though this relationship is not straightforward (Table 1). For instance, as a result of internal political turmoil, the Ivory Coast (a medium-prevalence country) and Zimbabwe (a high-prevalence country), which previously had a stronger economic performance, have been declining economically over the past decade to the point in Zimbabwe where development indicators have essentially become guesswork. The two richest West African countries – Cameroon and Ivory Coast – have higher infection rates than other West African countries. Swaziland, the country with the highest prevalence rate, is the richest country in the sample; however, high-prevalence Malawi is one the poorest countries. Unfortunately, the countries that serve as the economic hub of Southern Africa – South Africa, Botswana and Namibia – do not have publicly available DHS surveys with linked HIV tests. Because this is a truncated sample at the country level, where selection of countries was based primarily on the availability of datasets, comparisons across countries will be kept to comparisons among high-, medium- and low-prevalence countries rather than across other country-specific characteristics. Whereas previous studies have assessed the wealth gradient across the country as a whole, this study is primarily interested in examining the distribution of HIV within countries at the meso-level rather than between countries.
Refusal rates to HIV testing modules are worryingly high in some countries, though they are surprisingly low in other countries (Table 1). Although researchers have raised questions about possible selection bias given the high refusal rates to the HIV testing module in certain countries (e.g. Bärnighausen et al., Reference Bärnighausen, Bor, Wandira-Kazibwe and Canning2011), Opuni-Akuamoa (Reference Opuni-Akuamoa2009) finds that even though the impact of selection into HIV testing on prevalence estimates is potentially severe, this selection bias is likely to have only a limited impact on the association between economic status and HIV infection. Because wealthier individuals have higher non-response, the positive relationship between wealth and HIV cannot result from selection bias as a result of poorer individuals being more likely to refuse to be tested for HIV (Opuni-Akuamoa, Reference Opuni-Akuamoa2009). Nevertheless, in keeping with DHS recommendations, as a result of especially high non-response in Lilongwe (the capital of Malawi), this region has been dropped from the analysis.
Dependent variable
The principal dependent variable for this study, HIV serostatus, was measured as the test result from the DHS HIV test. Although precise methods of collection may vary slightly from country to country, in all countries, blood samples were collected from willing and informed participants to test for HIV using two Enzyme-Linked Immunosorbent Assay (ELISA) tests that would also allow for sero-typing.
Independent variables
The constructs of individual wealth status and sub-national inequality for this study were assessed and constructed using the DHS wealth index. The exact assets that go into the wealth index vary from country to country depending on the presence or absence of various questions, but generally include at minimum the following: type of flooring (e.g. dirt, cement, parquet), water supply (e.g. surface, communal well, piped), sanitation facilities (e.g. bush, pit latrine, flush toilet), electricity, radio, television, telephone, refrigerator, transportation (e.g. bicycle, motorcycle, car) (Rutstein & Johnson, Reference Rutstein and Johnson2004). The questions used to construct the wealth index are posed as part of the household component of the survey and not asked of each individual. Thus, individuals are coded according to household wealth. Furthermore, because the specific assets included in the wealth index vary across countries, the index is not directly comparable across countries. In order to make the index comparable across countries, the index would have to be limited to a core set of assets that are common across countries. Forston (Reference Forston2008) finds, however, that limiting the wealth index only to assets that are comparable across countries makes the index unreliable. Although a standard index would add a great deal to the study, computing a comparable wealth index was not feasible. Because the purpose of the study was to assess trends in HIV infection within countries rather than comparing across countries as other studies have done, the original wealth index for each country is utilized, which provides a more comprehensive measure of wealth within each country. Consequently, rather than making comparisons on country characteristics, this study compares regional characteristics within countries and country-level effects are fixed to isolate variation within countries from variation between countries. In addition, the axes of graphs have been re-scaled to increase the visibility of within-country variation.
Measures of income and consumption have been criticized for being inaccurate in developing countries, where much of the population works in subsistence agriculture. Recall bias, self-employment and unpaid home-based production are among the many criticisms of using income and consumption as measures of economic well-being among the poorest households (Rutstein & Johnson, Reference Rutstein and Johnson2004). Although these three measures do not always yield highly congruent results (Filmer & Scott, Reference Filmer and Scott2008), the wealth index is considered to be as reliable and valid a proxy for economic well-being as income or consumption measures in low-income countries (Filmer & Pritchett, Reference Filmer and Pritchett2001; Filmer & Scott, Reference Filmer and Scott2008).
Because wealth index scores are calculated using principal components analysis, scores can take on either negative or positive numbers. Consequently, it is not possible to calculate traditional measures of inequality (including Gini coefficients) unless the score is transformed to make all values positive and greater than zero (McKenzie, Reference McKenzie2005; Sahn & Stifel, Reference Sahn and Stifel2003). The most commonly utilized additive transformation technique (adding the lowest negative value to make all scores positive) has been demonstrated to have distortionary (redistributive) effects on the underlying distribution (Sahn & Stifel, Reference Sahn and Stifel2003). Therefore, this study utilized an alternative transformation developed by Wai-Poi et al. (Reference Wai-Poi, Spilerman and Torche2008), which uses an exponential transformation of the wealth index and finds a high correspondence between the standard deviation of regional wealth index scores and the Gini coefficients generated from the exponentiated wealth index. To examine inequality in this study, Gini coefficients were constructed using these transformed (exponentiated) household wealth index scores at the national and sub-national levels. Wealth Ginis were calculated for each region within each country, weighted for probability of selection into the sample.
To account for the pathways through which wealth and inequality may have influence HIV infection, the effects of male circumcision, STDs and concurrent sexual partnerships, which have been identified as primary drivers of HIV epidemic patterns in sub-Saharan Africa, were assessed (e.g. Potts et al., Reference Potts, Halperin, Kirby, Swidler, Marseille and Klausner2008; Buve et al., Reference Buve, Hayes, Auvert, Ferry, Robinson and Anagonou2001). Self-reported male circumcision (asked only of men) was aggregated and measured as the percentage of men circumcised in each region to account for the fact that women's risk is also increased by living in area where there are low rates of male circumcision. Sexually transmitted diseases were measured as self-reported genital sores in the past year. Individuals were coded as having a concurrent sexual partnership if they reported having had an extramarital partner in the past year, with the assumption that, if the respondent were married and reported extramarital sex, these sexual encounters were overlapping in time. Formal concurrency, i.e. polygamous marriages, which is probably less risky than informal concurrency, was also assessed at the individual level. Because a primary transmission pathway is thought to be sexual behaviour, only individuals that reported ever having sex were included in the analysis. An older age at sexual debut is expected to reduce the probability of exposure and hence was also included in the analysis. Models were additionally adjusted for education, age, gender and marital status as appropriate. Because prior research has identified concurrent sexual partnerships as a plausible mechanism linking HIV infection to increased wealth and economic inequality, in a separate model, the pathway of extramarital partners was assessed as the dependent variable to better understand the relationship among wealth, inequality and this risk factor for HIV infection.
Multi-level modelling and statistical analysis
Among its many applications, multi-level modelling works with the clustered or hierarchical nature of sample data utilizing sampling units at different levels of analysis to model inferences at the individual level (Goldstein, Reference Goldstein1999; Gelman & Hill, Reference Gelman and Hill2007). Multivariate relationships between the outcome measure (HIV serostatus) and independent variables at the individual and regional level were assessed across the sixteen countries. All multivariate models were run as two-level, hierarchical varying intercept and slope models adjusted for clustering at the regional level with the national level treated as fixed effect. The three levels consisted of 133,568 respondents clustered within 170 regions across sixteen countries. The average number of respondents for each region was 484.
The analysis proceeded in several steps. First, a two-level, random-intercept model was fitted with regional Gini coefficients and other aggregate and individual-level controls adjusting for country-level effects. To examine whether economic inequality had an effect on HIV risk independent of individual wealth, an individual measure of wealth was added to the model to test the effect of wealth on HIV status and to examine whether inequality remained significant after accounting for individual wealth. A quadratic measure of wealth was added as well to test whether the relationship between wealth and HIV was non-linear. Cross-level interaction terms between regional and individual wealth were then added to test whether the relationship between wealth and HIV varies between wealthier and poorer regions and an interaction term for wealth and urban was added to determine whether the relationship between wealth and HIV is modified by living in an urban area. Each model was repeated for urban and rural areas separately to assess conditional trends between rural and urban areas. Given the final specifications for wealth and inequality, the intervening effects of an additional set of explanatory variables including sexual behaviour, circumcision and STI infection were modelled. The primary mechanism hypothesized to explain the relationship between wealth, inequality and HIV – concurrent sexual partnerships (measured as extramarital partners) – was modelled separately as a function of wealth inequality and of absolute wealth to assess whether extramarital partnerships vary by wealth and inequality levels in a manner that can explain observed patterns of HIV infection.
Plotting the random slopes and intercepts generated from the multi-level analysis allows visual inspection of the data (Gelman & Hill, Reference Gelman and Hill2007). Graphs of random slopes and intercepts were drawn to examine the direction of the relationship between wealth and HIV infection within wealthier and poorer regions as well as in rural and in urban areas within regions. In order to improve the readability of graphs, because of the different scales of the epidemic and wealth across countries, the graphs have been re-scaled to maximize the visibility of within-country variation. All data analysis was completed using Stata version 11 (StataCorp; College Station, TX, USA).
Results
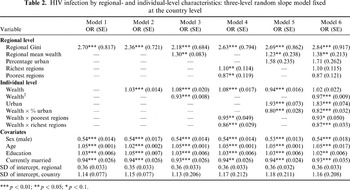
As hypothesized, the odds of HIV infection are higher in regions with greater wealth inequality, accounting for country-level effects (OR=2.70, p<0.01) (Model 1, Table 2). Furthermore, regional inequality remained significantly associated with individual HIV infection even taking into account individual wealth (OR=2.36, p<0.01), demonstrating a contextual effect of economic inequality on HIV infection beyond the risk associated with individual wealth (Model 2, Table 2). Regional wealth was also positively associated with HIV infection (OR=1.30, p<0.05) (Model 3). In the poorest two regions within countries, however, regional poverty was protective against HIV (OR=0.87, p<0.05) compared with the richest two regions where HIV risk was higher (OR=1.13, p<0.05) (Model 4, Table 2). Even after accounting for regional wealth, however, the relationship between inequality and HIV infection remained positive and significant (OR inequality=2.18, p<0.01) (Models 3 and 4, Table 2).
HIV infection by regional- and individual-level characteristics: three-level random slope model fixed at the country level

***p<0.01; **p<0.05; *p<0.1.
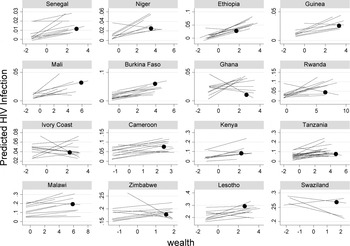
The effect of individual wealth on HIV infection varied by the wealth of the region. At the individual level, in keeping with previous studies, the model demonstrated that wealthier individuals, rather than poorer individuals, had on average higher odds of HIV infection, adjusted for country-level effects (OR=1.03, p<0.01). When expressed as a quadratic function, however, wealth took a negative slope (OR=0.93) as compared with the linear term (OR=1.15). With maximum wealth values between 4 and 8, this demonstrated that wealth formed an inverted-U-shape relationship with HIV infection. In addition, interacting individual wealth with regional wealth (living in a rich or a poor region) showed that in poor regions HIV increased with wealth (1.08×0.94=1.02), and in wealthy regions HIV decreased with wealth (1.08×0.81=0.87). Thus, in the poorest regions individuals who were wealthy were more likely to be infected, and in the wealthiest regions individuals who were poor were more likely to be infected (Model 4, Table 2). Figure 2 shows that in most regions within countries HIV generally increased with wealth, but in the wealthiest regions HIV infection was higher among individuals who were poorer. In low-prevalence countries HIV infection increased with wealth in most regions, whereas in medium- and high-prevalence countries HIV decreased with wealth in more regions (Fig. 2). Specifically, in low-prevalence countries 90% of the HIV–wealth slopes were positive, versus 79% in medium-prevalence countries and 67% in high-prevalence countries, indicating that in higher prevalence countries HIV decreases with wealth in more regions.
HIV–wealth gradients, all regions, sixteen countries. Mean wealth of wealthiest region denoted by circle. In most regions, HIV increases with wealth, but in the wealthiest regions (denoted with a circle), HIV infection is higher among poorer individuals. In low-prevalence countries, 90% of slopes were positive, versus 79% in medium-prevalence countries and 67% in high-prevalence countries indicating that in higher prevalence countries HIV decreases with wealth in more regions. Countries ordered from low to high HIV prevalence (left to right). Country axes re-scaled to enhance within-country variation.

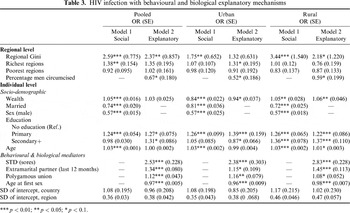
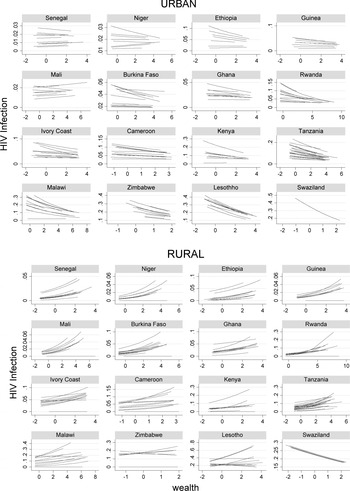
The effect of wealth on HIV infection also varied between urban and rural areas within regions. In Table 2, the interaction between wealth and urban residence was inverse suggesting that HIV decreases with wealth in urban settings (1.07×0.74=0.79) (Model 4). Entering urban residence also reversed the direction and decreased the significance of the wealth term suggesting that urban residence explains much of the positive relationship between wealth and HIV infection. Furthermore, in the stratified analysis (Table 3, Model 1), among urban areas there was a significant inverse relationship between HIV and wealth (OR=0.84, p<0.01), while among rural areas there was a significant positive relationship between HIV and wealth (OR=1.04, p<0.1) (see Table 2). Visual inspection of the random slopes showed that in urban areas HIV primarily declined with wealth, whereas in rural areas HIV mainly increased with wealth (see Fig. 3). In spite of these different wealth trends in HIV infection by area of residence, in both urban and rural areas, greater regional inequality significantly increased the odds of an individual being infected with HIV (OR urban=1.75, p<0.05; OR rural=3.44, p<0.01) net of absolute wealth (Table 3).
HIV infection with behavioural and biological explanatory mechanisms

***p<0.01; **p<0.05; *p<0.1.
HIV–wealth gradients in urban and rural areas. HIV decreases with wealth in most urban areas within regions and increases with wealth in most rural areas within regions. One exception is Swaziland, where HIV is lower among poor individuals in both rural and urban settings. Countries ordered from low to high HIV prevalence (left to right). Country axes re-scaled to enhance within-country variation.

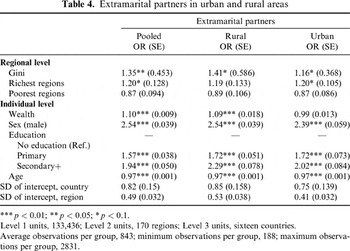
The effects of wealth inequality and absolute wealth were partially explained by the hypothesized behavioural and biological mechanisms. Inclusion of behavioural and biological variables at the individual and regional levels attenuated the effects of wealth inequality and regional and individual wealth on HIV infection (Model 2 in Table 3). The separate model predicting the odds of being in an extramarital partnership by inequality and wealth showed that the likelihood of being in an extramarital partnership was higher in regions with more wealth inequality (OR=1.35, p<0.05) and in wealthier regions (OR=1.20, p<0.1), even after accounting for individual wealth (Table 4). Overall extramarital partnerships were more common among wealthier individuals (OR=1.10, p<0.01). In rural areas, the odds of being in an extramarital partnership increased with an individual's wealth (OR=1.09, p<0.01), although in urban areas, there was no significant association between extramarital partnerships and individual wealth (OR=0.99, p>0.1) (see Table 4).
Extramarital partners in urban and rural areas

***p<0.01; **p<0.05; *p<0.1.
Level 1 units, 133,436; Level 2 units, 170 regions; Level 3 units, sixteen countries.
Average observations per group, 843; minimum observations per group, 188; maximum observations per group, 2831.
Discussion
The findings from this study indicate that an individual's odds of HIV infection are higher in more unequal regions within countries adjusted for absolute wealth. The significance of inequality in predicting risk for HIV infection within countries is consistent with suggestions from previous researchers (Over, Reference Over, Ainsworth, Fransen and Over1999; Drain et al., Reference Drain, Smith, Hughes, Halperin and Holmes2004; Talbott, Reference Talbott2007), but this study is the first to produce empirical evidence of these effects using data from multiple countries and regions in sub-Saharan Africa. This finding also supports studies that show that economic inequality tends to increase risk for a variety of diseases controlling for absolute wealth (e.g. Kennedy et al., Reference Kennedy, Kawachi, Prothow-Stith, Lochner and Gupta1998; Wilkinson & Pickett, Reference Wilkinson and Pickett2006; Harling et al., Reference Harling, Ehrlich and Myer2007), although this is one of the few studies to demonstrate this finding for an infectious disease in a developing country setting.
Although absolute wealth was also associated with HIV infection, its effect was paradoxical. Living in a wealthier region increased an individuals' odds of HIV infection whereas living in a poorer region was protective. Yet, wealth was positively associated with HIV infection in regions that were poorer and negatively associated with HIV infection in regions that were wealthier overall. Thus, risk for HIV is higher in wealthier areas, but within wealthy areas, poorer individuals are more likely to be infected with HIV. Likewise, risk for HIV is lower in poorer areas, but wealthier individuals have a higher odds of being infected in poor areas. This additional evidence of a non-linear relationship between wealth and HIV infection suggests that relatively poor individuals – neither the wealthiest nor the poorest – were the most at risk for HIV infection. Similarly, with regions, wealth was positively associated with HIV infection in rural areas, which tend to be poorer, and negatively associated with HIV infection in urban areas, which tend to be wealthier. In contrast with previous research that has found that urbanicity confounds wealth (Opuni-Akuamoa, Reference Opuni-Akuamoa2009), this study found that urbanicity modifies the relationship between wealth and HIV infection. The relationship between inequality and HIV infection and between absolute wealth and HIV findings persisted, even accounting for marital status, gender, age and education. The significance of the results was attenuated, however, with the introduction of sexual and biological mechanisms that might plausibly explain the relationship between the social variables and HIV infection. The odds of having an extramarital partner, a sexual risk factor for HIV, was found to be more common in more unequal settings, and to generally increase with wealth, controlling for other factors.
One explanation for the finding that in poorer rural areas HIV infection was higher among wealthier individuals is that economic inequalities between rural and urban areas fuel HIV disparities, potentially through economic migration. Theoretical literature on internal migration has suggested that better-off families (less credit-constrained) in rural areas should be more likely to send family members to urban centres in search of work (Rapoport, Reference Rapoport2002). Remittances from migrant family members to rural households may in turn reduce rural poverty and help households offset the costs of migration for future members (Barham & Boucher, Reference Barham and Boucher1998). If the better-off in rural areas migrate to urban areas in search of work (and sending households become better-off as a result of migrant remittances), wealthier migrants will be more likely to contract HIV and transmit the virus to the rich in rural areas, which could help explain the seeming paradox that wealthy individuals are infected in poor rural areas and poor individuals are infected in wealthy urban areas. Though migrants and sending households may be considered poor in an urban context, they may be far better off than their fellow rural residents. Hunter (Reference Hunter2007) for instance, finds that the higher rates of HIV in poor informal settlements in urban areas in South Africa can be explained by a high level of female-headed households brought about by circular migration, particularly of women from rural areas to informal settlements in urban settings. In keeping with ethnographic work, the current study found that extramarital partnerships, a form of sexual concurrency, are more common in wealthier and more unequal regions and are higher among the wealthy in rural areas, though there is no relationship between wealth and extramarital partnerships in urban areas. This finding can help to explain why HIV is higher among wealthier individuals in poor, rural settings, though not the finding that the poor have higher infection rates in wealthy, urban settings. Wealthier individuals may be more likely to use condoms with extramarital partners in urban settings compared with the urban poor.
The fact that absolute wealth was still positively associated with HIV infection, even as inequality remained significant, may result from the fact that in developing country settings, economic development and inequality are highly correlated. Classical economic development theory suggests that in developing country settings, inequality initially increases with economic development and that inequality in wealth is generally higher in wealthier areas such as urban centres (Kuznets, Reference Kuznets1955; Moran, Reference Moran2005). For this reason it might be expected that more developed areas within countries will have greater inequalities in wealth. Greater risk of HIV infection may therefore stem from heightened inequality in more developed areas rather than from higher absolute wealth on its own. In keeping with previous research on this topic (Wojcicki, Reference Wojcicki2005; Human Science Research Council, 2005; Parkurst, Reference Parkhurst2010), this study found more inverse gradients in high-prevalence countries – mainly wealthier and more unequal Southern African countries – compared with poorer and more equal low-prevalence countries in West Africa.
These findings also have theoretical implications for research on the social determinants of health, which has debated the degree to which health inequalities inevitably accrue to the poor through biological mechanisms or are socially reproduced through stratification mechanisms (Link & Phelan, Reference Link and Phelan1995; Lynch et al., Reference Lynch, Davey-Smith, Kaplan and House2000). These findings support a dynamic interpretation of health inequality formation. Though cross-sectional analysis only provides a snapshot of information, the findings of varying trends in HIV–wealth gradients between rich and poor areas in this study suggest that social gradients in HIV infection are not static. The finding from this study, that HIV infection rates were higher among relatively poor individuals in wealthier areas but higher among relatively wealthy individuals in poorer settings, suggests that social gradients in HIV infection may be in the process of reversing in wealthier urban settings. Whereas early in the epidemic, HIV infection might have initially been highest among the richest individuals who had the most sexual partners, these patterns could be in the process of reversing as HIV increasingly becomes a disease concentrated among the relatively poor. These findings of inverse wealth gradients in wealthy settings are bolstered by Parkhurst's (Reference Parkhurst2010) recent DHS trend analysis where he finds that HIV is higher among wealthier individuals in poorer, low-prevalence countries though is more prevalent among poorer individuals in wealthier, high-prevalence countries, a finding also supported by a systematic review of the literature on the relationship between poverty and HIV in developing countries (Wojcicki, Reference Wojcicki2005). Likewise, in a trend analysis of data from Tanzania, Parkhurst (2010) finds that HIV has become more prevalent among poorer individuals over time. Hargreaves' work on the changing relationship between HIV infection and education – what he terms the ‘inverse equity hypothesis’ – also supports the notion that wealth gradients are in the process of changing in sub-Saharan Africa (see e.g. Hargreaves et al., Reference Hargreaves, Bonell, Boler, Boccia, Birdthistle and Fletcher2008; Hargreaves, Reference Hargreaves2011). In contrast with research that finds that health inequalities are relatively stable and tend to accrue to the poorest members of society (e.g. Marmot, Reference Marmot2004), the findings from this study support research that shows that social gradients in health may result from a dynamic process in which wealthier individuals, because of their greater knowledge, prestige and power, are better able to adapt to new health threats, reproducing social inequalities in health (Link & Phelan, Reference Link and Phelan1995). If this is the case, ironically, successful efforts to contain HIV may generate health disparities that fall more heavily on the poor. Previous studies have only assessed the impact of prevention campaigns on infection rates in the aggregate and have not examined whether particular social groups benefit more from these interventions (e.g. Parkhurst, Reference Parkhurst2008).
These findings have additional implications for behavioural interventions to reduce HIV risk in sub-Saharan Africa. Behavioural prevention efforts in sub-Saharan Africa, though less expensive to administer than biomedical interventions, have not produced substantial reductions in HIV infection (Parkhurst, Reference Parkhurst2008). With the exception of Uganda and Thailand, there is little evidence that national policy responses have made large differences in HIV infection rates (Parkhurst, Reference Parkhurst2008). Researchers have suggested that a failure to address underlying structural conditions may be a source of the failure of behavioural prevention efforts and have recommended structural interventions that will address the underlying conditions that give rise to intervention failure (e.g. Pronyk et al., Reference Pronyk, Kim, Hargreaves, Makhubele, Morison and Watts2005). Without addressing the economic sources of HIV risk, large-scale behavioural interventions may be unlikely to produce substantial risk reduction.
It is important to note some limitations to this study. Because the data presented are cross-sectional, it is only possible to observe the relationship between inequality, wealth and HIV risk at a given moment in time. Also, this study has only addressed the upstream relationship between wealth and initial infection with HIV and has not dealt with the downstream effect of HIV infection on wealth. Although wealthier individuals may become infected with HIV at higher rates, subsequently their infection may result in a loss of household wealth, and poorer individuals that become infected with HIV could plausibly progress to AIDS and deteriorate at a faster pace than the wealthy. High mortality rates among the riskiest populations early in the epidemic could have produced these social trends in infection within countries, although longitudinal research from South Africa suggests otherwise (Bärnighausen et al., Reference Bärnighausen, Hosegood, Timaeus and Newell2007). It is also possible that the inverse-wealth gradients in richer regions may result at least partially from high non-response among the wealthiest individuals, which might obscure their true infection rates. Selection is unlikely to account fully for the inverse gradients in wealthier areas, but this possibility cannot be entirely ruled out. Future research should attempt to parse out the relative contribution of behaviour change, selection and mortality in producing social gradients in HIV infection. Although this research cannot adjudicate among these possibilities, the paper contributes a more nuanced understanding of the relationship between wealth, poverty and HIV than previous research looking either at a positive or negative gradient on its own or looking separately at individual and aggregate predictors of HIV infection. In addition, this analysis provides only partial support for the various theoretical pathways through which inequality and wealth operate to produce differential gradients in HIV infection. Subsequent research should examine the partial relationship between sexual behaviour patterns and HIV observed in this research and directly assess the role of migration patterns in producing social gradients in HIV infection. Notwithstanding these limitations, these findings contribute an important new approach to understanding the mechanisms underlying varying trends in HIV infection between and within countries in sub-Saharan Africa and globally.
Conclusions
Despite the vast popular and rhetorical attention that poverty has received as an underlying cause of HIV in sub-Saharan Africa, this research finds that the HIV–poverty thesis is in need of substantial qualification. Absolute, subsistence-level poverty does not appear to place individuals at heightened risk for contracting HIV. Rather, HIV increases with economic development and inequality, or relative deprivation. The increasing incorporation of individuals into burgeoning middle classes in developing countries seems to be a better explanation for wealth trends in HIV infection than increasing poverty and immiseration. Finally, if indeed wealthier populations are benefiting disproportionately from HIV prevention efforts in developing countries, more attention should be given to how these interventions can be delivered in a more equitable manner to avoid reproducing social gradients that disadvantage people who are poor.
Acknowledgments
The author wishes to thank Peter Messeri and Constance Nathanson for their input and guidance on this paper through its many iterations, and her committee members Paul Wilson, Ronald Bayer and Andrew Gelman for their feedback and contributions. Special thanks go to Elizabeth Bradley for bringing the manuscript to its final form. This research was supported by the Horowitz Foundation for Social Policy, Robert K. Merton Award for Studies in the Relation between Social Theory and Public Policy and the American Psychological Association, Graduate Student Research Awards Program.